
Artifact Detection of Wrist Photoplethysmograph Signals
Kaat Vandecasteele
1,2
, Jes
´
us L
´
azaro
1,2
, Evy Cleeren
3
, Kasper Claes
4
, Wim Van Paesschen
3
,
Sabine Van Huffel
1,2
and Borb
´
ala Hunyadi
1,2
1
KU Leuven, Department of Electrical Engineering (ESAT), STADIUS Center for Dynamical Systems,
Signal Processing and Data Analytics, Leuven, Belgium
2
imec, Leuven, Belgium
3
KU Leuven, University Hospital, Department of Neurosciences, Leuven, Belgium
4
UCB, Brussels, Belgium
Keywords:
Artifact Detection, Photoplethysmography, Wrist, Feature Selection.
Abstract:
There is a growing interest in monitoring of vital signs through wearable devices, such as heart rate (HR). A
comfortable and non-invasive technique to measure the HR is pulse photoplethysmography (PPG) with the
use of a smartwatch. This watch records also triaxial accelerometry (ACM). However, it is well known that
motion and noise artifacts (MNA) are present. A MNA detection method, which classifies into a clean or MNA
segment, is trained and tested on a dataset of 17 patients, each with a recording duration of 24 hours. PPG-
and ACM-derived features are extracted and classified with a LS-SVM classifier. A sensitivity and specificity
of respectively 85.50 % and 92.36 % are obtained. For this dataset, the ACM features do not improve the
performance, suggesting that ACM recording could be avoided from the point of view for detecting MNA in
PPG signals during daily life.
1 INTRODUCTION
There is a growing interest in wearable and continu-
ous monitoring of vital signs, such as heart rate (HR).
A comfortable and non-invasive technique to measure
the HR is pulse photoplethysmography (PPG). PPG
makes use of reflected or transmitted light through
the skin to measure a pulsatile physiological wave-
form caused by changes in the blood volume due to
a heart beat. Common PPG recording locations in-
clude fingers, ears, toes, forehead or wrist (Allen,
2007). The wrist is a possible recording location. An
advantage is that the PPG sensor can be embedded
in a watch. However, it is well known that motion
and noise artifacts (MNA) can distort the signal (Pet-
terson et al., 2007). Those MNA are caused by 1)
the movement of venous blood as well as other non-
pulsatile components 2) variations in the optical cou-
pling between the sensor and the skin (Barker and
Shah, 1997; Tobin et al., 2002). The MNA can be
particularly challenging when computing derived fea-
tures from the PPG waveform such as HR. Various
design approaches to reduce MNA have been pro-
posed (Li and Warren, 2012). With these improve-
ments, MNA are stil present. Therefore, algorithm-
based MNA reduction methods were proposed (Tor-
res et al., 2016; Lai and Kim, 2015; Fukushima
et al., 2012; Pan et al., 2016; Torres et al., 2016;
Yousefi et al., 2012; Ram et al., 2012; Lee et al.,
2010; Temko, 2017; Torres et al., 2016; Kim and
Yoo, 2006). These MNA reduction algorithms op-
erate also on clean parts of the signal, which is un-
necessary computation and can cause distortion of the
signal. Therefore an algorithm which can distinguish
clean parts from MNA is desired. MNA detection al-
gorithms are designed with the use of waveform mor-
phologies (Sukor et al., 2011; Li et al., 2012; Li et al.,
2008; Fischer et al., 2017) or filtered output (Naka-
jima et al., 1996; Karlen et al., 2012). Statistical mea-
sures, such as skewness, kurtosis, shannon entropy
and Renyi’s entropy have been shown useful for auto-
matic detection of MNA (Selvaraj et al., 2011; Krish-
nan et al., 2008). Another approach, using Hjorth pa-
rameters was proposed (Gil et al., 2008). Other meth-
ods were published, which perform classification with
a support vector machine (SVM) with time-domain
features (Chong et al., 2014) or time-frequency spec-
trum analysis (Dao et al., 2016) .
To the best of our knowledge, all these methods
are tested and validated for PPG recorded on the ears,
182
Vandecasteele, K., Lázaro, J., Cleeren, E., Claes, K., Paesschen, W., Huffel, S. and Hunyadi, B.
Artifact Detection of Wrist Photoplethysmograph Signals.
DOI: 10.5220/0006594301820189
In Proceedings of the 11th International Joint Conference on Biomedical Engineering Systems and Technologies (BIOSTEC 2018) - Volume 4: BIOSIGNALS, pages 182-189
ISBN: 978-989-758-279-0
Copyright © 2018 by SCITEPRESS – Science and Technology Publications, Lda. All rights reserved

fingers or forehead, but none have been validated on
the wrist. Moreover, these methods are never tested
on 24 hour recordings. In our paper, we propose
an automated computer-based method for the detec-
tion of MNA in PPG signals, recorded with a wrist
watch. The method is validated on 24-hour data
recordings. The classification is performed with a
LS-SVM model using previously published features
(Selvaraj et al., 2011; Gil et al., 2008; Chong et al.,
2014), together with new features. Additional to the
PPG signals, most smart watches also record the ac-
celerometry (ACM). Therefore, it is investigated if
the ACM improves the MNA detection method. A
backwards wrapper feature selection is implemented
to determine which features are the most discrimina-
tive ones. The goal of the paper is to provide a reliable
MNA detection method, validated for wrist PPG sig-
nals, and additionally to evaluate whether the ACM
improves the detection performance.
2 METHODOLOGY
The methodology consists of five parts. Firstly,
the data collection is described. Secondly, the ex-
tracted features from the PPG signal, are summa-
rized. Thirdly, a LS-SVM-based classifier is dis-
cussed. Fourthly, a feature selection method is ex-
plained, which selects the most discriminative fea-
tures. Lastly, the labelling process is explained. With
the use of a reference signal, a label (Clean or MNA)
is given to each PPG segment.
2.1 Data Acquisition
The dataset, used in this experiment, contains record-
ings of 17 epilepsy patients, each with a duration
around 24 hours. The epilepsy patients were recorded
with a wired conventional multi-channel scalp EEG.
Additionally to the standard clinical equipment,
recordings were made with a wearable ECG device:
the 180
o
eMotion Faros (Bittium Biosignals Ltd,
2017), and a wrist-worn PPG device: the E4 Empatica
wristband (Empatica Inc, 2017). The Faros ECG was
used in a single-channel configuration. The Empatica
E4 measures reflective PPG using a green and a red
LED on the wrist. The device returns a single chan-
nel which is obtained by combining the green and the
red channels using Empatica’s proprietary algorithm.
Additional to the 1-channel PPG, the triaxial ACM
is recorded. Considering that the intravenous inser-
tion, used to administer medication in clinical prac-
tice, is routinely placed at the non-dominant wrist, the
patients wore the Empatica watch on the dominant
hand. The sampling rate of the Faros and Empatica
(PPG/ACM) device are respectively 500Hz and 64Hz
(PPG)/32 Hz (ACM).
2.2 Feature Extraction
Features are extracted from both the PPG signal and
ACM signal. Features from literature, which are pre-
viously shown to be useful, are combined with our
own features. First, the PPG signal was preprocessed
by a 5th order bandpass butterworth filter [0.5 - 12
Hz]. The ACM was preprocessed by a 3th order but-
terworth filter [0.2 - 10Hz]. The PPG signal and cor-
responding ACM data are segmented in 7 seconds, be-
cause it was reported to be the optimal segment length
for MNA detection (Chong et al., 2014).
2.2.1 PPG
The following features were extracted from the PPG
segments:
• Standard Deviation of Pulse-to-Pulse Interval
(ST D
HR
), Standard Deviation of Pulse-to-Pulse
Amplitude (ST D
amp
), Standard Deviation of Sys-
tolic and Diastolic Ratio (ST D
SD
) and Mean-
Standard Deviation of Pulse Shape (ST D
WAV
),
which are described in (Chong et al., 2014)
• Kurtosis (K) and Shannon Entropy (SE), which
are described in (Selvaraj et al., 2011)
• Variance (Var) of the signal segment
• The frequency of the first/second/third-largest
peak in the power spectrum (FLP/SLP/TLP),
which are expected to be around 1Hz (the HR fre-
quency)/ 2Hz (the first harmonic)/ 3Hz (the sec-
ond harmonic) for a clean segment
• Spectral Shannon entropy (SSE), which is the
shannon entropy of the power spectrum
• Hjorth parameters: H1 and H2, which represents
respectively the central frequency and half of the
bandwidth (Gil et al., 2008)
In order to calculate the features ST D
HR
and
ST D
amp
, the location and amplitude of the pulse
peaks are needed. The feature ST D
SD
requires the
systolic and diastolic time, which are respectively the
rising time from valley to peak and the falling time
from peak to the next valley. The feature ST D
WAV
re-
quire the alignment of the pulses in a segment, which
is done with the peak location. To calculate the loca-
tion and amplitude of the pulse peaks and pulse val-
leys, an algorithm developed in (L
´
azaro et al., 2014) is
used. This algorithm consists of two phases: a linear
filtering transformation and an adaptive thresholding
Artifact Detection of Wrist Photoplethysmograph Signals
183
operation. The filtering step consists of a linear-phase
FIR low-pass-differentiator filter, which is used to ac-
centuate the abrupt upslopes of the PPG pulses. The
abrupt upslopes correspond to peaks in the filtered
signal, which are detected by an adaptive threshold-
ing operation. Once the peaks in the filtered signal
are found, the maximum and minimum point in the
original PPG signal are found.
2.2.2 ACM
The following features were extracted from each di-
rection and Euclidean norm of the ACM segments:
1. The maximal value of the rectified segment
(max
x
,max
y
,max
z
and max
norm
)
2. The 90th percentile of the rectified segment
(90
x
,90
y
,90
z
and 90
norm
)
3. The Variance of the segment (Var
x
,Var
y
,Var
z
and
Var
norm
)
4. The mean absolute deviation of the segment
(MAD
x
,MAD
y
,MAD
z
and MAD
norm
)
5. The norm of the segment (Norm
x
,Norm
y
,Norm
z
and Norm
norm
)
2.3 LS-SVM based Classification of
MNA
The classification is done with a LS-SVM (Least
Squares Support Vector Machines) classifier (De Bra-
banter et al., 2003) using a linear kernel. The classifier
is trained and tested within a leave-one-patient-out
cross-validation (LOPO-CV) approach. In this way,
no data of the patient itself is used for the training.
To evaluate the classifier, the sensitivity (proportion
of MNA segments that are correctly classified), the
specificity (the proportion of clean segments that are
correctly classified) and the accuracy are calculated.
The classifier is tested with only PPG features, only
ACC features and all the features together.
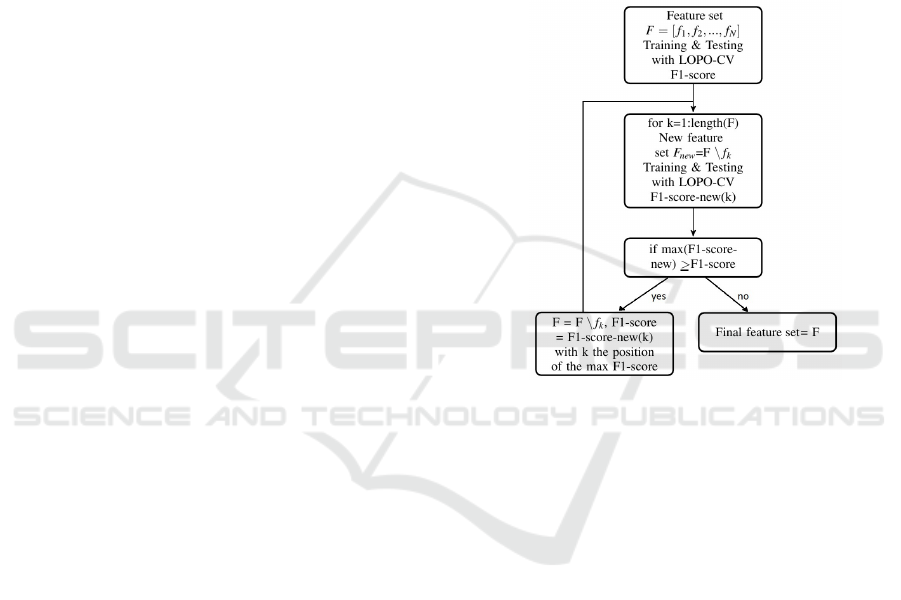
2.4 Feature Selection
In order to investigate which features are discrimina-
tive for clean and MNA PPG segments, a backwards
wrapper feature selection method is implemented. In
Figure 1 a flow diagram of the method is shown. At
the start, the total feature set is used to train and test
the classifier within a LOPO-CV approach. As evalu-
ation criteria, the F1-score is calculated, which is the
harmonic mean of the sensitivity and the specificity.
In a next step, new feature sets are created by leaving
out each feature one time. So, if there are N features,
N new feature sets are created. Again the classifier is
trained and tested with these new feature sets within
a LOPO-CV approach and the F1-scores are calcu-
lated. Next, the maximal F1-score, corresponding to
the best new feature set, is compared with the original
F1-score. If this F1-score is higher or equal, this fea-
ture doesn’t improve the classification problem and is
removed. Whole the procedure is calculated again by
starting with the new feature set, corresponding to the
highest F1-score. With every iteration only 1 feature
can be removed. The method will stop when all the
new F1-scores are lower.
Figure 1: Flowchart: Backwards wrapper feature selection.
The feature selection procedure was performed on
the PPG features, ACM features and all the features
together.
2.5 Reference Signal: ECG
In order to train and test a classifier, labels for each
segment are needed. A visual reference is avoided
because it’s very subjective, i.e. different visual in-
spectors annotate the segments differently. Further-
more, it would be very time consuming to annotate a
whole dataset of 408 hours (17*24 hours). Instead,
we performed an automatic labelling procedure based
on the reference electrocardiography (ECG) signal,
similarly as in (Chong et al., 2014). The heart rate
variability (HRV) is calculated, by finding the loca-
tion of the R-peaks (Varon et al., 2015). For each PPG
segment and corresponding ECG segment, the mean
RR-interval (RR
ECG
) and mean PP-interval (PP
PPG
)
and standard deviation of the RR- and PP-interval
(ST D
ECG
and ST D
PPG
) are calculated. A segment is
classified as MNA, if |RR
ECG
− PP
PPG
| > 150ms or
|ST D
ECG
− ST D
PPG
| > 100ms. These thresholds are
set empirically based on a subset of the data.
BIOSIGNALS 2018 - 11th International Conference on Bio-inspired Systems and Signal Processing
184
3 RESULTS AND DISCUSSION
3.1 Feature Selection
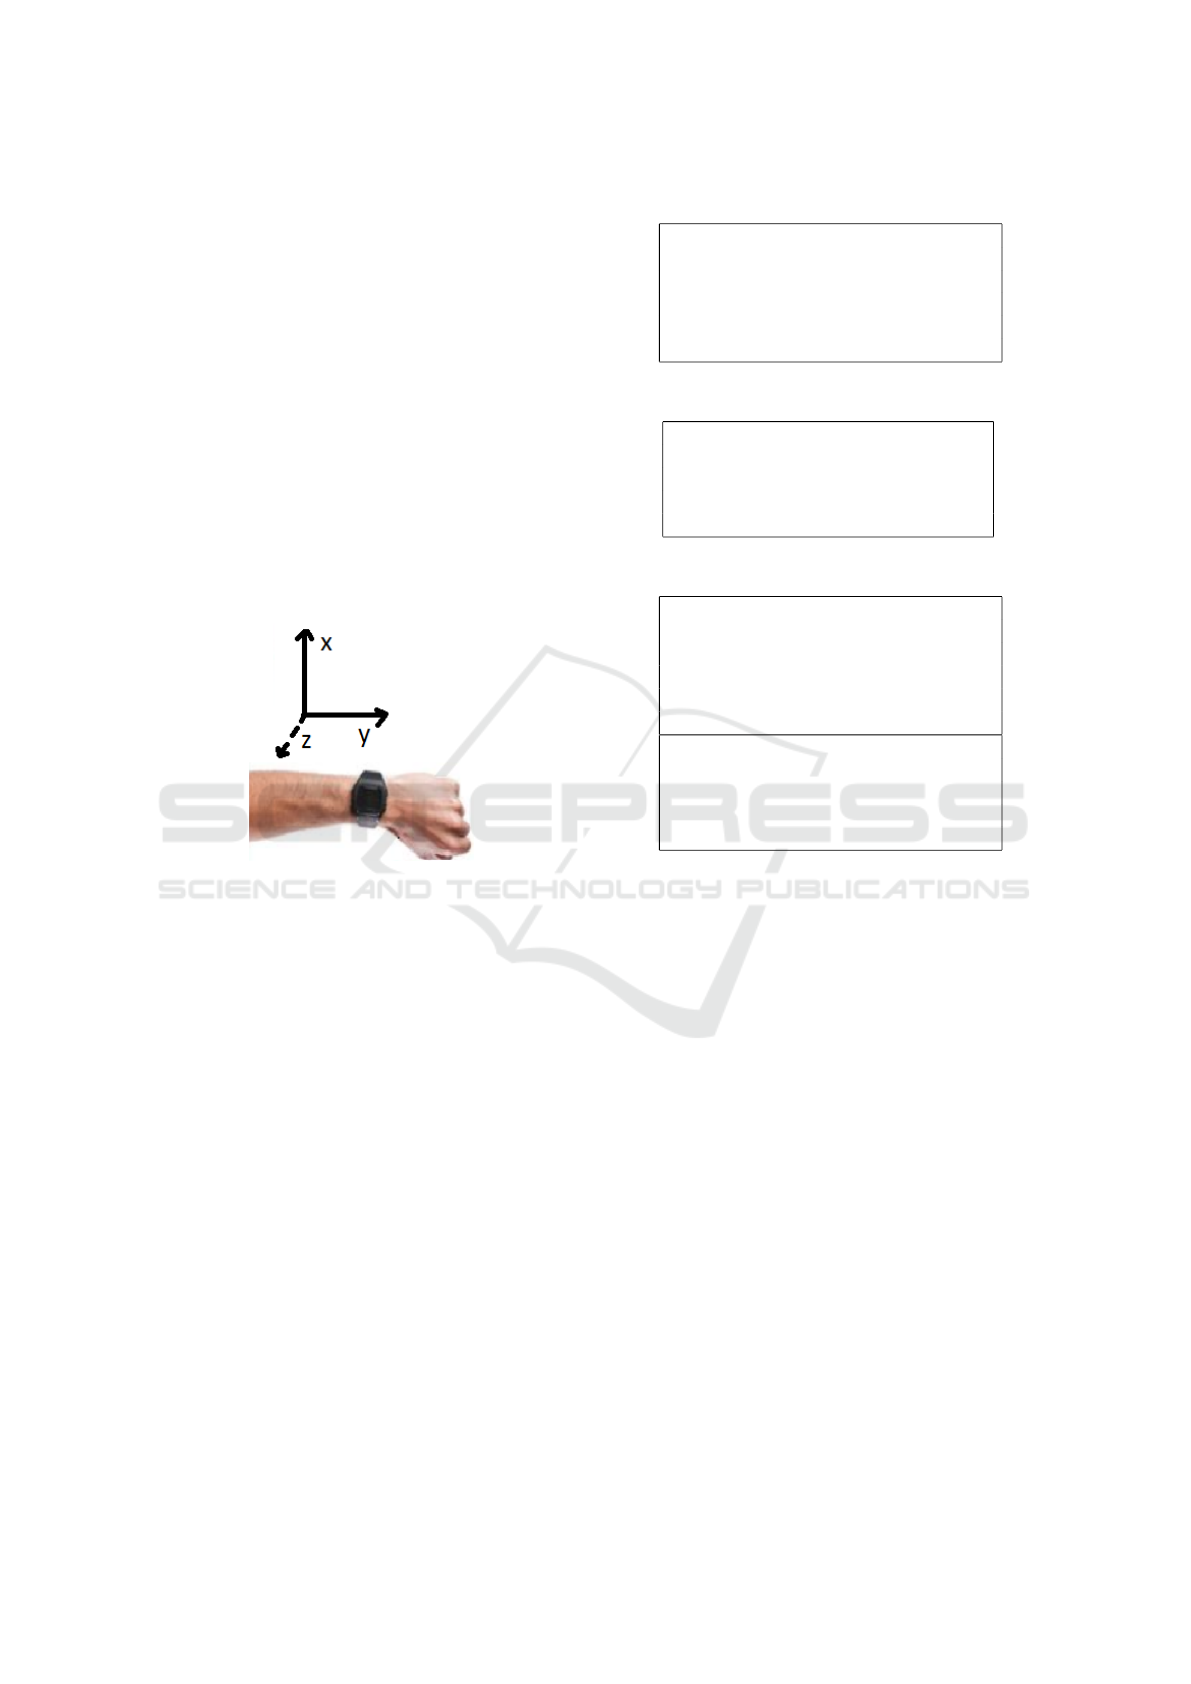
In table 1, 2 and 3 the selected features are shown in
bold, starting from respectively the PPG, ACM and
all the features. From the newly proposed PPG fea-
tures, 3 features are retained by the feature selection:
the variance, the frequency of the second and third
largest peak in the power spectrum. These 3 features
do have an added value for the MNA detection algo-
rithm. The feature selection process with the ACM
features shows that all features which make use of the
y-direction are left out. The y-direction is the direc-
tion along the lower arm, from wrist towards the el-
bow, as shown in Fig. 2. The accelerometry in this di-
rection doesn’t have an added value for the algorithm
for this dataset.
Figure 2: ACM axis.
It might be that motion in the y-direction, which
is along the direction of the lower arm, causes less
MNA than the other directions. Another reason can
be that this direction is less present during daily mo-
tion compared to the other directions. The feature se-
lection process with all the features shows that 4 from
the 13 PPG-derived and 10 from the 20 ACM-derived
features are removed. It seems that the ACM-features
have an added value, but this added value is only mi-
nor. With all the resulting features, a F1-score of
0.8841 is obtained. If 1 of those PPG-derived features
is removed, a F1-score between 0.8474 and 0.8836
is obtained. If one of the ACM-derived features is
removed, a F1-score between 0.8831 and 0.8841 is
obtained. So leaving out a ACM-feature would only
decrease the F1-score slightly.
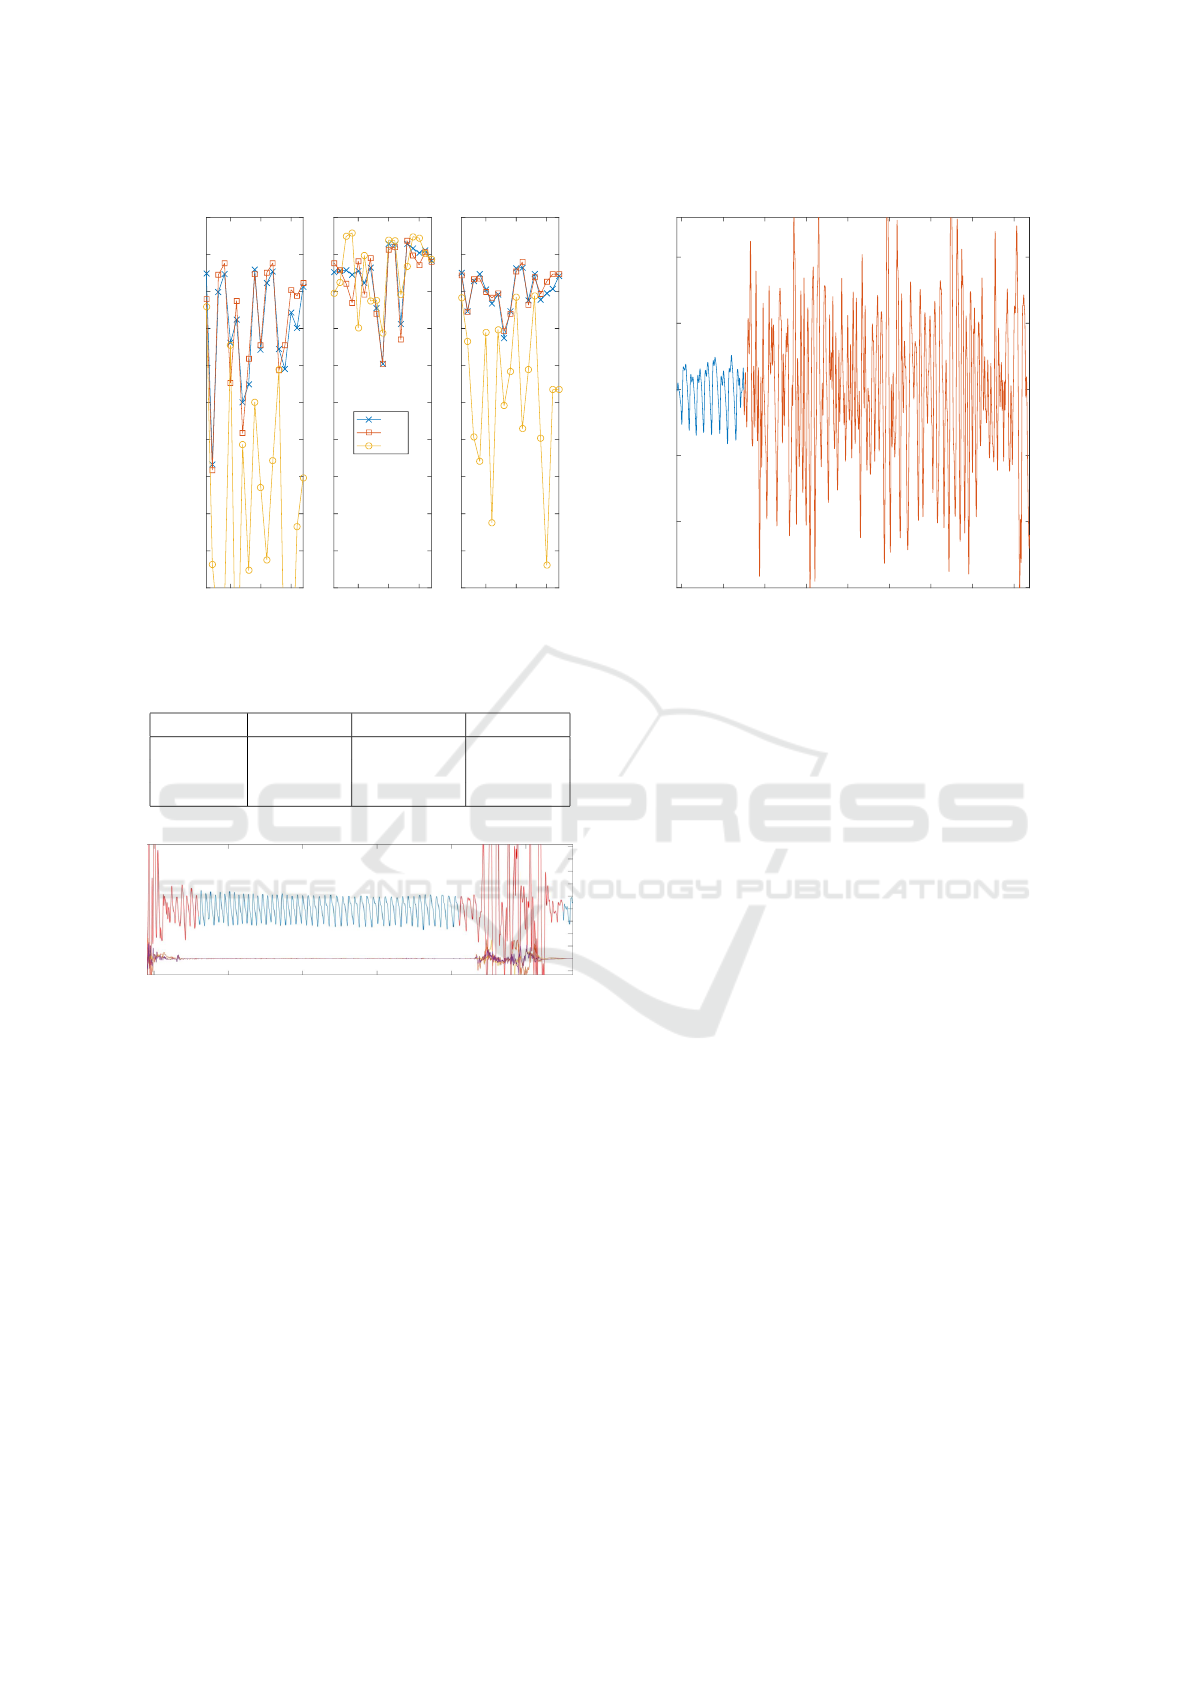
3.2 Classification Performance
In Figure 3 the sensitivities (Sens), specificities
(Spec) and accuracies (Acc) are plotted for all the pa-
tients. The sensitivity (specificity) is the proportion of
MNA (clean) segments that are correctly classified.
Table 1: Feature selection PPG.
STD
HR
, STD
amp
, STD
SD
and STD
WAV
K and SE
Var
FLP, SLP and TLP
SSE
H1 and H2
Table 2: Feature selection ACC.
max
x
, max
y
, max
z
and max
norm
90
x
, 90
y
, 90
z
and 90
norm
Var
x
, Var
y
, Var
z
and Var
norm
MAD
x
, MAD
y
, MAD
z
and MAD
norm
Norm
x
, Norm
y
, Norm
z
and Norm
norm
Table 3: Feature selection ALL.
STD
HR
, STD
amp
, STD
SD
and STD
WAV
K and SE
Var
FLP, SLP and TLP
SSE
H1 and H2
max
x
, max
y
, max
z
and max
norm
90
x
, 90
y
, 90
z
and 90
norm
Var
x
, Var
y
, Var
z
and Var
norm
MAD
x
, MAD
y
, MAD
z
and MAD
norm
Norm
x
, Norm
y
, Norm
z
and Norm
norm
The accuracy is the proportion of segments that are
correctly classified. In Table 4 the average values ±
standard deviations are shown.
The performance with PPG features is similar as
the performance with all features. Adding the ACM
features to the classification does not increase the per-
formance. The reason is that the PPG signal has al-
ready enough information on itself. The MNA seg-
ments show large differences with clean segments,
which is illustrated in Figure 4.
By using only the ACM features, a low sensitivity
is obtained. This is due to the fact that not all kind
of MNA are caused by wrist motion. For example
subtle finger motion, which is shown in Figure 5, or
bad positioning of the sensor cause MNA, but there is
no corresponding ACM activation.
In table 5 previous experiments and results from
literature are summarized. In all the studies reflective
PPG with infrared light is recorded. The dataset and
sensor type are different for each study, which makes
it difficult to compare quantitatively the results.
Artifact Detection of Wrist Photoplethysmograph Signals
185
5 10 15
Patients
50
55
60
65
70
75
80
85
90
95
100
Sensitivity(%)
5 10 15
Patients
50
55
60
65
70
75
80
85
90
95
100
Specificity(%)
5 10 15
Patients
50
55
60
65
70
75
80
85
90
95
100
Accuracy(%)
ALL
PPG
ACM
Figure 3: Classification performance.
Table 4: Classification performance.
PPG ACM ALL
Sens (%) 85.50 ± 8 58.04 ± 18 85.50 ± 7
Spec (%) 91.84 ± 5 93.01 ± 4 92.36 ± 4
Acc (%) 90.33 ± 2 76.23 ± 11 90.23 ± 3
Figure 4: Example: Clean (blue) and MNA (red) PPG seg-
ments with 3 axis ACM.
3.3 Overall Data Quality
In total 44.26% ± 16.20% of the data is labeled
as MNA based on the reference signal, 43.38% ±
15.62% of the data is detected as MNA by the algo-
rithm. This means that close to half of the measured
data are contaminated with MNA, so that the heart
rate variability cannot be reliably estimated by the al-
gorithm (L
´
azaro et al., 2014) from the recorded sig-
nals. Note that our dataset was acquired from patients
in a hospital environment. The patients are contin-
uously monitored with wired EEG, which limit their
mobility. Outside the hospital these percentages are
probably even higher.
5 10 15 20 25 30 35 40 45
time(s)
-150
-100
-50
0
50
100
Figure 5: Example: Clean (blue) and MNA, caused by fin-
ger motion, (red) PPG.
3.4 Limitations and Further Work
The algorithm is tested on a data set, recorded in the
hospital. The algorithm should also be tested on daily
life data, recorded outside the hospital.
Only one type of sensor is tested (wrist reflective
PPG). It should be extended to other sensors. In order
to compare the different studies, the MNA detection
algorithms should be tested on the same data sets.
The MNA detection method, explained in this pa-
per, makes use of a fixed window length of 7s. A
method should be investigated to automatically deter-
mine the length of the MNA.
Other models should be tested for this classifica-
tion problem, for example deep neural networks.
Extracting HR and HRV is more challenging dur-
ing these artifactual segments and further signal pro-
cessing techniques are needed. Further studies must
be elaborated to assess how these MNA affect to the
different HRV indices.
4 CONCLUSIONS
The goal of the paper is to provide a reliable motion
and noise artifact (MNA) detection method for PPG
signals, recorded with a wrist watch. PPG- and ACM-
derived features are extracted and classified with a
LS-SVM classifier. For this dataset, the ACM fea-
tures do not improve the performance, suggesting that
ACM recording could be avoided from the point of
view for detecting MNAs in PPG signals.
BIOSIGNALS 2018 - 11th International Conference on Bio-inspired Systems and Signal Processing
186

Table 5: Comparison with literature [Rec.=Recording, Acc=Accuracy, Se=Sensitivity, Sp=Specificity, Results are in %].
No. subjects (Rec. duration) Sensor type Type of movement Results
Sukor et al., 2011
13 (8 min) Finger Hand movements
Acc: 83 ± 11
Se: 89 ± 10
Sp: 77 ± 19
Selvaraj et al., 2011
10 (5 - 20 min) Ear/ Finger/ Forehead Involuntary movements
Acc: 99.0/94.8/93.3
Se: 100/99.3/96.3
Sp: 98.9/93.8/91.9
14 (10 min) Finger Voluntary movements
Acc: 88.8
Se: 86.9
Sp: 98.3
Chong et al., 2014
11 (10 min) Forehead Head movement
Acc: 94.4 ± 3.3
Se: 94.7 ± 3.4
Sp: 94.7 ± 4.5
9 (10 min) Finger Finger movement
Acc: 93.4 ± 3.5
Se: 88.8 ± 7.9
Sp: 96.7 ± 3.0
9 (45 min) Finger/Forehead Stair-climbing
Acc: 93.7 ± 2.7
Se: 93.9 ± 5.0
Sp: 91.4 ± 2.0
Dao et al., 2016
11 (10 min) Forehead Head movement
Acc: 95.7 ± 0.82
Se: 93.0 ± 5.75
Sp: 96.6 ± 1.48
11 (10 min) Finger Finger movement
Acc: 97.5 ± 1.50
Se: 96.4 ± 2.34
Sp: 98.1 ± 1.43
10 Forehead UMMC hospital
Acc: 95.3 ± 1.34
Se: 90.8 ± 2.83
Sp: 98.7 ± 1.07
10 Finger UMMC hospital
Acc: 94.3 ± 1.64
Se: 88.5 ± 2.23
Sp: 96.9 ± 1.86
ACKNOWLEDGEMENTS
SeizeIT is a project realized in collaboration with
imec. Project partners are KU Leuven, UCB Pharma,
Byteflies and Pilipili, with project support from
VLAIO (Flanders Innovation and Entrepreneurship)
and Innoviris.
Bijzonder Onderzoeksfonds KU Leuven (BOF):
SPARKLE Sensor-based Platform for the Accu-
rate and Remote monitoring of Kinematics Linked
to E-health #: IDO-13-0358; The effect of perina-
tal stress on the later outcome in preterm babies #:
C24/15/036; TARGID - Development of a novel di-
agnostic medical device to assess gastric motility #:
C32-16-00364. Agentschap Innoveren & Onderne-
men (VLAIO): Project #: STW 150466 OSA +, O&O
HBC 2016 0184 eWatch. iMinds Medical Informa-
tion Technologies: Dotatie-Strategisch basis onder-
zoek (SBO- 2016); ICON: HBC.2016.0167 SeizeIT.
European Research Council: The research leading to
these results has received funding from the European
Research Council under the European Union’s Sev-
enth Framework Programme (FP7/2007-2013) / ERC
Advanced Grant: BIOTENSORS (n
o
339804). This
paper reflects only the authors’ views and the Union
is not liable for any use that may be made of the con-
tained information.
Artifact Detection of Wrist Photoplethysmograph Signals
187

REFERENCES
Allen, J. (2007). Photoplethysmography and its applica-
tion in clinical physiological measurement. Physiol.
Meas., 28(3):R1–R39.
Barker, S. and Shah, N. (1997). The effects of motion on the
performance of pulse oximeters in volunteers (revised
publication). Anesthesiology, (86):101–108.
Bittium Biosignals Ltd (2017). eMotion Faros 180.
http://www.megaemg.com/products/faros/. [Online;
accessed 22-August-2017].
Chong, J. W., Dao, D. K., Salehizadeh, S. M., McManus,
D. D., Darling, C. E., Chon, K. H., and Mendelson,
Y. (2014). Photoplethysmograph Signal Reconstruc-
tion Based on a Novel Hybrid Motion Artifact Detec-
tion Reduction Approach. Part I: Motion and Noise
Artifact Detection. Ann. Biomed. Eng., 42(11):2238–
2250.
Dao, D., Salehizadeh, S. M. A., Noj, Y., Chong, J. W.,
Cho, C., Mcmanus, D., Darling, C. E., Mendelson,
Y., and Chon, K. H. (2016). A Robust Motion
Artifact Detection Algorithm for Accurate Detection
of Heart Rates from Photoplethysmographic Signals
using Time-Frequency Spectral Features. IEEE J.
Biomed. Heal. informatics, 21(5):1242–1253.
De Brabanter, K., Karsmakers, P., Ojeda, F., Alzate, C.,
De Brabanter, J., Pelckmans, K., De Moor, B., Van-
dewalle, J., and Suykens, J. a. K. (2003). LS-
SVMlab Toolbox User’s Guide. Pattern Recognit.
Lett., 3(February):179–202.
Empatica Inc (2017). Empatica E4 wristband.
https://www.empatica.com/e4-wristband. [Online;
accessed 22-August-2017].
Fischer, C., Domer, B., Wibmer, T., and Penzel, T. (2017).
An algorithm for real-time pulse waveform segmen-
tation and artifact detection in photoplethysmograms.
IEEE J. Biomed. Heal. Informatics, 21(2):372–381.
Fukushima, H., Kawanaka, H., Bhuiyan, M. S., and Oguri,
K. (2012). Estimating heart rate using wrist-type pho-
toplethysmography and acceleration sensor while run-
ning. In Engineering in Medicine and Biology Soci-
ety (EMBC), 2012 Annual International Conference of
the IEEE, pages 2901–2904. IEEE.
Gil, E., Mar
´
ıa Vergara, J., and Laguna, P. (2008). Detection
of decreases in the amplitude fluctuation of pulse pho-
toplethysmography signal as indication of obstructive
sleep apnea syndrome in children. Biomed. Signal
Process. Control, 3(3):267–277.
Karlen, W., Kobayashi, K., Ansermino, J. M., and Dumont,
G. A. (2012). Photoplethysmogram signal quality
estimation using repeated Gaussian filters and cross-
correlation. Physiol. Meas., 33(10):1617–1629.
Kim, B. S. and Yoo, S. K. (2006). Motion artifact reduction
in photoplethysmography using independent compo-
nent analysis. IEEE Trans. Biomed. Eng., 53(3):566–
568.
Krishnan, R., Natarajan, B., and Warren, S. (2008). Anal-
ysis and detection of motion artifact in photoplethys-
mographic data using higher order statistics. In Acous-
tics, Speech and Signal Processing, 2008. ICASSP
2008. IEEE International Conference on, pages 613–
616. IEEE.
Lai, P. and Kim, I. (2015). Lightweight wrist photoplethys-
mography for heavy exercise: motion robust heart rate
monitoring algorithm. Healthcare Technology Letters,
2(1):6–11.
L
´
azaro, J., Gil, E., Vergara, J. M., and Laguna, P. (2014).
Pulse rate variability analysis for discrimination of
sleep-apnea-related decreases in the amplitude fluctu-
ations of pulse photoplethysmographic signal in chil-
dren. IEEE J. Biomed. Heal. Informatics, 18(1):240–
246.
Lee, B., Han, J., Baek, H. J., Shin, J. H., Park, K. S., and Yi,
W. J. (2010). Improved elimination of motion artifacts
from a photoplethysmographic signal using a kalman
smoother with simultaneous accelerometry. Physiol
Meas, 31(12):1585–603.
Li, K. and Warren, S. (2012). A wireless reflectance pulse
oximeter with digital baseline control for unfiltered
photoplethysmograms. IEEE Trans. Biomed. Circuits
Syst., 6(3):269–278.
Li, K., Warren, S., and Natarajan, B. (2012). Onboard
tagging for real-time quality assessment of photo-
plethysmograms acquired by a wireless reflectance
pulse oximeter. IEEE Trans. Biomed. Circuits Syst.,
6(1):54–63.
Li, Q., Mark, R. G., and Clifford, G. D. (2008). Ro-
bust heart rate estimation from multiple asynchronous
noisy sources. Physiol. Meas., 29(1):15–32.
Nakajima, K., Tamura, T., and Miike, H. (1996). Monitor-
ing of heart and respiratory rates by photoplethysmog-
raphy using a digital filtering technique. Med. Eng.
Phys., 18(5):365–372.
Pan, H., Temel, D., and AlRegib, G. (2016). Heart-
beat: Heart beat estimation through adaptive track-
ing. In Biomedical and Health Informatics (BHI),
2016 IEEE-EMBS International Conference on, pages
587–590. IEEE.
Petterson, M. T., Begnoche, V. L., and Graybeal, J. M.
(2007). The effect of motion on pulse oximetry
and its clinical significance. Anesth. Analg., 105(6
suppl.):S78–84.
Ram, M., Madhav, K. V., Krishna, E. H., Komalla, N. R.,
and Reddy, K. A. (2012). A novel approach for motion
artifact reduction in ppg signals based on as-lms adap-
tive filter. IEEE Trans Intrum Meas, 16:1445–1457.
Selvaraj, N., Mendelson, Y., Shelley, K. H., Silverman,
D. G., and Chon, K. H. (2011). Statistical Approach
for the Detection of Motion / Noise Artifacts in Photo-
plethysmogram. Conf Proc IEEE Eng Med Biol Soc.,
pages 4972–4975.
Sukor, J. A., Redmond, S. J., and Lovell, N. H. (2011).
Signal quality measures for pulse oximetry through
waveform morphology analysis. Physiol. Meas.,
32(3):369–384.
Temko, A. (2017). Accurate heart rate monitoring during
physical exercises using ppg. IEEE Trans Biomed
Eng., 64(9):2016–2024.
Tobin, R. M., Pologe, J. A., and Batchelder, P. B. (2002). A
BIOSIGNALS 2018 - 11th International Conference on Bio-inspired Systems and Signal Processing
188

characterization of motion affecting pulse oximetry in
350 patients. Anesth. Analg., 94(1 suppl):S54–S61.
Torres, J. M. M., Ghosh, A., Stepanov, E. A., and Riccardi,
G. (2016). Heal-t: An efficient ppg-based heart-rate
and ibi estimation method during physical exercise.
24th European Signal Processing Conference (EU-
SIPCO).
Varon, C., Caicedo, A., Testelmans, D., Buyse, B., and
Huffel, S. V. (2015). A Novel Algorithm for the Au-
tomatic Detection of Sleep Apnea From Single-Lead
ECG. 62(9):2269–2278.
Yousefi, R., Nourani, M., Ostadobbas, S., and Panahi, I.
(2012). A motion-tolerant adaptive algorithm for
wearable photoplethysmographic biosensors. IEEE J
Biomed Health, 18(2):670–681.
Artifact Detection of Wrist Photoplethysmograph Signals
189
