Application of Machine Learning for Automatic MRD Assessment in
Paediatric Acute Myeloid Leukaemia
Roxane Licandro
1,2
, Michael Reiter
1
, Markus Diem
1
, Michael Dworzak
3,4
, Angela Schumich
4
and Martin Kampel
1
1
Institute of Computer Aided Automation - Computer Vision Lab, TU Wien, Favoritenstrasse 9-11/183-2, 1040 Vienna,
Austria
2
Department of Biomedical Imaging and Image-guided Therapy - Computational Imaging Research Lab, Medical
University of Vienna, Lazarettgasse 14, 1090 Vienna, Austria
3
Children’s Cancer Research Institute, Medical University of Vienna, Zimmermannplatz 10, 1090 Vienna, Austria
4
Labdia Labordiagnostik GmbH, Zimmermannplatz 8, 1090 Vienna, Austria
Keywords:
Clustering, Machine Learning, Flow Cytometry, Acute Myeloid Childhood Leukaemia, Minimal Residual
Disease.
Abstract:
Acute Myeloid Leukaemia (AML) is a rare type of blood cancer in children. This disease originates from
genetic alterations of hematopoetic progenitor cells, which are involved in the hematopoiesis process, and
leads to the proliferation of undifferentiated (leukaemic) cells. Flow CytoMetry (FCM) measurements enable
the assessment of the Minimal Residual Disease (MRD), a value which clinicians use as powerful predictor
for treatment response and diagnostic tool for planning patients’ individual therapy. In this work we propose
machine learning applications for the automatic MRD assessment in AML. Recent approaches focus on child-
hood Acute Lymphoblastic Leukaemia (ALL), more common in this population. We perform experiments
regarding the performance of state-of-the-art algorithms and provide a novel GMM formulation to estimate
leukaemic cell populations by learning background (non-cancer) populations only. Additionally, combination
of backgrounds of different leukaemia types are evaluated regarding their ability to predict MRD in AML. The
results suggest that background populations and combinations of these are suitable to assess MRD in AML.
1 INTRODUCTION
Acute Myeloid Leukaemia (AML) is the most com-
mon leukaemia type in adults, which incidence in-
creases with age (Juliusson et al., 2009) and accounts
for 20 percent of leukaemias in children (Creutzig
et al., 2013b). The peaks of the AML prevalence in
the United States lie in childhood between the age of
0 and 1 year at 18.4 per million, children ages 5 to 9
years 4.3 per million and at 7.7 per million for ages
between 10 to 14 years (Puumala et al., 2013). Chil-
dren at ages younger than 15 years at the time point
of diagnosis have a five year survival rate of approx-
imately 70 percent, dependent on the AML subtype
(Creutzig et al., 2013b). It affects the blood genera-
tion caused by genetic lesions of myeloid progenitor
cells and leads to a decrease of the number of mature
blood cells and an increase of the number of malig-
nant progenitor cells (Puumala et al., 2013).
1.1 MRD assessment in AML
For determining the clinical outcome and for the strat-
ification according to risk for relapse, clinicians ob-
serve genetic features (Rubnitz and Inaba, 2012) to
retrieve the Minimal Residual Disease (MRD). MRD
is a prognostic value, which is used as an indicator
for treatment response and to quantify the remaining
leukaemic cells (blasts) at defined therapeutic time
points (Br
¨
uggemann et al., 2010). It has been iden-
tified as a powerful predictor for treatment outcome
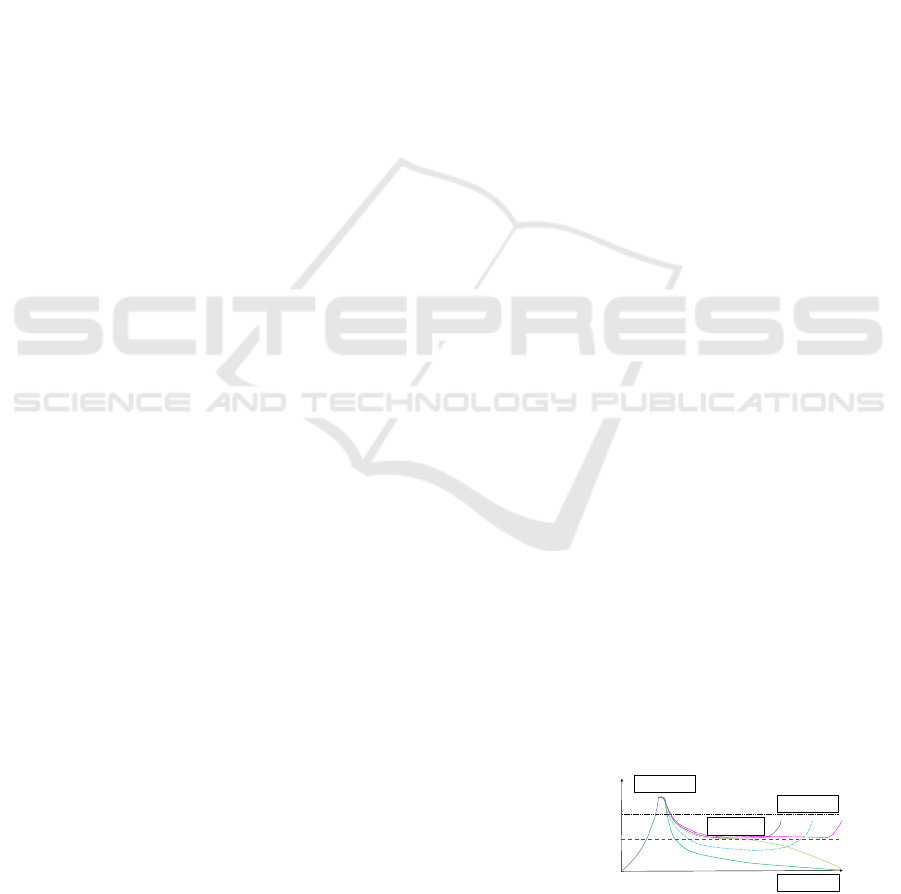
Cancer cells
10
12
10
10
10
6
0
MRD assessment threshold
(1:10
6
bone marrow cells)
Leukaemia
time
Microscopic-Morphologic
Assessment threshold
(1:10
2
bone marrow cells)
Relapse
Cure
Remission
Figure 1: MRD assessment in different therapeutic stadia of
AML.
Licandro, R., Reiter, M., Diem, M., Dworzak, M., Schumich, A. and Kampel, M.
Application of Machine Learning for Automatic MRD Assessment in Paediatric Acute Myeloid Leukaemia.
DOI: 10.5220/0006595804010408
In Proceedings of the 7th International Conference on Pattern Recognition Applications and Methods (ICPRAM 2018), pages 401-408
ISBN: 978-989-758-276-9
Copyright © 2018 by SCITEPRESS – Science and Technology Publications, Lda. All rights reserved
401
and thus is used as guiding diagnostic tool for plan-
ning the intensity of treatment of an individual pa-
tient. It encodes the proportion of leukaemic blasts
among the amount of normal cells observed. Fig-
ure 1 illustrates schematically the relations of MRD
to different leukaemic cell stadia during treatment:
Leukaemia, Remission, Relapse and Cure. The treat-
ment of AML is divided into three phases (L
¨
owenberg
et al., 2003), (Rubnitz and Inaba, 2012), (Creutzig
et al., 2013a):
• Induction therapy (day 1 - 33): Remission induc-
tion targets a Complete Remission (CR). CR is
achieved if less than 5% of blasts are in cellular
marrow, no blast in the circulation, no presence of
extramedullary leukaemia and a regeneration of
platelets and granulocytes, resulting in increased
counts.
• Consolidation (day 33 - 78): The second phase
aims at the removal of MRD after patients have
recovered from the previous phase in a rest period
(L
¨
owenberg et al., 2003).
• Intensification: The third phase focuses on the
treatment after remission, consisting of e.g. pro-
longated chemotherapy (1-2 years) or Stem Cell
Transplantation (SCT). Two types of SCT exist
(L
¨
owenberg et al., 2003). In case of AML, autol-
ogous SCT is rarely recommended, but allogeneic
Hematopoietic SCT (HSCT) is a reasonable op-
tion, for resistant or high risk cases in first remis-
sion. However, HSCT is strongly recommended
for most children with AML after relapse (Rub-
nitz and Inaba, 2012).
One cause of morbidity and mortality in AML be-
side the disease itself are complications induced by
infections, haemorrhage or side effects caused by the
highly haematotoxic and immunosuppressive therapy
(Creutzig et al., 2013b). Thus, additionally prophy-
lactic therapies are considered to reduce the incidence
of bacterial or fungal infection as well as support-
ive therapy (Rubnitz and Inaba, 2012). Treatment is
guided by treatment protocols, evaluated by perform-
ing international clinical trials over several years, to
ensure quality and safety (Creutzig et al., 2013a).
1.2 Flow Cytometry
Flow CytoMetry (FCM) enables a reliable MRD as-
sessment, in a more cost- and time effective way than
polymerase chain reaction (Gaipa et al., 2012) by de-
tecting leukaemia specific immunophenotypes (Basso
et al., 2009; Dworzak et al., 2002).
For this technique it is required to draw a blood
or bone marrow sample of a patient in a first step
and subsequently, mark cellular antigens in a stain-
ing step with a combination of specific fluorescence-
labelled antibodies. Dependent on the antigen expres-
sion of a single cell, different fluorescence signal pat-
terns are detectable using FCM. Its biophysical tech-
nology is based on lasers of different wavelenghts,
which employment enables the measurement of phys-
ical (granularity, size) and biological characteristics
of every single cell in a fluid stream and establishes
the difference between normal blood, bone marrow
or leukaemic cells (Rota et al., 2016). The challenges
assessing MRD using FCM lie especially in the late
phases of induction and consolidation therapy, where
it is particularly important to detect small leukaemic
cell populations, which compose about 0.1% of all
observed cells, to be able to adapt therapy if a risk
of relapse is determined. Additional challenges in
FCM lie in the limited number of cells in the test tube
and in the influencing factors for MRD assessment,
as treatment- or age-related variances of the regener-
ation status of bone marrow precursors (Gaipa et al.,
2012).
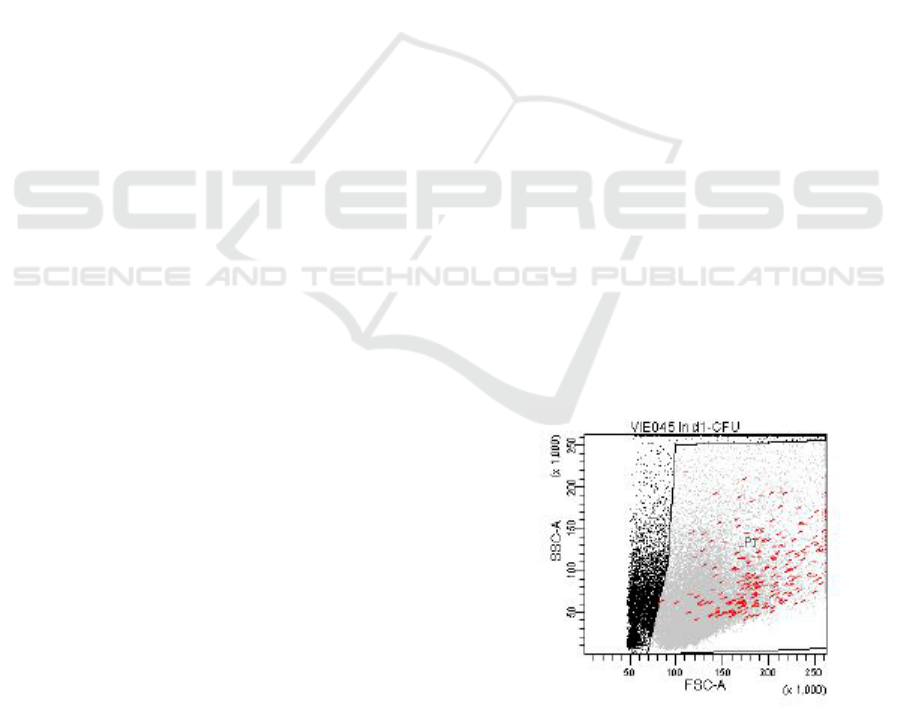
1.2.1 Manual Gating
Current FCM based MRD assessment is performed
manually, where operators draw polygons (gates)
around relevant cell populations in two-dimensional
graphical representations (dot plots) (cf. Figure 2) of
multi-dimensional FCM data. The scale of each gate’s
axis is of logarithmic scale and one dimension corre-
sponds to a FCM measured feature. In Figure 2 every
dot (event) represents a measured blood cell. In di-
agnostic laboratories a hierarchical gating procedure
is manually executed to detect MRD. The identified
events of interest of a gating step serve as input of the
Figure 2: Illustration of a sample obtained by a flow cy-
tometer and the manual drawn viable gate (polygon) com-
posed by the features Side SCatter (SSC-A) and Forward
SCatter (FSC-A). Leukaemic cells are illustrated in red, vi-
able cells in gray, and non viable in black.
ICPRAM 2018 - 7th International Conference on Pattern Recognition Applications and Methods
402

subsequent gate in the hierarchy. In a first step the
gate is defined to identify nucleated cells in a sample
(all cells of a patient’s FCM measurement). For this
gate the granularity measure Side SCatter-Area (SSC-
A) and the size measure Front SCatter-Width (FSC-
W) are observed. By observing the Side SCatter-Area
(SSC-A) and the CD 45 feature (fluorescence marker)
the relevant cells (leukocytes) are filtered. The next
step (CD34+ or progenitor gate) excludes cells that
are more mature and thus, CD 34 negative. For de-
tecting leukaemic cells subsequently, CD 117 posi-
tive and CD 33 positive cells are observed to define a
blast gate. The manual gating procedure introduced
strongly relies on the operator’s skills and expertise,
is highly subjective and time-consuming.
1.3 Contribution
Recent automated machine learning approaches ap-
plied on childhood leukaemia datasets focus on
modelling leukaemic and non-leukaemic cells for
Acute Lymphoblastic Leukaemia (ALL) (Licandro
et al., 2016), (Naim et al., 2014), (Zare et al.,
2010),(Aghaeepour et al., 2013), (Bashashati and
Brinkman, 2009), (Reiter et al., 2016) and have as
main goal the automatic assignment of a biologi-
cally meaningful population label to every observed
cell. Instead of using a 2D feature representation,
the multidimensional space is included at once in
the automatic gating procedure. In contrast to AML,
ALL is caused by genetic lesions of lymphoid blood-
progenitor cells differentiating to T-cells (T-ALL) or
B-cells (B-ALL), which consequently leads to the
proliferation of abernant (leukaemic) cells. The peaks
of ALL prevalence are higher compared to AML and
lie between the age of 2 and 5 years for B-ALL and
at the age of 10 years for T-ALL’s (Pui et al., 2008),
(Inaba et al., 2013).
The contribution of the work proposed is three
fold: First we want to demonstrate the applicability
of state of the art machine learning algorithms on flow
cytometry childhood AML data. Second we propose
a novel background formulation for Gaussian Mix-
ture Model based classification to assess MRD dis-
tributions in AML of small size. Finally, we com-
bine background (non-cancer cells) of ALL and AML
samples and evaluate if background outlier distribu-
tions can identify leukaemic cells more efficiently
compared to simple backgrounds.
We hypothesize that blasts form outlier popula-
tions when background populations are observed in
the multi-dimensional feature space and that a com-
bination of background cells of different leukaemia
types can be used to enable the enhancement of non
blast representations and robust modelling of back-
ground distributions for blast identification.
This paper gives an overview of methodologies
and the dataset used in Section 2. The evaluation re-
sults are presented in Section 3 and the conclusion of
this work and possibilities for future work are sum-
marized in Section 4.
2 METHODOLOGY
This section introduces the formulation of Back-
ground Gaussian Mixture Model classification for
leukaemic cell detection and summarizes the experi-
mental setup of the additional machine learning ap-
proaches (Random Forest and Support Vector Ma-
chine) applied for automatic cell classification. For
every approach the MRD assessment performance is
evaluated by computing the ratio between predicted
leukaemic cells N
blasts
and normal cells N
normal−cells
as expressed in Equation 1.
MRD =
N
blasts
N
normal−cells
(1)
Thus, for every approach the solving of a binary clas-
sification problem (blast, non-blast) for every mea-
sured cell in a sample and the estimation of cell counts
for a class, are required to assess the MRD. In contrast
to manual gating, the machine learning techniques
evaluated within this work, observe the multidimen-
sional feature space. The 13 features measured in
our case correspond to the expression of ten differ-
ent types of antibodies on the cell surface and three
physical FCM measures (cf. Section 3.1 for details
regarding the datasets used). Dependent on the con-
dition of the patient, approximately 10
5
− 10
6
cells
are measured per subject. Additionally, manual an-
notations of blast and non blast cells are provided by
medical experts.
2.1 Background Gaussian Mixture
Model
As the first approach a Gaussian Mixture Model
(GMM) based formulation is used to cluster and au-
tomatically classify cells into leukaemic and normal
cells. GMMs are widely used, and known to be flexi-
ble in the analysis of FCM data and are less computa-
tional demanding compared to kernel model estima-
tion based approaches (Naim et al., 2014), (Bishop,
2006). This generative approach is able to fit point
cloud distributions, while keeping the model based
description and using a restricted amount of param-
eters. We decided to model the distribution of non-
blast populations ( background) only, since more
Application of Machine Learning for Automatic MRD Assessment in Paediatric Acute Myeloid Leukaemia
403
background data without blasts are available. In an
initial step a GMM model for non-blasts is learned
by using an adapted Expectation Maximization (EM)
algorithm and 2 Gaussian distributions. The trained
GMM is used to detect and furthermore analyse cells
lying outside the learned probability density function.
A cell is classified as non-blast if the log probabil-
ity is greater than 0 and as outlier if it is smaller. In a
subsequent step the outliers are modelled using an ad-
ditional GMM with 1 component. A cell in the outlier
population is classified as blast if the log probability
is greater than 3 and as non-blast if it is smaller. The
number of Gaussian distributions and the log proba-
bility were estimated based on the results of prelim-
inary experiments, where different parametrisations
were tested.
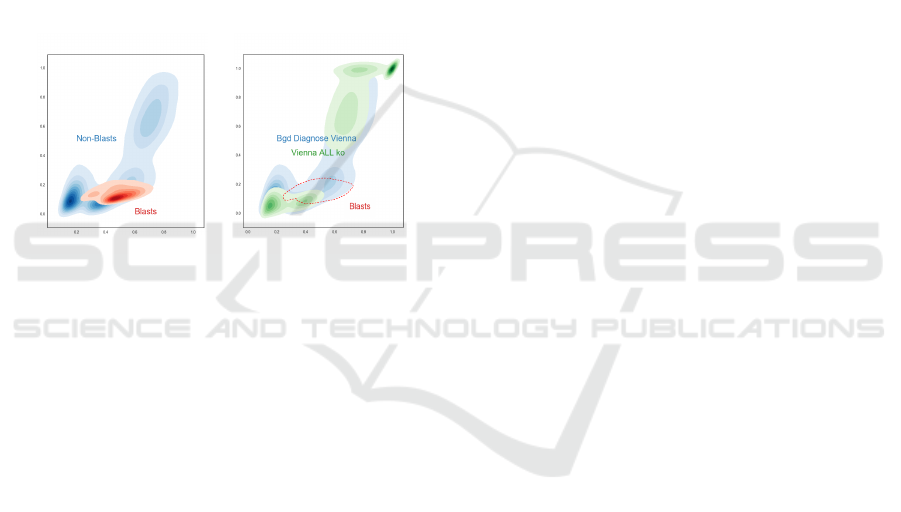
SSC
FSC
Distribution of Blast and
Non Blast Cells
Distribution of the Background
(Bgd) of Dataset ALL k0 (green)
and AML Diagnose (blue)
SSC
FSC
Figure 3: Visualisation of the distribution of non blast and
blast blood cells population of the dataset Diagnose (left).
On the right the difference between the background of the
dataset Diagnose (blue) and ALL k0 (green) are visualised
and their relations to the blast population (red line) in the
dataset Diagnose.
.
In Figure 3 on the left side the distribution of back-
ground cells (blue) of 13 samples of diagnosed AML
cases are visualised, where blasts are visualised in
red. On the right the same background (blue) is shown
in relation to the background (green) extracted from
30 subjects diagnosed with ALL in the remission state
where no blasts are present. First it is observable that
the different background distributions have an overly-
ing appearance in the feature space and second blast
populations lie in regions of less density of the back-
ground’s distribution.
2.2 Random Forest Classifier
As the second approach we evaluated the ensemble
classifier Random Forest (RF) (Breiman, 2001). Its
formulation is based on decision trees, where a ran-
dom training subset of the FCM data is defined for
each tree. For finding a maximum separation between
leukaemic and non leukaemic cells, every node in the
decision tree performs thresholding on the measured
features. By searching over a random subset of anti-
body features a new node in the decision tree is con-
structed (Langs et al., 2011) taking into account the
decisions of the higher tree levels. In comparison to
the GMM approach the RF is trained in a supervised
way using the manual annotation labels of every cell.
In the test phase one label for every cell of a new in-
put sample (1 blast, 0 non-blast) is computed based on
the RF trained. Details regarding the parametrisation
of the RF classifier are given in Section 3.2.
2.3 Support Vector Machine
The Support Vector Machine (SVM) approach is used
as a baseline to provide a comparison between its
classification and those performed by RF and GMM.
In the experiment proposed we use a RBF kernel
based formulation of SVM. Sample classification is
performed based on events, without including infor-
mation about the neighboured events or the different
populations observed. Also the SVM is trained in a
supervised way. In the test phase one label for ev-
ery cell of a new input sample (1 blast, 0 non-blast)
is computed based on the SVM trained. Details re-
garding the parametrisation of the SVM classifier are
given in Section 3.2.
3 RESULTS
In this section first the dataset and the preprocessing
steps are introduced and second a description of the
evaluation setup and results are presented.
3.1 Acute Leukaemia Datasets
The sample preparation and manual MRD assessment
are performed at the national diagnostic reference
center for paediatric AML according to the current in-
ternational standard operating procedure for 10 color
FCM-MRD detection. For each cell, thirteen param-
eters are obtained by the FCM measurement, consist-
ing of three optical (FSC-A, FSC-W, SSC-A) and ten
fluorescence based parameters which are tuned ac-
cording to the leukaemia type. One feature repre-
sents a dimension in the multidimensional data space.
Due to the partial overlapping of fluorescence spectra
of different fluorochromes used, spillover compensa-
tion is applied to obtain statistical independence of the
data by using a correction matrix. As last preprocess-
ing step normalization of the parameter values is per-
formed to obtain a range between 0 and 1. The dataset
used in this work was generated in collaboration with
experienced clinicians from the Children’s Cancer Re-
ICPRAM 2018 - 7th International Conference on Pattern Recognition Applications and Methods
404
search Institute in Vienna. All participants’ guardians
(parents) and patients were informed about the aim
of the study and gave their written, informed consent
prior to inclusion.
3.1.1 Dataset AML Diagnose
The dataset consists of FCM measurements of 13
AML patients whose therapy was guided according
to the AML BFM 2004 treatment protocol (Creutzig
et al., 2013b)
1
. The fluorescence based parameters
used are CD15, CD7CD19, CD34, CD117, CD33,
CD13, CD11b, CD14, HLA-DR, CD45.
3.1.2 Dataset ALLk0 Background
The dataset contains 24 FCM measurements of 30
ALL patients in the remission phase using the same
fluorescence based parameters as the AML Diagnose
dataset, where no blasts are present. The therapy was
guided according to the AIEOP-BFM 2009 trial
2
.
3.2 Evaluation Setup
According to the small amount of available anno-
tated data we perform Leave One Out Cross Vali-
dation for every approach evaluated. The proposed
GMM approach is trained using the background an-
notated cells only, while RF and SVM are trained on
blast and non blast populations. The pipeline is im-
plemented using the scikit-learn package for Python
(Pedregosa et al., 2011). The SVM uses the following
parametrisation: C=1.0, cachesize=200, degree=3,
gamma=’auto’, kernel=’rbf’, tol=0.001. For the Ran-
dom Forest classifier 1000 estimators and follow-
ing additional parameters are used: criterion=’gini’,
minimal samples split=2, min samples leaf=1, min
weight fraction leaf=0.0, min impurity split=1e-07,
bootstrap=True. For the GMM approach we use 2
Gaussian components for modelling non blasts and
one component to model outliers (cf. Section for de-
tails 2.1), covariance type=’full’, n iter=10000 and n
init=1. The parametrisation of every approach was
defined based on the best performance achieved in
1
AML BFM 2004 is a conducted randomized clinical trial
for children and adolescents with AML between age 0-18
years with 722 patients https://www.kinderkrebsinfo.de/
health professionals/clinical trials/
closed trials/aml bfm 2004/index eng.html [accessed
2017-10-29]
2
AIEOP-BFM 2009 is a conducted randomized clinical
trial for ALL between age 1-18 years in 10 countries
in- and outside Europe, with approximately 1000 pa-
tients observed per year (Dworzak, 2013)) http:/www.bfm-
international.org/ [accessed 2017-10-29]
preliminary experiments. Additionally, precision, re-
call and f-score are computed as quantitative score to
compare approaches and labeling results of different
datasets (Powers, 2011).
3.3 MRD Assessment of Paediatric
Acute Myeloid Leukaemia
In a first step we analyse the performance of state-of-
the-art algorithms regarding their classification accu-
racy of blast populations of childhood AML Diagnose
data. Only the background of Diagnose cases in this
dataset is used for training. Table 1 summarizes the
evaluation results in the first three rows (RF, SVM
and GMM). SVM shows the best performance. In
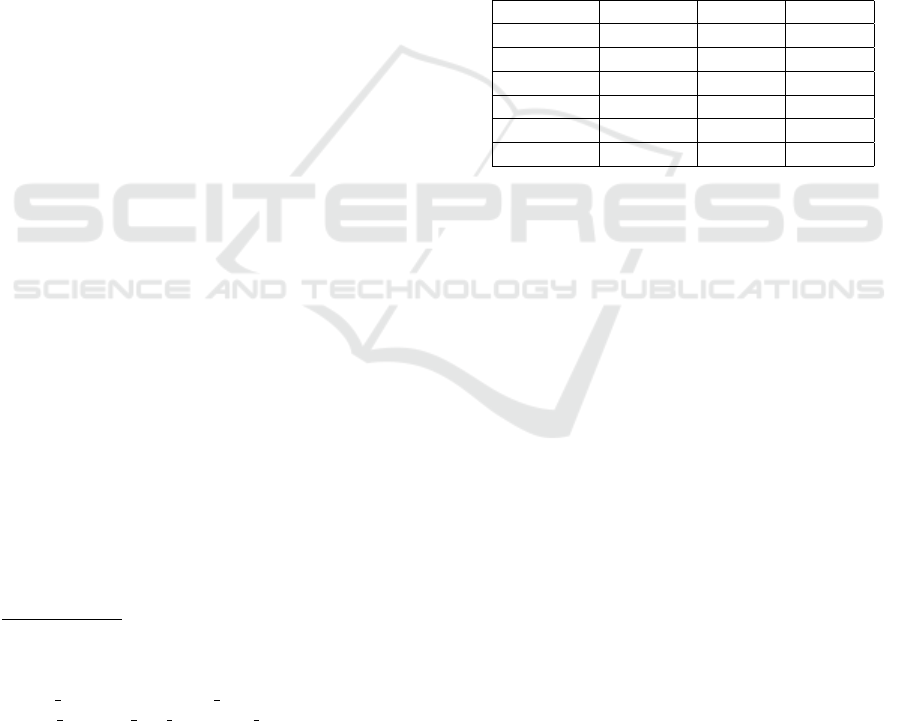
Table 1: MRD assessment performance of childhood AML.
Method Precision Recall f-score
RF 0.76219 0.46249 0.57567
SVM 0.61986 0.58044 0.59951
GMM 0.44836 0.26391 0.33226
RFBgd 0.74169 0.39596 0.51629
SVMBgd 0.68014 0.53149 0.59669
GMMBgd 0.43861 0.26099 0.32725
a second step we analyse the performance of state-of-
the-art algorithms regarding their classification accu-
racy of blast populations of childhood AML Diagnose
data, but with a combined background. Therefore non
blast cells from the dataset ALLk0 and AML Diag-
nose are merged and used for training. Table 1 sum-
marizes the evaluation results in row 4 to 6 (RFBgd,
SVMBgd and GMMBgd). In comparison to the sim-
ple background evaluation a decrease of performance
of RF and GMM is observable and an increase of the
SVM precision, when using the combination of back-
grounds. In Figure 4 the MRD assessment accuracy
of the evaluated algorithms for simple and combined
background are visualised. A point corresponds to a
sample for which the true and predicted MRD is plot-
ted. Samples lying outside the accuracy threshold are
drawn red, samples inside are visualised blue. The
accuracy threshold was defined by clinicians. In case
of GMM the failed predictions of MRD lies closer to
the true MRD compared to RF and SVM failed cases,
which underestimated the MRD in a wider range. In
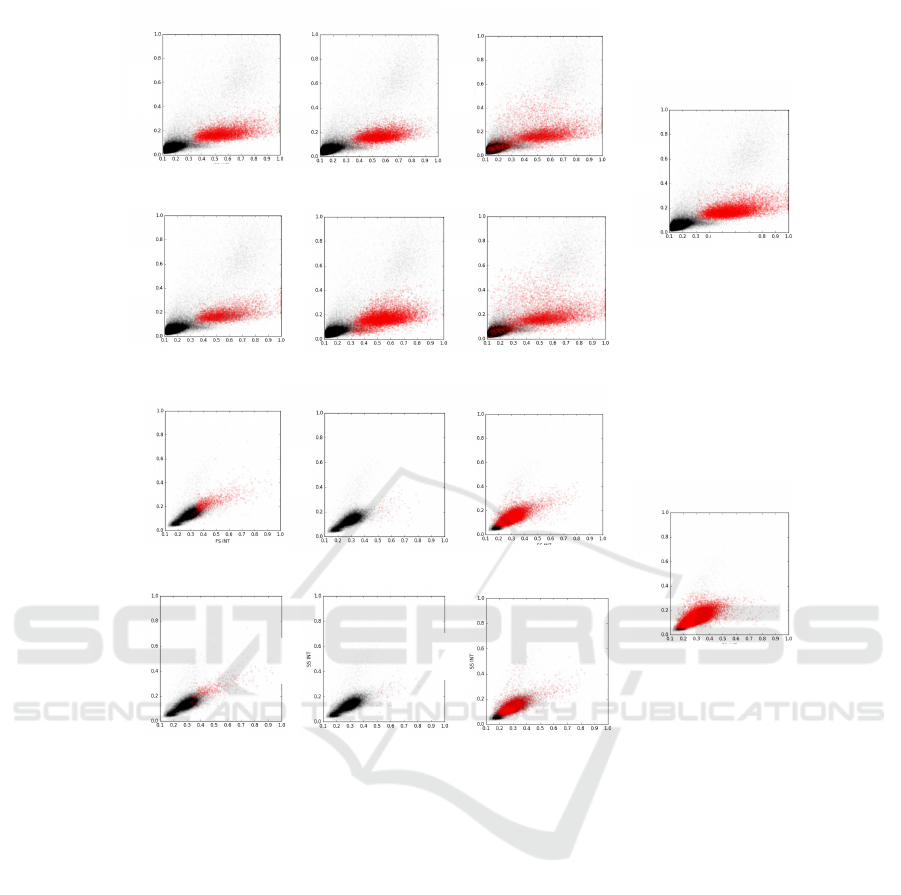
Figure 5 the classification results of the simple back-
ground (1st and 3rd row) and combined background
(2nd and 4th row) analysis are qualitatively visualised
for RF (1st column), SVM (2nd column) and GMM
(3rd column) for two subjects. The corresponding
manual annotations are shown in column 4. Addition-
ally, the computed MRD values for every experiment
are provided.
Application of Machine Learning for Automatic MRD Assessment in Paediatric Acute Myeloid Leukaemia
405
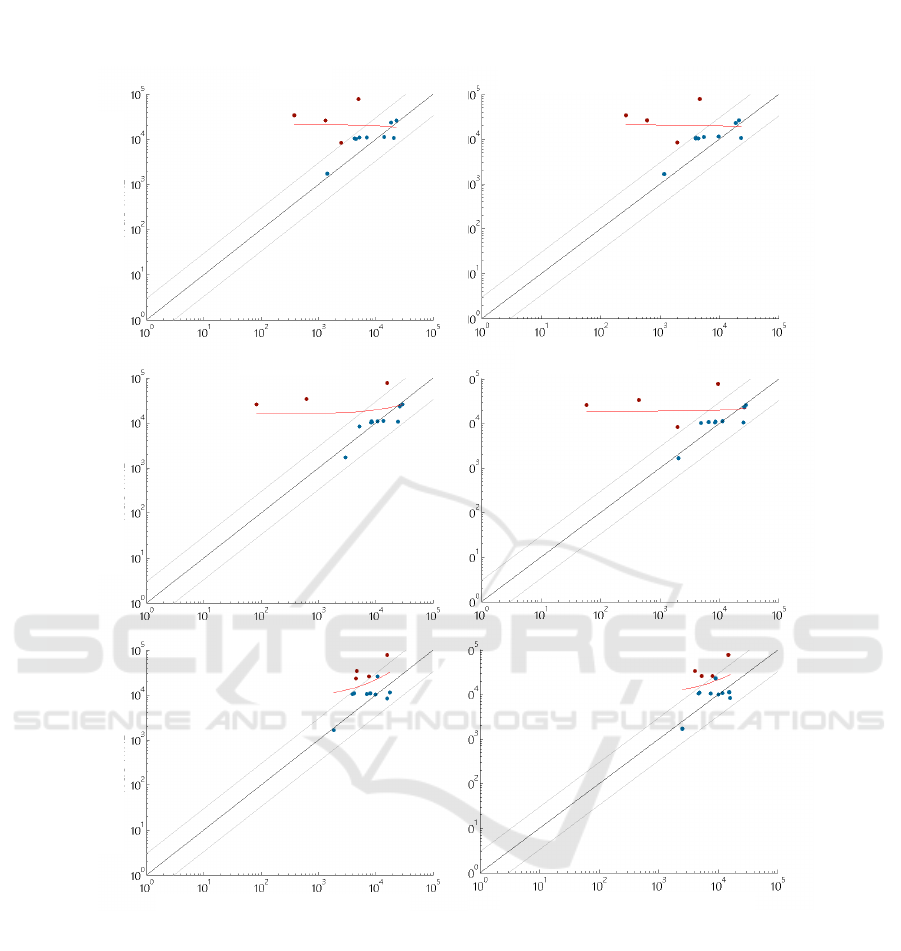
Combined Background
Simple Background
RF
RF Bgd
SVM
SVM Bgd
GMM
GMM Bgd
True MRD
True MRD
True MRD
Predicted MRD
Predicted MRD
Figure 4: Visualisation of MRD assessment in AML using RF, SVM and Background GMM with simple background training
(first column) and combined background training (second column).
4 CONCLUSIONS
In this work we demonstrate the applicability of ma-
chine learning to automatically assess MRD in child-
hood acute myeloid leukaemia. We evaluated three
different approaches for AML routine data, where
best results were achieved using Random Forests and
Support Vector Machines. However these approaches
show a higher variance in MRD estimations compared
to GMM which underestimates MRD in a lower range.
We provided a background formulation for GMM and
showed that learned distributions of non cancer blood
cells can be used to identify blast populations in AML
data. Additionally, we showed that combinations of
backgrounds of different leukaemia types lead to sim-
ilar performance of the supervised and unsupervised
approaches evaluated in detecting blasts in AML data.
We demonstrated that MRD can be estimated on basis
of non-blast observations only, which is a huge ben-
efit in the case of rare diseases, where only a limited
ICPRAM 2018 - 7th International Conference on Pattern Recognition Applications and Methods
406
SVM Bgd: 0.001853
True: 0.1082
Subject 34
Subject
70
SVM: 0.002607 GMM: 0.331501
True: 0.825314
RF Bgd: 0.019095
RF: 0.0421796
GMM Bgd: 0.16473
SVM: 0.109
GMM: 0.07858
RF: 0.06935
RF Bgd: 0.04029
SVM Bgd: 0.06649 GMM Bgd: 0.11787
SSC
FSC
FSC
FSC
SSC
SSC
SSC
SSC
FSC
FSC
FSC
SSC
SSC
FSC
SSC
FSC
FSC
FSC
FSC
FSC
FSC
FSC
SSC
SSC
SSC
SSC
SSC
SSC
Figure 5: Visualisation of qualitative results and quantitative MRD estimation of two subjects by Random Forest (RF), Support
Vector Machine (SVM) and Gaussian Mixture Model (GMM) using a simple and combined Background (Bgd) trainingset.
The annotation results (True) are shown in column 4. Blasts are visualised in red and non-blasts in black.
number of data is available. The limit of our work lies
in the small dataset available according to the rareness
of the disease, thus for future work we aim to use data
from different countries, machines and background
samples.
ACKNOWLEDGEMENTS
This work was co-funded by the European Commi-
sion FP7-PEOPLE-2013-IAPP 610872 and by ZIT
Life Sciences 2014 (1207843).
REFERENCES
Aghaeepour, N., Finak, G., Hoos, H., Mosmann, T.,
Brinkman, R., Gottardo, R., Scheuermann, R., Con-
sortium, F., Consortium, D., et al. (2013). Critical as-
sessment of automated flow cytometry data analysis
techniques. Nature methods, 10(3):228–238.
Bashashati, A. and Brinkman, R. (2009). A survey of flow
cytometry data analysis methods. Advances in bioin-
formatics, 2009:584603–584603.
Basso, G., Veltroni, M., Valsecchi, M., Dworzak, M., Ratei,
R., Silvestri, D., Benetello, A., Buldini, B., Maglia,
O., Masera, G., et al. (2009). Risk of relapse of child-
hood acute lymphoblastic leukemia is predicted by
flow cytometric measurement of residual disease on
day 15 bone marrow. Journal of Clinical Oncology,
27(31):5168–5174.
Bishop, C. M. (2006). Pattern recognition and machine
learning. Springer.
Breiman, L. (2001). Random Forests. Machine Learning,
45(1):5–32.
Br
¨
uggemann, M., Schrauder, A., Raff, T., Pfeifer, H.,
Dworzak, M., Ottmann, O., Asnafi, V., Baruchel, A.,
Bassan, R., Benoit, Y., Biondi, A., Cav
´
e, H., Dom-
Application of Machine Learning for Automatic MRD Assessment in Paediatric Acute Myeloid Leukaemia
407

bret, H., Fielding, A., Fo
`
a, R., G
¨
okbuget, N., Gold-
stone, A., Goulden, N., Henze, G., Hoelzer, D., Janka-
Schaub, G., Macintyre, E., Pieters, R., Rambaldi, A.,
Ribera, J.-M., Schmiegelow, K., Spinelli, O., Stary,
J., von Stackelberg, A., Kneba, M., Schrappe, M., and
van Dongen, J. (2010). Standardized MRD quantifica-
tion in European ALL trials: proceedings of the Sec-
ond International Symposium on MRD assessment in
Kiel, Germany, 18-20 September 2008. Leukemia :
official journal of the Leukemia Society of America,
Leukemia Research Fund, U.K, 24(3):521–535.
Creutzig, U., Zimmermann, M., Bourquin, J.-p., Dworzak,
M. N., Fleischhack, G., Graf, N., Klingebiel, T., Kre-
mens, B., Lehrnbecher, T., Neuhoff, C. V., Sander,
A., Stackelberg, A. V., Star, J., and Reinhardt, D.
(2013a). Randomized trial comparing liposomal
daunorubicin with idarubicin as induction for pedi-
atric acute myeloid leukemia : results from study.
Blood, 122(1):37–44.
Creutzig, U., Zimmermann, M., Dworzak, M. N., Ritter,
J., Schellong, G., and Reinhardt, D. (2013b). Devel-
opment of a curative treatment within the AML-BFM
studies. Klinische Padiatrie, 225(SUPPL1):79–86.
Dworzak, M. (2013). Minimal residual disease in pedi-
atric acute lymphoblastic leukemia: Bfm experience.
Hematolog
´
ıa, 17.
Dworzak, M., Fr
¨
oschl, G., Printz, D., Mann, G., P
¨
otschger,
U., M
¨
uhlegger, N., Fritsch, G., and Gadner, H.
(2002). Prognostic significance and modalities of
flow cytometric minimal residual disease detection
in childhood acute lymphoblastic leukemia. Blood,
99(6):1952–1958.
Gaipa, G., Cazzaniga, G., Valsecchi, M., Panzer-Gr
¨
umayer,
R., Buldini, B., Silvestri, D., Karawajew, L., Maglia,
O., Ratei, R., Benetello, A., Sala, S., Schumich, A.,
Schrauder, A., Villa, T., Veltroni, M., Ludwig, W.-
D., Conter, V., Schrappe, M., Biondi, A., Dworzak,
M., and Basso, G. (2012). Time point-dependent
concordance of flow cytometry and real-time quan-
titative polymerase chain reaction for minimal resid-
ual disease detection in childhood acute lymphoblas-
tic leukemia. Haematologica, 97(10):1582–93.
Inaba, H., Greaves, M., and Mullighan, C. (2013). Acute
lymphoblastic leukaemia. Lancet (London, England),
381(9881):1943–55.
Juliusson, G., Antunovic, P., Derolf, A., Lehmann, S.,
M
¨
ollg
˚
ard, L., Stockelberg, D., Tidefelt, U., Wahlin,
A., and H
¨
oglund, M. (2009). Age and acute myeloid
leukemia: real world data on decision to treat and out-
comes from the Swedish Acute Leukemia Registry.
Blood, 113(18):4179–87.
Langs, G., Menze, B. H., Lashkari, D., and Golland,
P. (2011). Detecting stable distributed patterns of
brain activation using gini contrast. Neuroimage,
56(2):497–507.
Licandro, R., Rota, P., Reiter, M., and Kampel, M. (2016).
Flow Cytometry based automatic MRD assessment in
Acute Lymphoblastic Leukaemia: Longitudinal eval-
uation of time-specific cell population models. In
2016 14th International Workshop on Content-Based
Multimedia Indexing (CBMI), pages 1–6. IEEE.
L
¨
owenberg, B., Griffin, J. D., and Tallman, M. S. (2003).
Acute myeloid leukemia and acute promyelocytic
leukemia. Hematology / the Education Program of the
American Society of Hematology. American Society of
Hematology. Education Program, pages 82–101.
Naim, I., Datta, S., Rebhahn, J., Cavenaugh, J., Mosmann,
T., and Sharma, G. (2014). Swift - scalable clustering
for automated identification of rare cell populations in
large, high-dimensional flow cytometry datasets, part
1: Algorithm design. Cytometry Part A, 85(5):408–
421.
Pedregosa, F., Varoquaux, G., Gramfort, A., Michel, V.,
Thirion, B., Grisel, O., Blondel, M., Prettenhofer,
P., Weiss, R., Dubourg, V., Vanderplas, J., Passos,
A., Cournapeau, D., Brucher, M., Perrot, M., and
Duchesnay, E. (2011). Scikit-learn: Machine learning
in Python. Journal of Machine Learning Research,
12:2825–2830.
Powers, D. M. W. (2011). Evaluation: From precision, re-
call and f-measure to roc., informedness, markedness
& correlation. Journal of Machine Learning Tech-
nologies, 2(1):37–63.
Pui, C.-H., Robison, L., and Look, A. (2008). Acute lym-
phoblastic leukaemia. The Lancet, 371(9617):1030–
1043.
Puumala, S. E., Ross, J. A., Aplenc, R., and Spector, L. G.
(2013). Epidemiology of childhood acute myeloid
leukemia. Pediatric blood & cancer, 60(5):728–33.
Reiter, M., Rota, P., Kleber, F., Diem, M., Groeneveld-
Krentz, S., and Dworzak, M. (2016). Clustering of
cell populations in flow cytometry data using a com-
bination of Gaussian mixtures. Pattern Recognition,
60:1029–1040.
Rota, P., Reiter, M., Groeneveld-Krentz, S., and Kampel,
M. (2016). The role of machine learning in medical
data analysis. a case study: Flow cytometry. In Pro-
ceedings of the Internaction Conference on Computer
Vision Theory and Applications.
Rubnitz, J. E. and Inaba, H. (2012). Childhood acute
myeloid leukaemia. British Journal of Haematology,
159(3):259–276.
Zare, H., Shooshtari, P., Gupta, A., and Brinkman, R.
(2010). Data reduction for spectral clustering to ana-
lyze high throughput flow cytometry data. BMC bioin-
formatics, 11(1):403.
ICPRAM 2018 - 7th International Conference on Pattern Recognition Applications and Methods
408
