
Visual Analysis and Exploration of Entity Relations in Document
Collections
Markus John
1
, Florian Heimerl
2
, Ba-Anh Vu
1
and Thomas Ertl
1
1
Institute for Visualization and Interactive Systems, University of Stuttgart, Stuttgart, Germany
2
Department of Computer Sciences, University of Wisconsin-Madison, Madison, U.S.A.
Keywords:
Exploratory Visual Text Analytics, Digital Humanities, Document Visualization, Natural Language Process-
ing.
Abstract:
Interactive text visualization can help users explore and gain insights into complex and often large document
sets. One popular visualization strategy to represent such collections is to depict each document as a glyph
in 2D space. These spaces have proven effective, especially when combined with interactive exploration
methods. However, current exploratory approaches are largely limited to single areas of a 2D spatialization,
lacking support for important comparative exploration and analysis tasks. In this paper, we extend a flexible
focus+context exploration technique to tackle this challenge. In particular, based on practical tasks from the
digital humanities, we focus on exploring and investigating relationships between entities in large document
collections. Our approach uses natural language processing to extract characters and places, including infor-
mation about their relationships. We then use linked views to facilitate visual analysis of extracted information
artifacts. Based on two usage scenarios, we demonstrate successful applications of the approach and discuss
its benefits and limitations.
1 INTRODUCTION
Recently, visual text analysis has gained a lot of at-
tention. This is not surprising given the ever increas-
ing amount of digitized texts. In the domain of dig-
ital humanities, web portals such as Project Guten-
berg
1
or Google Books
2
provide easy access and of-
fer new opportunities to derive high-quality informa-
tion from text. Natural language processing (NLP)
can be used to automatically extract information from
text, such as entities or important topics, which can
then be abstracted and visualized. Interactive visual-
ization offers a large collection of effective methods
to explore, analyze, and understand such abstractions.
Well-known approaches have been introduced, for ex-
ample, for extracting named entities and visually ex-
ploring their relationships (Stasko et al., 2008), and
for analyzing large collections of annotated text (Cor-
rell et al., 2011).
An established visualization technique for large
text collections is to depict each document as a glyph
on a 2D plane. An early example (Wise et al., 1995)
creates a 2D spatialization of documents in order to
1
http://www.gutenberg.org
2
https://books.google.com/
support analysts to better understand document simi-
larities. There are many other approaches in this con-
text, which offer interaction methods for well-defined
information needs. However, approaches that enable
users to freely explore and navigate 2D spatializations
on different level of abstractions are rare. DocuCom-
pass (Heimerl et al., 2016), which consists of an in-
teractive focus+context approach based on the magic
lens metaphor, is a prominent one. It offers several
methods to characterize and summarize documents
and allows users to freely explore and analyze the 2D
space.
The method we present is based on the DocuCom-
pass design, and extends it in several aspects. Based
on close collaborations with humanities scholars, we
have derived practical analysis scenarios and tasks
for literary texts. The need for such methods also
became obvious in an initial user feedback session
of DocuCompass, during which several participants
with a humanities background expressed their interest
in such approaches. In particular, our collaborators
are concerned with the analysis of novels. Practical
examples are the Middle High German novel Parzi-
val (Von Eschenbach et al., 2003), which consists of
several books, or the epistolary novel The Sorrows of
244
John, M., Heimerl, F., Vu, B-A. and Ertl, T.
Visual Analysis and Exploration of Entity Relations in Document Collections.
DOI: 10.5220/0006614902440251
In Proceedings of the 13th International Joint Conference on Computer Vision, Imaging and Computer Graphics Theory and Applications (VISIGRAPP 2018) - Volume 3: IVAPP, pages
244-251
ISBN: 978-989-758-289-9
Copyright © 2018 by SCITEPRESS – Science and Technology Publications, Lda. All rights reserved

Young Werther (Von Goethe, 1991), which comprises
a collection of letters. The complexity of such mate-
rials and the fact that many literary works of interest
consist of a collection of different texts underlines the
importance of support for comparative analysis sce-
narios. As an initial step during analysis, getting an
overview of the occurring entities, the relationships
between them, and their development during the sto-
ryline is important.
To tackle these challenges, we created an interac-
tive design that affords exploration and investigation
of relationships between entities in a document col-
lection. The approach uses NLP methods to extract
entities and terms, which provide a first impression
about their relationships. Based on the results, we de-
velop visual abstractions that afford tasks relevant to
the concept of “distant reading” (Moretti, 2005). Vi-
sual abstractions of text documents convey useful in-
formation and assist users in getting a general under-
standing of the information a document contains with-
out reading the whole text (Koch et al., 2014). This
can be especially helpful when analyzing a large doc-
ument collection. At the same time, however, users
need full access to the source texts for “close read-
ing” to verify findings or hypotheses. For this reason,
we include visual abstractions that enable users to di-
rectly access text passages a particular information ar-
tifact is extracted from.
The main contributions of this work are: i) We ex-
tend DocuCompass with additional NLP methods to
extract named entities and information about their re-
lationships. ii) In addition, we provide linked views,
which support a comparative exploration of entity re-
lations in document collections and facilitate a distant
and close reading analysis J
¨
anicke et al. (2015). iii)
Usage scenarios show successful applications of the
approach and demonstrate its benefits and limitations.
2 RELATED WORK
Since our approach is based on DocuCompass, which
support the exploration of 2D document spatializa-
tions using magic lenses, we first summarize existing
approaches in this area. Next, we review visual text
analytics approaches that focus on the analysis of ex-
tracted named entities and their relationships.
2.1 Spatialization of Texts and Magic
Lenses
An established way to represent large document col-
lections is to map each document as a glyph in
2D space. These spatializations are often based on
meta data, such as geo-locations (MacEachren et al.,
2011), or on the vector space model, which repre-
sents each document as a (high-dimensional) vec-
tor. There exist many approaches, such as princi-
pal component analysis (PCA) (Wold et al., 1987)
or the t-distributed stochastic neighbor embedding (t-
SNE) (Van der Maaten and Hinton, 2008), which map
high-dimensional vectors into 2D by optimizing pair-
wise distances to represent document similarities.
However, there are only a few approaches that
support free exploration of these landscapes. Docu-
Compass tries to fill the gap by providing an easy-
to-use exploration method for 2D document special-
izations using magic lenses (Tominski et al., 2014).
In recent years, magic lenses have been introduced
in different areas. For example, Kr
¨
uger et al. (2013)
present an approach, which expands the exploration
lens metaphor to support complex filter queries and
the analysis of movement data. Ellis and Dix (2006)
introduce Sampling Lens, which suppress data items
to reduce visual clutter underneath lenses in a scatter
plot.
There are only few magic lens approaches that
support the exploration and navigation of text col-
lections. (Bosch et al., 2013) offer a magic lens to
analyze geo-located micro blog messages in order to
find topics connected to specific events. The Visual
Classifier (Heimerl et al., 2012) provides a lens that
enables users to explore certain regions of a 2D land-
scape in order to get a first impression of the contents
of the focused documents. With TopicLens, Kim et al.
(2017) present an interface, which computes topic
models of documents underneath the lens in real time
and it shows keywords of the different topics next to
the lens.
2.2 Visual Text Analytics
Over the last decades, multiple visual text analyt-
ics approaches have been developed. For example,
FeatureLens (Don et al., 2007), a system that pro-
vides several linked views and support users with
exploring frequent text patterns in document collec-
tions. Another popular visualization technique is
“ThemeRiver” (Havre et al., 2002), which visualizes
thematic changes over time in large document collec-
tions. With Parallel Tag Clouds, Collins et al. (2009)
introduce a method that uses multiple word clouds to
visualize differences amongst facets of large text cor-
pora.
There are also many visual text analytics ap-
proaches that particularly support the analysis of ex-
tracted named entities and the relation between them.
(Oelke et al., 2013) present an approach that supports
Visual Analysis and Exploration of Entity Relations in Document Collections
245

the analysis of prose literature. It uses a visual litera-
ture fingerprinting method (Keim and Oelke, 2007) to
visually abstract entities, the relation between them,
and their evolution during the plot. However, it is not
possible to directly access the text in order to investi-
gate findings or hypotheses.
John et al. (2016) introduce an approach that ex-
tracts named entities from literary text for an inter-
active co-occurrence analyses. It offers several views,
including word clouds, graphs, and plot visualizations
that facilitate distant and close reading analyses. An-
other similar approach is POSvis (Vuillemot et al.,
2009). It provides multiple coordinated views that
support the analysis of the vocabulary in the vicin-
ity of one or more named entities. However, both sys-
tems have been designed primarily for intra-document
analysis, whereas we support inter-document analy-
sis.
Jigsaw (Stasko et al., 2008) offers several views
that support users in exploring, analyzing, and under-
standing large document collections. It automatically
extracts named entities and allows to track and ex-
plore their relationships across the document collec-
tion. Another approach closely related to our work
is NEREx (El-Assady et al., 2017). It offers an in-
teractive framework to explore and analyze relation-
ship between named entities in verbatim conversa-
tional transcripts. It offers several linked views, in-
cluding network graphs, visual query interfaces, and
text views to reveal thematic and temporal structures
in the text. Both approaches enable users to explore
and analyze document collections, however, they do
not support the exploration of text corpora on ar-
bitrary levels of granularity. Our approach enables
users to activate, adjust, and navigate several different
lenses in order to explore and analyze 2D document
landscapes. Thus, users can adjust their exploration
strategy to a more fine- or coarse-grained analysis in
order to focus and analyze different data sets easily.
3 VISUAL ANALYSIS
Our approach extends DocuCompass and offers effec-
tive means to facilitate the exploration of entity rela-
tions in document collections. It provides NLP meth-
ods for extracting characters and places including in-
formation about their relationships. The approach en-
ables analysts to visually explore these entities and
their relationships in a close and distant reading anal-
ysis based on a co-occurrence analysis. In the follow-
ing, we first summarize the most important details and
features of DocuCompass, and subsequently present
the additional capabilities of our new approach.
3.1 DocuCompass
DocuCompass is a flexible focus+context exploration
technique for 2D spatializations. It provides magic
lenses and fills the gap between visualization and in-
teraction techniques that provide large scale overview
and detailed inspection of a document collection. An-
alysts can freely move a magic lens by clicking and
dragging. Its size can be adjusted by using the mouse
wheel. This way, users can explore text corpora on
different levels of granularity. When analysts focus
on a document subset with a lens, DocuCompass dis-
plays visual abstractions or text labels, which summa-
rize the main content of the documents underneath the
lens. Those are shown next to the lens. The visual ab-
stractions comprise bar charts to depict the number of
citations over time for scientific articles, or heat maps
to provide a preview of term distributions. To get an
overview of the important keywords of the focused
document set, DocuCompass offers the term weight-
ing schemes document frequency (df), term frequency
— inverse document frequency (tf-idf), and G
2
. Fur-
thermore, the approach provides local and global nav-
igation support for an exploratory analysis. Global
navigation supports users with information to identify
and explore areas similar to the focused one. Local
navigation helps users to optimally place and adjust
the lens by providing information about the focused
document set. For global navigation, DocuCompass
offers heat maps, which provide an overview of how
frequent a term is used in other areas. In addition,
users can hover over or click on a term to highlight
all documents that contain this term. To support local
navigation, the approach offers a clustering algorithm
that provides users with information about the simi-
larity structure of the focused document set to assist
local navigation.
3.2 Text Processing
Once a document collection is loaded into the sys-
tem, it is processed in a linguistic analysis pipeline.
We expand the existing DocuCompass pipeline, con-
sisting of tokenization, sentence splitting, lemmatiza-
tion, and keyword extraction methods such as tf-idf or
G
2
, with part-of-speech (POS) tagging and named en-
tity recognition (NER). For both implementations, we
use Stanford CoreNLP
3
. Using NER, entities, such as
characters and places, can be extracted automatically
and thus relations between them can be identified
across the plot. By default, an entity co-occurs with
another entity if they appear in the same or neighbor-
ing sentences. This can be adapted if necessary. POS
3
https://stanfordnlp.github.io/CoreNLP/
IVAPP 2018 - International Conference on Information Visualization Theory and Applications
246
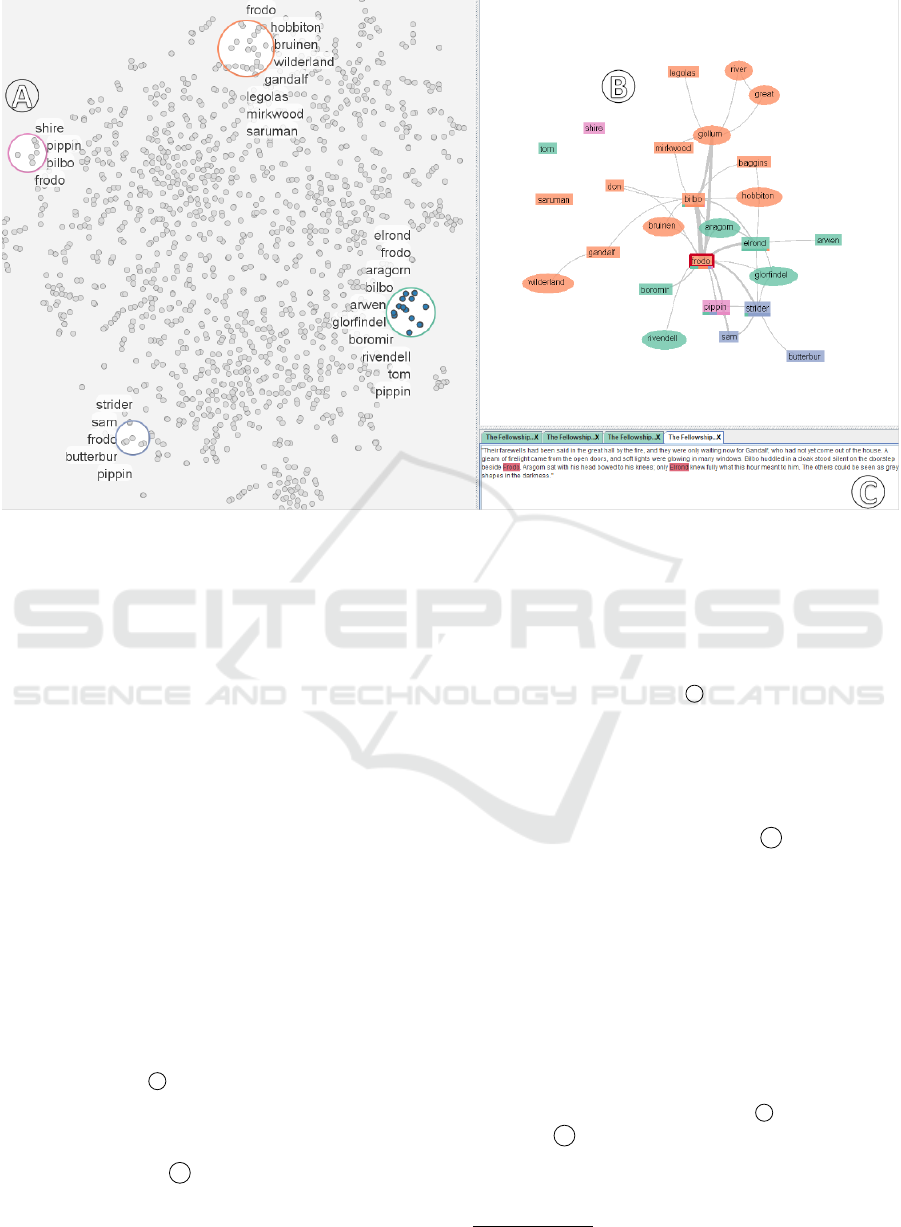
Figure 1: The main workspace consists of (a) the 2D document spatialization view using t-SNE, (b) the entity network view,
and (c) the text view or POS tag explorer.
tagging classifies words in the documents, for exam-
ple, as nouns, verbs, adjectives, or adverbs. Based on
the results, we provide users with information about
verbs and adjectives that co-occur with the extracted
entities. This way, users can get an overview which
terms are used to describe or characterize an entity or
a relation between entities.
3.3 Visual Approach
After the documents have been linguistically ana-
lyzed, the main workspace is shown as depicted in
Figure 1. It consists of a 2D document spatializations
view, an entity network view, and the text or POS tag
explorer. We use t-SNE to map the high-dimensional
vector into a 2D document landscape. Once the 2D
landscape is created, we provide the same features as
DocuCompass (Section 3.1). However, we extend the
approach in several aspects. We provide the possibil-
ity to show the extracted characters and places next to
the lens (Figure 1
a
). This helps users to get a quick
overview of the entities that appear in the focused
document set. In addition, we show the relationships
between entities of multiple lenses in a graph view as
depicted in Figure 1
b
. For this, we assign a unique
color to each of the added lenses. Since we currently
allow five different lenses, we defined a color scheme
consisting of five distinct colors, using the qualita-
tive color scheme of ColorBrewer 2.0
4
. The assigned
colors are consistently used throughout the visualiza-
tions. Furthermore, we enable users to directly access
text passages in order to further analyze relationships
between entities (Figure 1
c
).
After users have activated a lens, the entity net-
work view is updated and can be explored. This view
is based on the prefuse library Heer et al. (2005) and
contains a force-directed graph visualization that rep-
resents relationships between the extracted characters
and places, as depicted in Figure 1
b
. The network
view also supports interactive features, such as pan-
ning, zooming, or re-arranging to support the explo-
ration of the entity network. The rectangular nodes
represent characters, the ellipsoidal nodes places, and
the edges co-occurrences between the entities in the
text. The color of the nodes represent the respec-
tive lenses. If entities are mentioned under different
lenses, we assign the color of the lens under which
the entity occurs most. In addition, we provide two
visual representations to indicate how relevant the en-
tity is in each focused data set. Users can switch be-
tween stacked bar charts (Figure 2
a
) and bar charts
(Figure 2
b
). This helps to get a quick overview of
the occurring entities, their relationships, and their oc-
currences in the focused data sets.
4
http://colorbrewer2.org
Visual Analysis and Exploration of Entity Relations in Document Collections
247
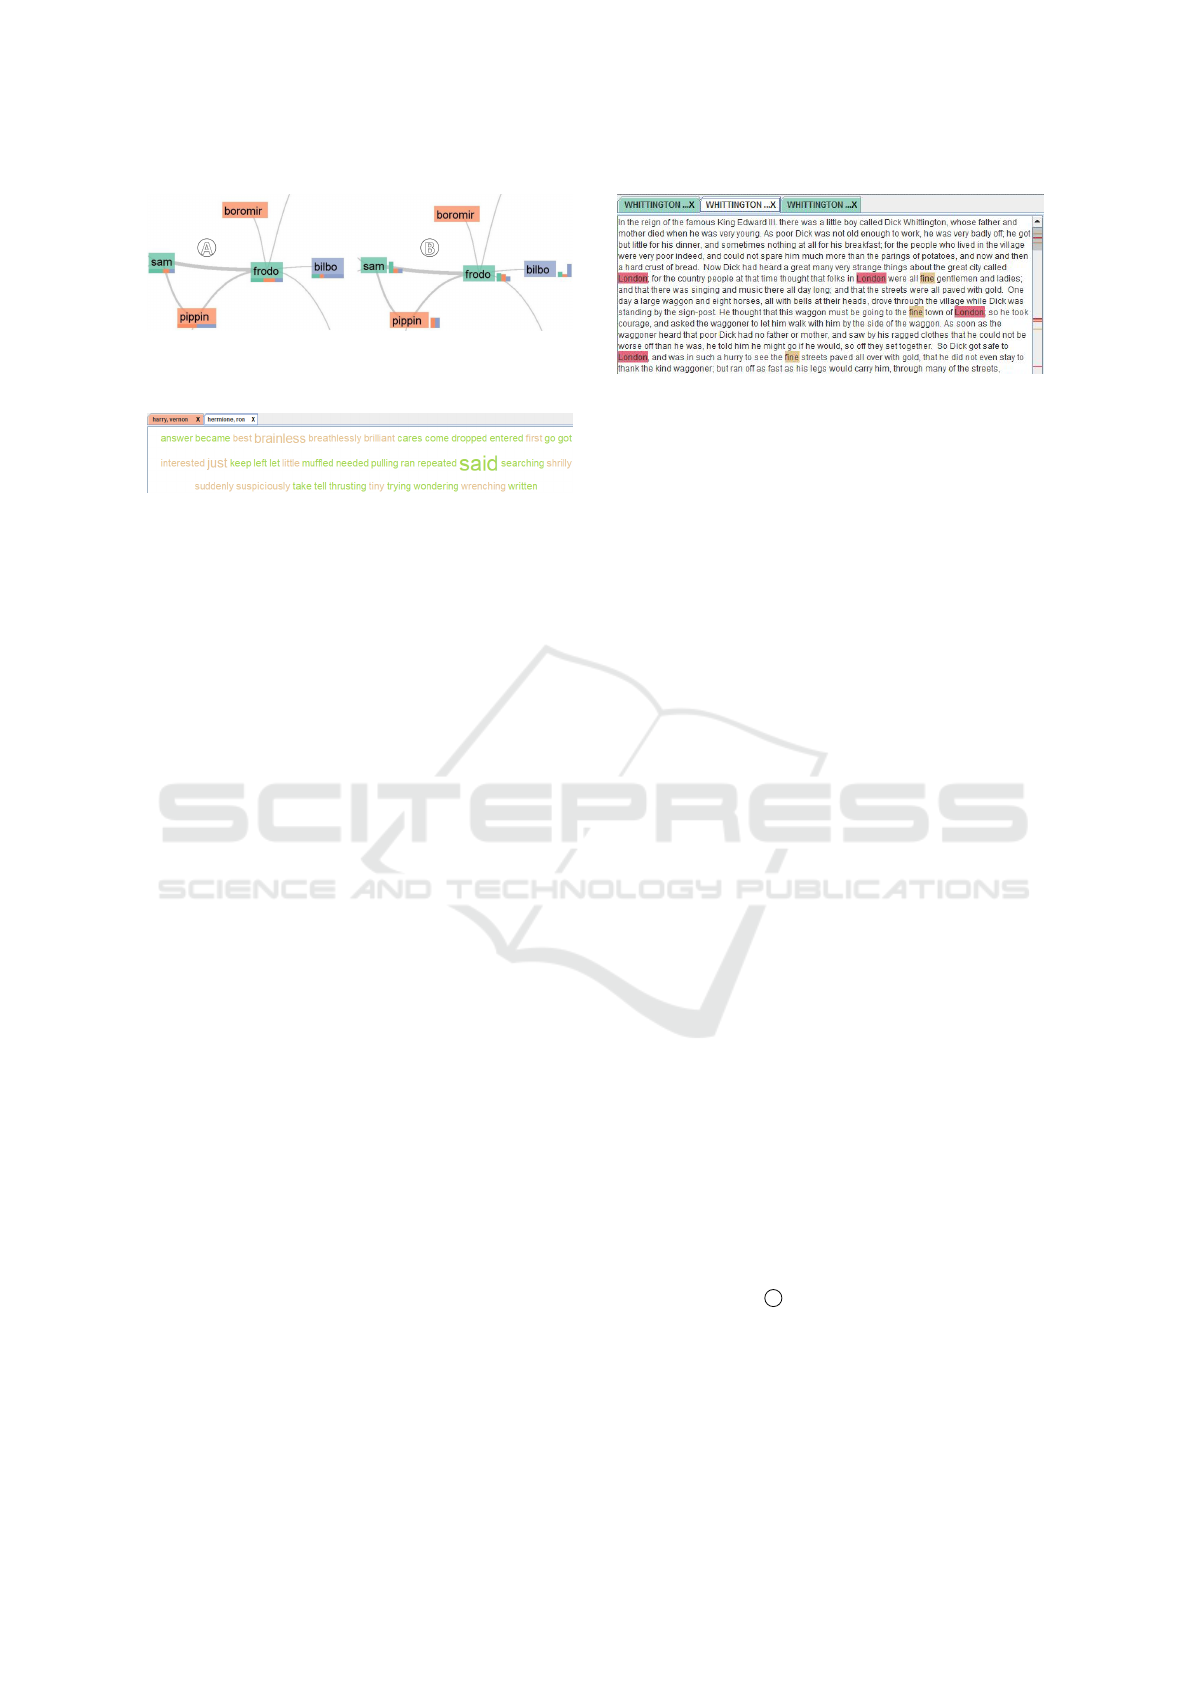
Figure 2: We provide two visual representations, (a) stacked
bar charts and (b) bar charts, to show the distribution of
entities in the different focused document sets.
Figure 3: The POS tag explorer provides an overview of
adjectives and verbs that co-occur with selected entities.
By hovering over a node or an edge, the con-
nected entities are highlighted in red. This supports
users in identifying relationships, especially when it
is a graph with many relations. Furthermore, users
can click on a node or an edge to further investigate
the entity relations in the text view or POS tag ex-
plorer. Additionally, we highlight all documents in
the 2D document landscape that contain the selected
entities. Thus users can easily identify and explore re-
gions with the same occurring entities. The POS tag
explorer is based on a word cloud view and lists all
adjectives and verbs that co-occur with the selected
entities as depicted in Figure 3. Verbs are shown in
green and adjectives in orange. The font size of the
visualized words is scaled proportionally to their oc-
currence frequency. The tabs are named after the cor-
responding entities and colored according to the re-
spective lens. This gives users a first impression of
the main terms that describe an entity or the relation-
ship between two entities.
By clicking on a term, users can further analyze
the occurrences in the text view as depicted in Fig-
ure 4. In addition, users can switch at any time to the
text view through a context menu. This view allows
users to work with the text directly and, again, high-
lights entities in red, verbs in green, and adjectives in
orange. In addition, the text view shows a vertical fin-
gerprint next to its scrollbar to represent the distribu-
tion from the respective occurrences. This helps users
find and analyze text passages faster. Using the tabs,
users can easily switch between different passages.
4 USAGE SCENARIOS
In the following, we present two usage scenarios that
demonstrate the capabilities of the approach by ana-
lyzing a modern and old English novel. A fictitious
Figure 4: Text view with selected place London and adjec-
tive fine.
literary scholar has read both novels a long time ago
and is now trying to retrace the storyline and the rela-
tions between the main characters with the help of the
approach.
For the analysis, we split both novels into smaller
parts based on their paragraphs. Subsequently, we
used t-SNE to create the 2D document landscape,
where each glyph represents a paragraph. Further-
more, we provide the aforementioned visualizations
and interactive features (Section 3.1).
4.1 Analysis of “The Lord of the Rings:
The Fellowship of the Ring”
In our first usage scenario, we present an analysis of
the novel “The Fellowship of the Ring”. It is the
first of three volumes of the novel “The Lord of the
Rings” by J. R. R. Tolkien and was published in 1954.
The storyline is about the fellowship that consists of
nine members: four Hobbits, two Men, one Elf, one
Dwarf, and one wizard and their journey to the land
of Mordor, where they seek to destroy a magical ring.
In the first step, the literary scholar activates a lens
and explores the entities next to the lens. While an-
alyzing different document sets, she encounters the
name Rivendell. She remembers that Rivendell ap-
pears in the storyline, however she cannot recollect
in which context. In order to get more information
about Rivendell, she selects the place to highlight the
corresponding node in the entity network view. That
way, she can easily identify that there is a strong re-
lation between Rivendell and Frodo, a hobbit and the
protagonist. In addition, she finds that a strong rela-
tionship between Frodo and Frodo’s uncle Bilbo exist.
To find out more, she selects the edge between them
to list all co-occurrences in the text explorer as de-
picted in Figure 5
a
. By analyzing the text passages,
she discovers that this is the point of the plot where
Frodo and Bilbo meet again in Rivendell, since they
left their hometown. As a result, she remembers that
Rivendell is the place where Frodo is brought after he
was nearly killed by Nazguls, servants of Sauron, the
original owner of the ring. To learn more, she clicks
IVAPP 2018 - International Conference on Information Visualization Theory and Applications
248
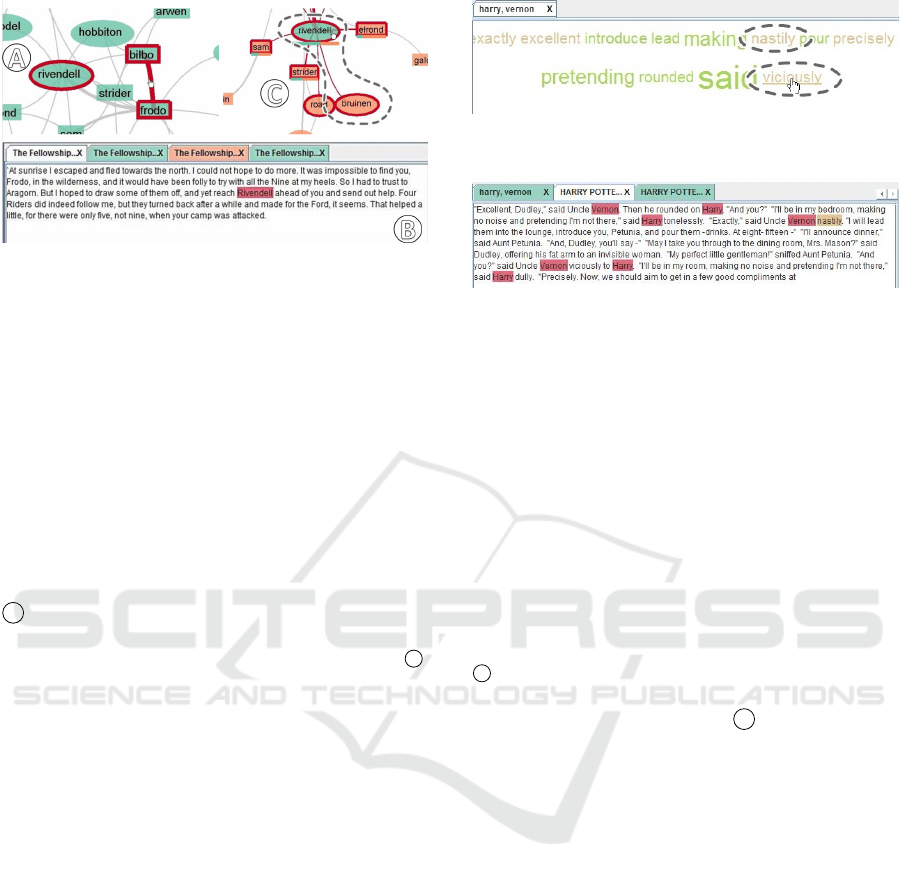
Figure 5: (a) The entity network view that represents the
relationship between Rivendell, Frodo, and Bilbo, (b) the
text view shows the occurrences of Rivendell in the focused
document set, and (c) the entity network view depicts the
relation between the places Rivendell and Bruinen.
the term Rivendell in the 2D document landscape to
highlight all documents that contain this place. Sub-
sequently, she activates another lens to explore the
highlighted documents in the spatializations with the
help of the entity network view. Initially, she finds a
document collection that contains only a small num-
ber of occurrences. The literary scholar then adjusts
the lens in order to cover a larger number of relevant
documents. This way, she locates an interesting docu-
ment set and by analyzing the text passages (Figure 5
b
) she finds more evidence for her assumption. Dur-
ing the analysis, she detects another place, Bruinen,
that is related to Rivendell, as shown in Figure 5
c
.
With the aid of the text explorer, she finds out that
Frodo is carried on a horse towards the Ford of Bru-
inen to Rivendell, with the Nazguls in pursuit.
4.2 Analysis of “Harry Potter and the
Sorcerer’s Stone”
In the second usage scenario, the fictitious scholar an-
alyzes “Harry Potter and the Sorcerer’s Stone” by J.
K. Rowling. It is the first volume of the Harry Potter
series and was published in 1997. The plot is about
the adventures of the young wizard Harry Potter in
his first year at the Hogwarts School of Witchcraft
and Wizardry and the first encounter between him and
Lord Voldemort, a dark wizard who killed Harry’s
parents.
To retrace the course of the novel and the rela-
tion between the main characters, the literary scholar
adds a lens to explore the 2D document spatializations
by means of the entity network view. While explor-
ing, she notices that the person Vernon has a relation
to Harry Potter and is surprised since she cannot re-
member him as depicted in Figure 8. To find out more
about him, she activates the word cloud view with the
occurring verbs and adjectives that provide first in-
Figure 6: Word cloud view of the verbs and adjectives that
co-occur with Harry and Vernon.
Figure 7: The text view with the selected entities Harry and
Vernon and the adjective nastily.
sights into their relationship. By analyzing the word
cloud, she identifies the terms nastily and viciously,
which seem to indicate a negative relationship be-
tween Harry and Vernon, as shown in Figure 6. To
investigate this in more detail, she selects both terms
and analyzes the relevant text passages in which the
terms Harry and Vernon co-occur, as shown in Fig-
ure 7. She learns that Vernon is the uncle of Harry
and that he always treats him spitefully. As a next
step, she again explores the entity network view and
realizes that two subgraphs exist (Figure 8). By fur-
ther analyzing the occurring persons and their rela-
tionships, she finds that the first subgraph (Figure 8
a
) represents the world of Muggle (non-magical),
where Harry Potter lived until he was 11 years old.
The second subgraph (Figure 8
b
) depicts the rela-
tions of Harry to entities of the world of wizards.
The usage scenarios show that our approach fa-
cilitates analysts in exploring and analyzing named
entities in document collections. The implemented
automatic and visual methods support users to gain
insights and to generate and verify hypotheses.
5 DISCUSSION AND FUTURE
WORK
The presented approach is effective at supporting ex-
ploration and comparative analysis of entities and
their relationships in document collections. However,
there are several remaining challenges that we would
like to discuss here.
Our approach can be flexibly expanded by addi-
tional visualizations, such as a plot view Liu et al.
(2013). It can convey a coarse idea of the storyline
and helps to get an overview of the dynamic relation-
ships between entities.
Visual Analysis and Exploration of Entity Relations in Document Collections
249
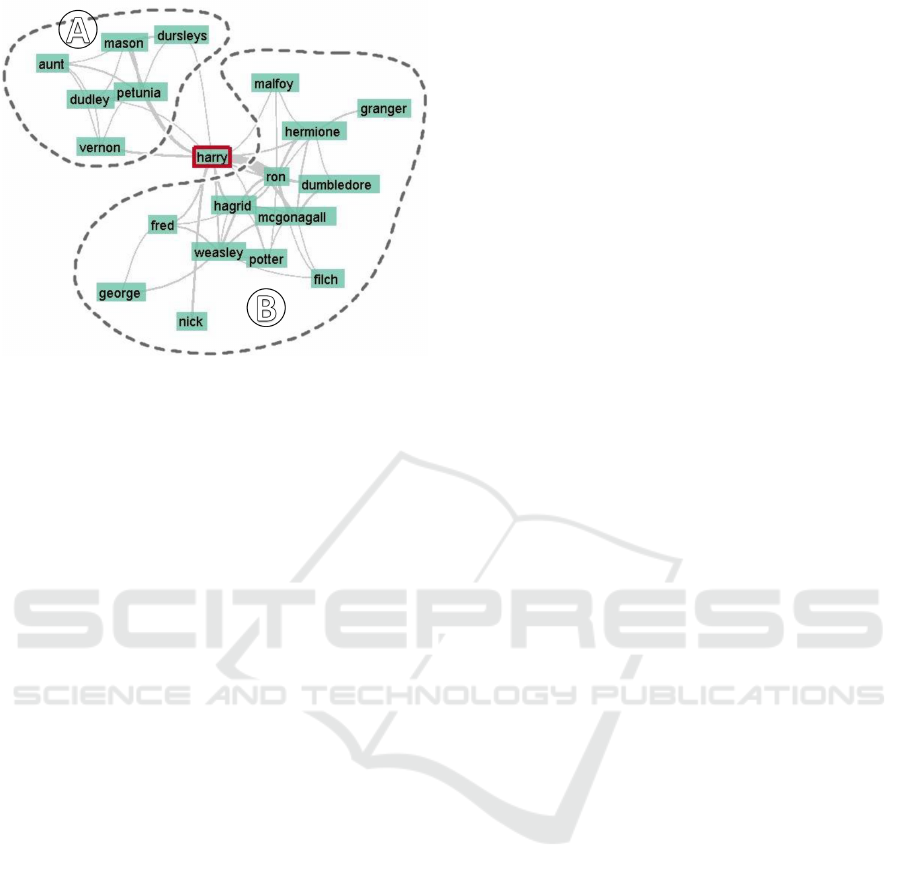
Figure 8: The entity network depicts two subgraphs: (a)
entities of the Muggle and (b) of the world of wizards.
Furthermore, we want to visualize the temporal
development of such a network and the possibility to
compare different states of networks. This could be
realized by either a juxtaposed or superimposed ap-
proach Beck et al. (2014). The former place small
multiples next to each other. Users then, for exam-
ple, have to trace a node over several small diagrams.
Superimposed approaches, on the other hand, can be
stacked on top of each other and differences can be
marked by color or stroke.
Another missing aspect for analysis is the rep-
resentation of the temporal information. Especially,
when working with time-dependent storylines, such
as the volumes of “Harry Potter”. Therefore, we
aim to provide temporal information of the differ-
ent focused document set. One option could be to
complement the entity network with several finger-
prints that show the occurrences of entities and link
them to different focused documents. In addition,
we plan to map the temporal context for each glyph
in the 2D document landscape similar to the idea of
ClockMap Fischer et al. (2012).
Current co-occurrence detection is based on
named entity recognition and a straightforward dis-
tance measure between them. This works well for
most cases, but nor for all, especially those involving
anaphora or different names for the same person. To
improve the current detection method, we plan to in-
clude coreference resolution in the future, which can
find all expressions that refer to the same entity in a
text.
NLP approaches are typically trained on large and
contemporary corpora and cannot be expected to pro-
vide state-of-the-art results for historical texts. This
can lead to uncertainties and errors in the preprocess-
ing steps and subsequently in the visualizations. To
tackle this challenge, we want to communicate the
uncertainty in the visualization to make users aware
of it. A possibility could be to provide visual cues,
such as color saturation to indicate the uncertainty.
In addition, we will let users adapt and correct errors
interactively to improve the performance of the NLP
techniques.
The presented approach provides first insights and
serves as a basis for discussion with our literature ex-
perts. Based on this feedback and insights, we want
to further improve the approach in close cooperation
with them. This way, we can tailor specific features
and visualizations in a formative process to better sup-
port their analysis.
6 CONCLUSION
In this work, we have presented an approach for ex-
ploring and investigating relationships between enti-
ties in document collections. It provides NLP meth-
ods to automatically extract characters and places, in-
cluding information about their relationship. These
extracted information can be analyzed in a close and
distant reading fashion. To support this, we offer
linked views that facilitate exploration of entity rela-
tions. Analysts can activate, adjust, and freely navi-
gate multiple lenses to explore the occurring entities
in a 2D document space. In addition, an entity net-
work view shows relations between entities of differ-
ent document subsets and enables users to directly ac-
cess text passages to further investigate the relation-
ships between them. Two usage scenarios provide
first insights and show the applicability and useful-
ness of our approach.
ACKNOWLEDGMENTS
This work was funded by the German Federal Min-
istry of Education and Research (BMBF) as of the
Center for Reflected Text Analysis CRETA at Uni-
versity of Stuttgart.
REFERENCES
Beck, F., Burch, M., Diehl, S., and Weiskopf, D. (2014).
The state of the art in visualizing dynamic graphs. Eu-
roVis STAR, 2.
Bosch, H., Thom, D., Heimerl, F., P
¨
uttmann, E., Koch, S.,
Kr
¨
uger, R., W
¨
orner, M., and Ertl, T. (2013). Scat-
terBlogs2: Real-time monitoring of microblog mes-
IVAPP 2018 - International Conference on Information Visualization Theory and Applications
250

sages through user-guided filtering. IEEE Trans. Vis.
Comput. Graph., 19(12):2022–2031.
Collins, C., Viegas, F. B., and Wattenberg, M. (2009). Par-
allel Tag Clouds to explore and analyze faceted text
corpora. In 2009 IEEE Symposium on Visual Analyt-
ics Science and Technology, pages 91–98.
Correll, M., Witmore, M., and Gleicher, M. (2011). Explor-
ing collections of tagged text for literary scholarship.
Computer Graphics Forum, 30(3):731–740.
Don, A., Zheleva, E., Gregory, M., Tarkan, S., Auvil,
L., Clement, T., Shneiderman, B., and Plaisant, C.
(2007). Discovering interesting usage patterns in text
collections: Integrating text mining with visualiza-
tion. In Proceedings of the Sixteenth ACM Conference
on Conference on Information and Knowledge Man-
agement, CIKM ’07, pages 213–222, New York, NY,
USA. ACM.
El-Assady, M., Sevastjanova, R., Gipp, B., Keim, D. A.,
and Collins, C. (2017). NEREx: Named-Entity Re-
lationship Exploration in Multi-Party Conversations.
Computer Graphics Forum, 36(3):213–225.
Ellis, G. and Dix, A. (2006). Enabling automatic clut-
ter reduction in parallel coordinate plots. IEEE
Transactions on Visualization and Computer Graph-
ics, 12(5):717–724.
Fischer, F., Fuchs, J., and Mansmann, F. (2012). ClockMap:
Enhancing circular treemaps with temporal glyphs for
time-series data. Proc. EuroVis Short Papers, Euro-
graphics, pages 97–101.
Havre, S., Hetzler, E., Whitney, P., and Nowell, L. (2002).
ThemeRiver: visualizing thematic changes in large
document collections. IEEE Trans. Vis. Comput.
Graph., 8(1):9–20.
Heer, J., Card, S. K., and Landay, J. (2005). Prefuse: A
toolkit for interactive information visualization. In
ACM Human Factors in Computing Systems (CHI),
pages 421–430.
Heimerl, F., John, M., Han, Q., Koch, S., and Ertl, T.
(2016). DocuCompass: Effective exploration of docu-
ment landscapes. In 2016 IEEE Conference on Visual
Analytics Science and Technology (VAST), pages 11–
20.
Heimerl, F., Koch, S., Bosch, H., and Ertl, T. (2012). Visual
Classifier training for text document retrieval. IEEE
Trans. Vis. Comput. Graph., 18(12):2839–2848.
J
¨
anicke, S., Franzini, G., Cheema, M. F., and Scheuermann,
G. (2015). On Close and Distant Reading in Digi-
tal Humanities: A Survey and Future Challenges. In
Eurographics Conference on Visualization (EuroVis)
– STARs, EuroVis ’15. The Eurographics Association.
John, M., Lohmann, S., Koch, S., W
¨
orner, M., and Ertl, T.
(2016). Visual analysis of character and plot infor-
mation extracted from narrative text. In International
Joint Conference on Computer Vision, Imaging and
Computer Graphics, pages 220–241. Springer.
Keim, D. and Oelke, D. (2007). Literature Fingerprinting:
A new method for visual literary analysis. In Pro-
ceedings of the IEEE Symposium on Visual Analytics
Science and Technology, VAST ’07, pages 115–122.
Kim, M., Kang, K., Park, D., Choo, J., and Elmqvist, N.
(2017). TopicLens: Efficient multi-level visual topic
exploration of large-scale document collections. IEEE
Transactions on Visualization and Computer Graph-
ics, 23(1):151–160.
Koch, S., John, M., Worner, M., Muller, A., and Ertl, T.
(2014). VarifocalReader in-depth visual analysis of
large text documents. Visualization and Computer
Graphics, IEEE Transactions on, 20(12):1723–1732.
Kr
¨
uger, R., Thom, D., Wrner, M., Bosch, H., and Ertl, T.
(2013). TrajectoryLenses a set-based filtering and
exploration technique for long-term trajectory data.
Computer Graphics Forum, 32(3pt4):451–460.
Liu, S., Wu, Y., Wei, E., Liu, M., and Liu, Y. (2013).
StoryFlow: Tracking the evolution of stories. IEEE
Transactions on Visualization and Computer Graph-
ics, 19(12):2436–2445.
MacEachren, A. M., Jaiswal, A., Robinson, A. C.,
Pezanowski, S., Savelyev, A., Mitra, P., Zhang, X.,
and Blanford, J. (2011). SensePlace2: Geotwitter
analytics support for situational awareness. In Proc.
IEEE Conf. on Visual Analytics Science and Technol-
ogy (VAST), pages 181–190.
Moretti, F. (2005). Graphs, maps, trees: abstract models
for a literary history. Verso.
Oelke, D., Kokkinakis, D., and Keim, D. A. (2013). Fin-
gerprint Matrices: Uncovering the dynamics of social
networks in prose literature. Computer Graphics Fo-
rum, 32(3pt4):371–380.
Stasko, J., G
¨
org, C., and Liu, Z. (2008). Jigsaw: Support-
ing investigative analysis through interactive visual-
ization. Information Visualization, 7(2):118–132.
Tominski, C., Gladisch, S., Kister, U., Dachselt, R., and
Schumann, H. (2014). A Survey on Interactive Lenses
in Visualization. EuroVis STAR, 3.
Van der Maaten, L. and Hinton, G. (2008). Visualizing Data
using t-SNE. J. Mach. Learn. Res., 9:2579–2605.
Von Eschenbach, W., Lachmann, K., Schirok, B., et al.
(2003). Parzival. Walter de Gruyter.
Von Goethe, J. W. (1991). Die Leiden des jungen Werthers.
In ICD-10 literarisch, pages 159–170. Springer.
Vuillemot, R., Clement, T., Plaisant, C., and Kumar, A.
(2009). What’s being said near “Martha”? Explor-
ing name entities in literary text collections. In Pro-
ceedings of the IEEE Symposium on Visual Analytics
Science and Technology, 2009, VAST ’09, pages 107–
114.
Wise, J., Thomas, J., Pennock, K., Lantrip, D., Pottier,
M., Schur, A., and Crow, V. (1995). Visualizing the
non-visual: spatial analysis and interaction with in-
formation from text documents. In Proceedings of the
IEEE Symposium on Information Visualization, 1995.,
pages 51–58.
Wold, S., Esbensen, K., and Geladi, P. (1987). Principal
component analysis. Chemometrics and intelligent
laboratory systems, 2(1-3):37–52.
Visual Analysis and Exploration of Entity Relations in Document Collections
251
