
Intelligent Digital Built Heritage Models: An Approach from Image
Processing and Building Information Modelling Technology
Pedro V. V. de Paiva, Camila K. Cogima, Eloisa Dezen-Kempter,
Marco A. G. de Carvalho and Lucas R. Cerqueira
School of Technology, University of Campinas, Limeira, S˜ao Paulo, Brazil
Keywords:
BIM, Built Heritage, Image Segmentation, Region Growing, Point Cloud.
Abstract:
Conservation and maintenance of historic buildings have exceptional requirements and need a detailed diag-
nosis and an accurate as-is documentation. This paper reports the use of Unmanned Aerial Vehicle (UAV) im-
agery to create an Intelligent Digital Built Heritage Model (IDBHM) based on Building Information Modeling
(BIM) technology. Our work outlines a model-driven approach based on UAV data acquisition, photogram-
metry, post-processing and segmentation of point clouds to promote partial automation of BIM modeling pro-
cess. The methodology proposed was applied to a historical building facade located in Brazil. A qualitative
and quantitative assessment of the proposed segmentation method was undertaken through the comparison be-
tween segmented clusters and as-designed documents, also as between point clouds and ground control points.
An accurate and detailed parametric IDBHM was created from high-resolution Dense Surface Model (DSM).
This Model can improve conservation and rehabilitation works. The results demonstrate that the proposed ap-
proach yields good results in terms of effectiveness in the clusters segmentation, compared to the as-designed
model.
1 INTRODUCTION
Historic buildings have exceptional maintenance,
conservation, and restoration requirements, and be-
cause of this a detailed diagnosis and documentation
are mandatory to the conservation, restoration and re-
habilitation works. Recent decades have enhanced
the consideration of the architectural object as a doc-
ument itself, that contain lots of information. This
knowledge is necessary for the understanding of the
building in its physical reality, historical and cultural
circumstances that have generated and transformed it.
Currently, the results of multidisciplinary surveys
are dispersed on many platforms, making it difficult
to understand the architectural object. On the other
hand, new information and communication technolo-
gies still do little to benefit historic buildings. Intel-
ligent models created by Building Information Mod-
elling (BIM) technologies introduce promising appli-
cation on this issue.
The BIM-enabled method provides a component-
oriented systematic central database gathering shape,
structure, materials, historical and life cycle prop-
erties, a benefit features for cultural heritage field
((Penttil¨a et al., 2007; Fai et al., 2011; Manferdini and
Remondino, 2012)). Concerning to the historical as-
sets, the difficulty to obtain both the as-designed and
the as-built reference documentation makes the sur-
veying starting from the real object, in a reverse engi-
neering process. Thus, the first step for the creation of
an as-is BIM model is data capture. In the data collec-
tion process for as-built/as-is documentation, choos-
ing the best method for reality capture has proven
to be challenging to address(Dezen-Kempter et al.,
2015). High-resolution data capture, such terrestrial
3D laser scanning, lead to expensive equipment, ardu-
ous management, and professional post-processing,
restricting the use of this technology. Photogram-
metry can represent a low-cost technological alterna-
tive for the DSM (Dense Surface Model) generation.
The use of high-resolution cameras coupled to UAV
(Unmanned Aerial Vehicles), in high precision sur-
veys, has been increasingly frequent, with results very
close to 3D laser scanning. This paper describes a
BIM-driven approach for historic buildings, based on
(i) photogrammetric 3D building survey with a UAV,
(ii) image processing and segmentation into architec-
tural components and (iii) development of BIM as-is
model-based.
This paper is organized as follows: Section 2
558
Paiva, P., Cogima, C., Dezen-Kempter, E., Carvalho, M. and Cerqueira, L.
Intelligent Digital Built Heritage Models: An Approach from Image Processing and Building Information Modelling Technology.
DOI: 10.5220/0006615005580565
In Proceedings of the 13th International Joint Conference on Computer Vision, Imaging and Computer Graphics Theory and Applications (VISIGRAPP 2018) - Volume 4: VISAPP, pages
558-565
ISBN: 978-989-758-290-5
Copyright © 2018 by SCITEPRESS – Science and Technology Publications, Lda. All rights reserved

presents related works. Section 3 describes the pro-
posed approach. Section 4 describes equipment used
and details about the method developed in this re-
search. Section 5 presents the results from the indi-
vidual stages. Finally, in the Section 6 shows conclu-
sions and future works guidance.
2 RELATED WORKS
Many researchers have tried to construct as-is BIMs
adopting various input types, also considering differ-
ent levels of building information in their models (Lu
and Lee, 2017). Although laser scanning is still the
acquisition method mainly used, photography and its
integrations are already accepted as a feasible and
promising low-cost alternative, especially Structure
from Motion point clouds (Bhatla et al., 2012).
Brilakis et al. proposedan information-richmodel
by merging data from laser and image collections
(Brilakis et al., 2010), this fusion can be reached ap-
plying supervised IPC algorithm then smooth with
scale-invariant feature transform. Once combined a
textured 3D surface its estimated by mesh triangula-
tion and pixel correlation. Even without implementa-
tion, authors recommend feature extraction from ge-
ometry and image canonical parts (Savarese and Fei-
Fei, 2007) as descriptors for item labeling. The work
defined a complete as-is BIM as an open challenge.
A semi-automatic approach for existing buildings
was proposed by Dore and Murphy, also integrating
laser and image data. The concept called Historic
Building Information Modelling (HBIM) provides a
parametric object library using geometric program-
ming language (Dore and Murphy, 2014). A col-
lection of predefined architectural elements its used
to simplify manual modelling tasks. Pre-processing
steps, such registration, and filtering are carried out
first. Although experiments indicate more efficiency
than existing BIM tools, pattern limitation, and low
automation reduces usability and remain the manual
effort necessary to process the information.
Another alternative proposed by Jung et al tries to
increase automation for modelling in scenes captured
with laser scanning. Rather than use point clouds,
researchers suggest simple edge lines as guides for
object shaping in BIM software (Jung et al., 2014).
Borders are carried out segmenting data into sub-
sets sorted has planes. Subdivisions are made using
RANSAC (Fischler and Bolles, 1981) that calculates
the probability of a point belongs to the best group,
followed by refinement. Thus, each plane is projected
onto 2D binary images where non-zero represents oc-
cupied positions. Boundary tracing search for not null
pixels in value changing areas and iteratively connect
neighbors. Despite the fact that this method adds au-
tonomous stages the process appear semi-auto indeed,
and hard to evaluate.
Wang et al have a similar approach, comparing
with Jung et al, differing only in algorithm chose and
BIM integration. Same sensors where applied on the
acquisition (Wang et al., 2015), but data suffered ef-
ficiency enhancement as downsizing and outliers re-
motion. Hereafter,region growing its used to segment
planes using curvature and angular similarity between
points. Once disjoint, all areas have its edge com-
puted by concavehull border extractor (De Berg et al.,
2008). Instead of finish the process as soon as lines
are delimited, previouslydefined rules classify the ob-
tained forms, adding likely labels. This method was
evaluated comparing its output with golden standard
and reached high error rates.
The technique described in our paper, analog to
Wang et al, uses region growing algorithm to iden-
tify architectural elements and similar pre-processing.
Our contribution can be enumerated as follow: (1) a
new UAV acquisition protocol is presented, specify-
ing close-range methodology able to produce viable
images for a 3D model generation; (2) project docu-
ments are used to evaluate the segmentation stage in-
troducing trustworthy validation; (3) clouds acquired
by laser scanning and images were compared and fi-
nally (4) every step, since acquisition until model ver-
ification, were profoundly presented and produced a
replicable workflow.
3 PROPOSED APPROACH
This research applies a few methods described in the
scientific literature for each one of the process steps
of the IDBHM creation. It was required adjustments
in peculiar characteristics of the case study. Figure 1
shows the proposed methodology approach.
The method is composed of six primally stage.
Those phases can be generalized as:
Capture Planning: The use of UAV in the capture
of elements in short and close-range domain, partic-
ularly in the case of historical heritage, still does not
have techniques widely disseminated, which leads to
the application of strategies created for terrestrial cap-
ture stations (Nex and Remondino, 2014). Particular
challenges in specific structures require a case to case
adaptation. Despite that, three parameters are the con-
sensus among different conventions: (i) calibration of
all sensors involved, (ii) the full angular range of cap-
ture and (iii) the high percentage of overlap between
images.
Intelligent Digital Built Heritage Models: An Approach from Image Processing and Building Information Modelling Technology
559
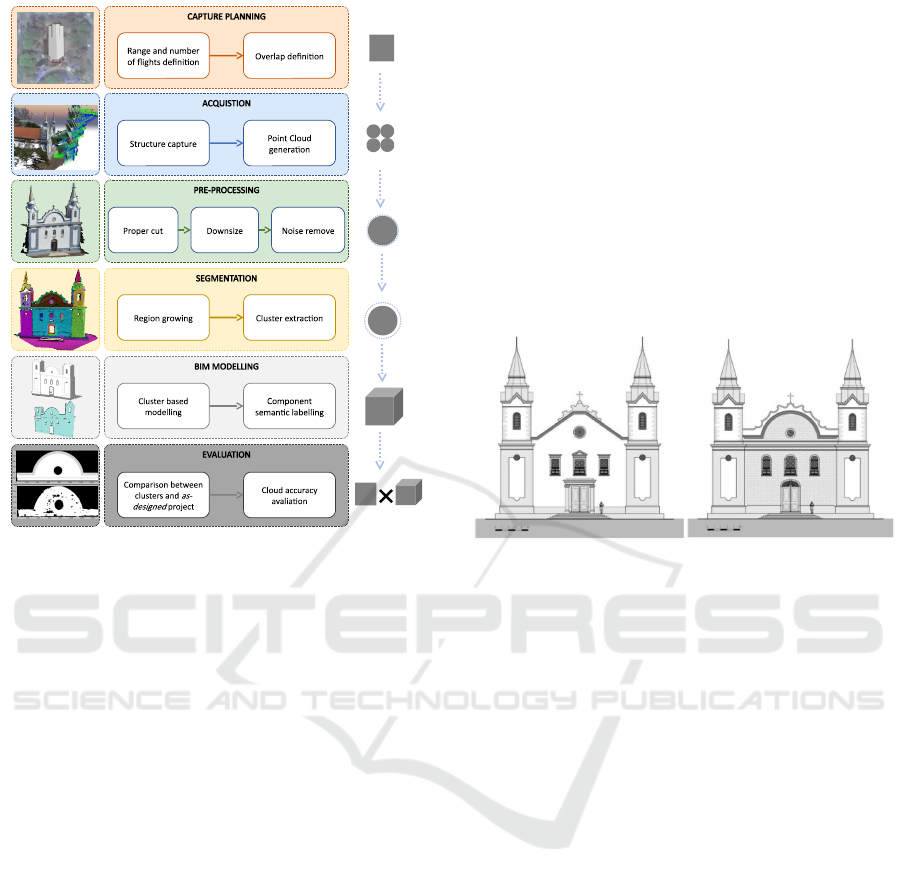
Figure 1: Methodology description of each step in the work-
flow.
Acquisition: Based on flight planning, the geomet-
ric object information was captured using UAV and
modeled applying proprietary DSM generator.
Preprocessing: Several challenges are related to the
point cloud segmentation task, such as noise filtering,
low density and non-organized data (Nguyen and Le,
2013). In order to minimize such problems filtering
operations or other kind of data preparation are usu-
ally necessary.
Segmentation: Segmentation is the process of par-
titioning an image changing its representation into
something more meaningful. Even though its im-
portance in image analysis and decades of research,
segmentation remains a challenger task. The tridi-
mensional case is found in the same statement, hard
in the same way. Low angular variability is a well-
known property of plane surfaces. This property is
used for point cloud segmentation techniques like re-
gion growing, for instance.
BIM Modelling: The output of point cloud segmen-
tation was a set of points from each building archi-
tectural element (clusters). The clusters enabled the
development of the BIM Model corresponding to the
development of parametric objects.
Evaluation: Quantitative metrics are toke based
on comparisons between clusters, as-designed docu-
ment, and point cloud accuracy.
4 METHODOLOGY
To validate the proposed approach, a 19th-century
historical building in the city of Limeira (Brazil), the
Boa Morte Church (BMC), was selected as the case
study. The church was designed by the Italian Aur
´
elio
Civatti in 1867 in neo-classical style. The build-
ing technique used in the BMC was rammed earth, a
feature from traditional Portuguese construction that
uses mud and clay mixture woven together with wood
and bamboo structure. The great thickness of the
walls is a characteristic feature of this technique. The
BMC main body walls are between 90 and 177cm
thick.
Figure 2: [a] Original facade of BM’s church (1867); [b]
Facade after restoration (1890).
The facade collapsed only 12 years after its com-
pletion. In 1890, part of the Frontispiece was redone,
replacing the rammed earth for baked clay brick.The
modenature of the main door and the choir windows
were also modified, like the triangular neo-classical
pediment by an arched one of eclectic characteristics
(Figure 2). The main architectural elements of the fa-
cade were identified, aiming at the segmentation pro-
cess and the subsequent modelling of BIM parametric
objects. Figure 3 highlights these elements:
The following subsections present the detailing of
each step of the proposed workflow.
4.1 Capture Planning
The implementation of BMC, in the center of a
square, foster the UAV imagery capture because there
is no significative obstacle in the 15m in front of its
facade. This way, the UAV could fly freely, both verti-
cally and horizontally, operated either by application
or manually (Figure 4). For the UAV scanning plan
was considered the distance between the building and
the UAV, the building height and width (25m× 25m),
the minimum desired overlapping(70%) and the cam-
era performance. Thus, was proposed a flight with six
horizontal lines, starting at the top of the building, the
camera automatically snapped the shot every 2 sec-
onds with the UAV flying at about 5m/s.
VISAPP 2018 - International Conference on Computer Vision Theory and Applications
560
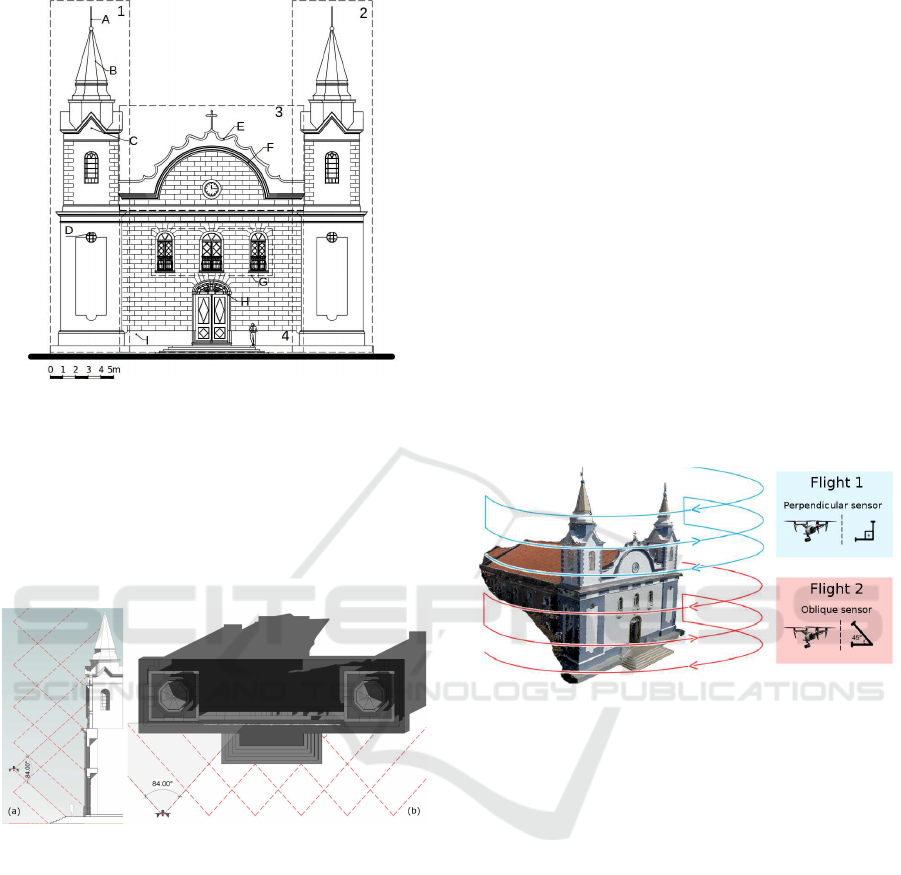
Figure 3: BMC architectural elements: (1) right bell tower;
(2) left bell tower; (A) Pinnacle with with a golden weather-
cock); (B) octagonal dome; (C) triangular pediment of the
bell tower; (D) oculus; (3) double pediment with a clock on
the tympanum; (E) rampant scrolls; (F) straight cymatium;
(4) frontispiece, with spare bell towers base (cornice high-
lighted in the figure made up of cymatium and friezes); (G)
chorus windows, entirely open, in full arch; f. oculus; (H)
main door with lintel in segmental arch and door frame both
in carved stone;(I) basement.
Figure 4: UAV positions for aerial photography, [a] eleva-
tion - vertical view and [b] cross section - horizontal view.
4.2 Acquisition
The following approach was taken (see figure 5):
• Improve georeferencing precision by placing
UAV in high altitude, that enables a large number
of satellites synchronization.
• Start object capture drawing a curved path, cover-
ing elevation ranges.
• Repeat previous steps changing sensor angle.
Our method combines elements from Murtiyoso et
al, who established perpendicular flight succeeded by
four others, changing sensor angulation in 45
◦
(bot-
tom, up, left and right) (Murtiyoso et al., 2016). Point
clouds created using curve path instead of straight
lines provides higher angle covering resulting in pre-
cise models.
The equipment used was Inspire 2 of DJI equipped
with noise reduction camera Zenmuse X4S with
8.8mm/F2.8−11 field of view 84
◦
, 20MP 11.6 Stops
resolution and 3-Axis Gimbal.
In facade acquirement, 369 photos were taken and
used to create a point cloud adopting proprietary soft-
ware (Pix4D, AutoDesk Recap, and AutoDesk Re-
make). A better outcome was shown by Pix4D, offer-
ing performance and unlimited input images. Specif-
ically, 368 images were used (only one of then have
was eliminated during software calibration), creating
a point cloud containing 106 million densified 3D
points with 14.286,2 average density per m
3
.
4.3 Preprocessing
In the sequence, we list the preprocessing tasks used
in this work.
Figure 5: Flight examples with sensor angular adjustment.
Perpendicular and oblique highlights.
• Parameterized Cut: It is possible to define a spe-
cific area, the target area, and excluding some
regions of the point cloud (Alvarado, 2015),
(Janssen, 2017). We define a limited volume in
the point cloud and consider only the points in-
side it.
• Downsizing: We define a set of cubes as voxels
representing the 3D space. For all points inside
a voxel, it is considered only one, the central el-
ement (Moravec, 1996), as representative of the
point cloud. The goal is decreasing the high num-
ber of points and the density of the point cloud
(Wang et al., 2015).
Noise Filtering: The scanning process using a
UAV usually include incorrect points, generat-
ing data deformation (Mitra and Nguyen, 2003).
An intuitive way to interpret points classifieds as
noise is like outliers. In this work, we apply
an outliers filtering technique proposed in (Rusu
et al., 2008), based on the average and standard
deviation in the neighborhood of a point, accord-
Intelligent Digital Built Heritage Models: An Approach from Image Processing and Building Information Modelling Technology
561
ing to the Equation 1.
P
∗
= {p
∗
q
∈ P | (µ
k
− α · σ
k
) ≤ d ≤ (µ
k
+ α · σ
k
)}
(1)
where P
∗
represents all points in the point cloud;
p
∗
is a subset in the neighborhood q; µ and σ are
the mean and standard deviation on radius k.
4.4 Segmentation
Region growing algorithm initially developed for
shape classification in images (Besl and Jain, 1988),
divides point cloud into related subsets separated by
surface changing (Rabbani et al., 2006).
Simplified algorithm (Rusu et al., 2008) is de-
scribed in following steps:
• Let p
q
be any point belonging to a set of points
P
k
= {p
k
1
, p
k
2
,..., p
k
n
}, a number of near points,
equivalent to the regional descriptors, are defined
following the equation:
|p
k
i
− p
q
|
x
≤ (1+ ε) · |q
k
− p
q
|
x
, (2)
where q
k
is the neighbor inclusion radius limited
by 1+ ε at the moment x.
• Once defined neighborhood, point correlation is
used to estimate their normal vector (angle be-
tween surface and a common point, usually sensor
position).
• Analogous, mean local curvature is calculated.
Before point operation, an evaluation on each nor-
mal vector~n is computed by:
arccos(h~n,~n
k
i) ≤ θ
th
, (3)
if the difference between ~n and ~n
k
is less than θ
th
threshold, points belong to the same region. Curva-
ture checking is used for smooth evaluating surface
likeness, also restricted by a parametric limit.
4.5 BIM Modelling
The clusters point cloud data was exported in OBJ for-
mat to be read in the BIM software. We used REVIT
(Autodesk) to model the facade, and the software con-
verts the point cloud raw formats into RCP (REVIT
native format).
Although REVIT can index the point cloud in the
Project Environment, the Revit Family Editor, where
is created parametric elements (door, windows, wall
moldings), does not support point cloud raw formats.
It was necessary to convert the clusters OBJ format
with Meshlab (open source software) into DXF for-
mat supported by REVIT Family Editor Environment.
Each BIM component was labeled using the
OminiClass element, which is primitive of RE-
VIT and later adjusting the analytical structure of
the project to the classification system proposed by
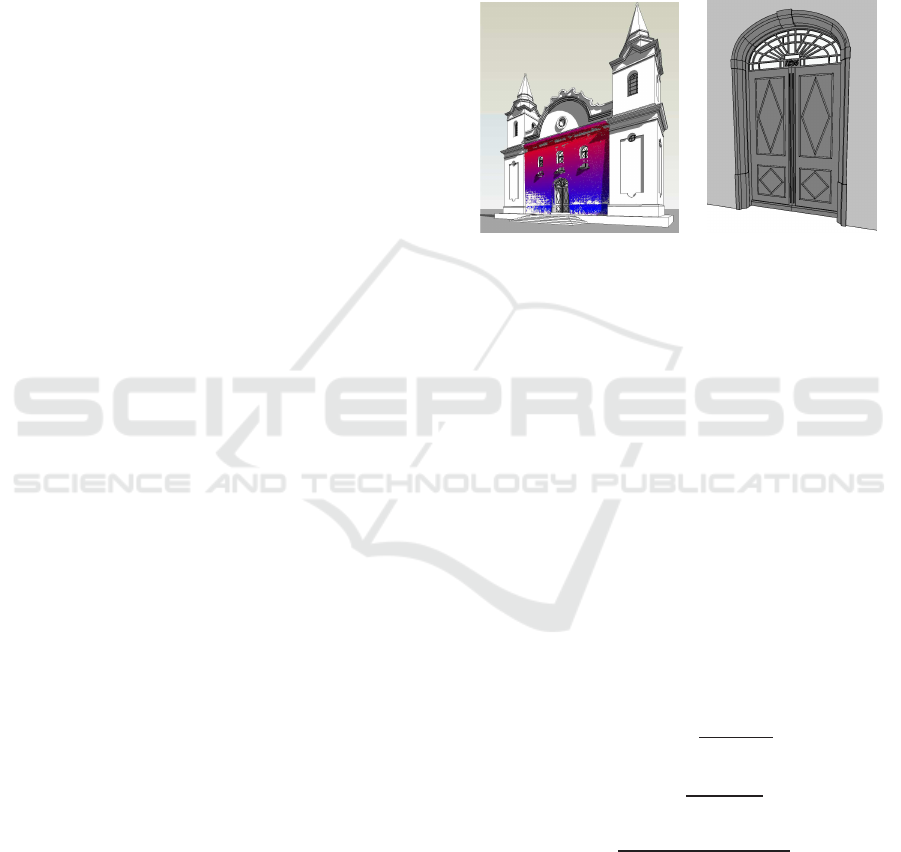
ABNT NBR 15.965 (based on OminiClass). Figure 6
depicts the final model of BMC facade with the point
cloud cluster of the frontispiece highlighted in color
(by lift), and the Family Model (parametric object) of
the Front Door.
(a) (b)
Figure 6: BIM models of BMC shows [a] facade and [b]
main door.
4.6 Evaluation
We evaluate the clusters obtained in the segmentation
step then assess the point acquisition by comparing
the spatial coordinates of control points. Firstly, we
carry out the qualitative evaluation through precision,
recall and accuracy metrics computation. This task
considers segmented and as-designed images. Sec-
ondly, we define control points over the as-designed
document and compare its spatial coordinates (or the
difference) among those in the point cloud and mea-
sured by a Total Station.
We use the accuracy metric, which is calculated
about the as-designed model. Accuracy, denoted by
A, is calculated according to the Equation 6; Preci-
sion and Recall area given in Equations 4 and 5, re-
spectively (van Rijsbergen, 1979).
Precision =
TP
TP+ FP
(4)
Recall =
TP
TP+ FN
(5)
A =
TP+ TN
TP+ TN + FP+ FN
(6)
where True-Positive (TP) and True-Negative (TN) are
the pixels belonging or not to the reference and re-
sulting images, respectively; False-Positive (FP) and
False-Negative (FN) represents pixels belonging ei-
ther to the reference image or the resulting image, but
not to both. These parameters create the confusion
matrix.
VISAPP 2018 - International Conference on Computer Vision Theory and Applications
562
5 EXPERIMENTS AND RESULTS
In this section, we first introduce the dataset, the
results of the proposed approach and method limita-
tions.
Dataset. The results built upon the data acquired
from the scan of the BMC, accomplished by a UAV.
Initially, the point cloud had about 18 million points.
Point Cloud Library
1
functions were used, as well as
dedicated codes developed in Python.
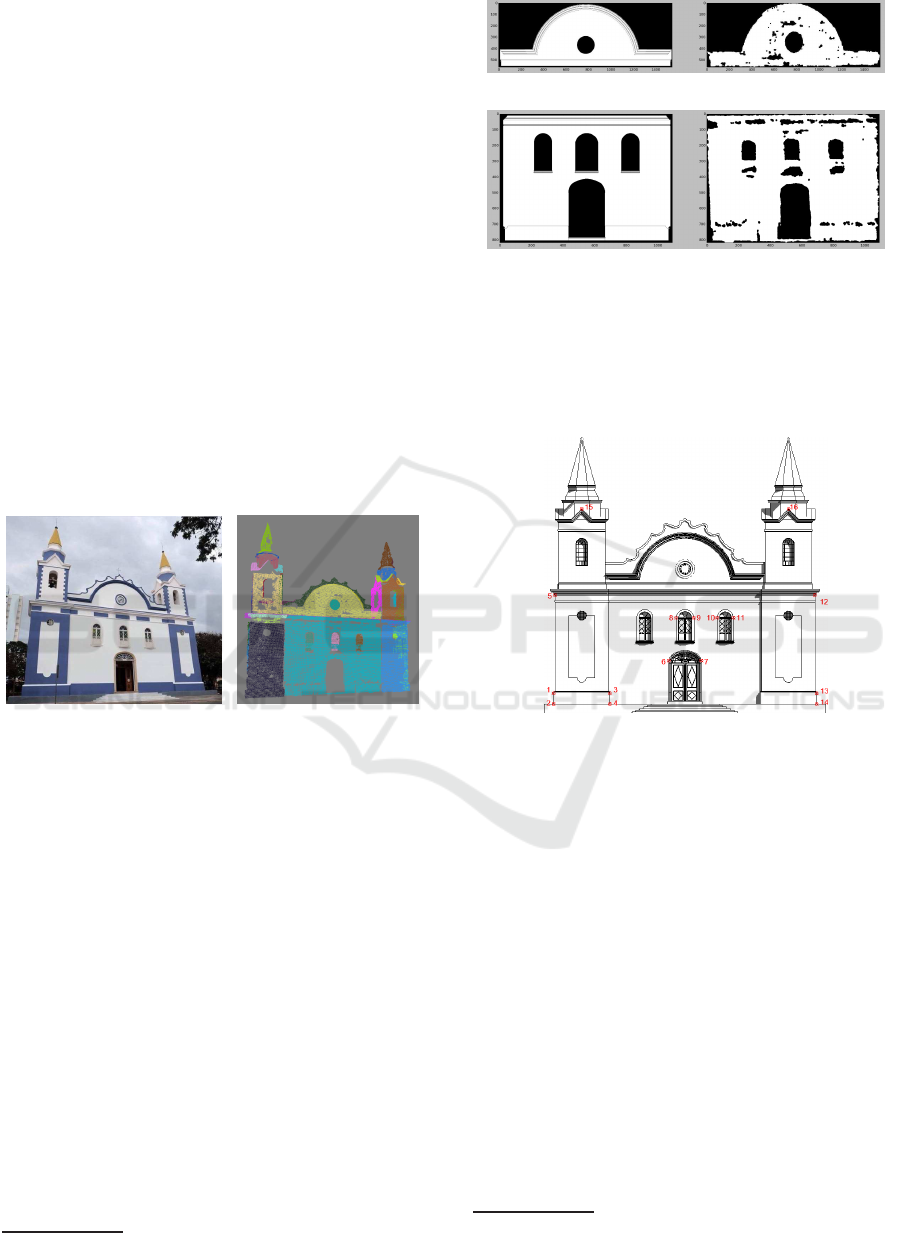
Results and Discussions. After the preprocessing
step explained in Section 4.3, the point cloud has now
about 900 thousand points. Figure 7(b) illustrates the
resulting image after the segmentation step using a
region growing algorithm. Note that it was possi-
ble to divide the original image, Figure 7(a), in dif-
ferent clusters, representing the architectural compo-
nents: this is an essential task to create a model of the
scanned image.
(a)
(b)
Figure 7: (a) Original and (b) resulting image after segmen-
tation (architectural elements represented by color).
Table 1 shows the analysis of the proposed seg-
mentation step for seven different architectural com-
ponents. The clusters resulting from the segmentation
stage are projected into 2D images before the compar-
ison. This task is accomplished utilizing orthographic
projection and density resizing reduction using mor-
phological operations (Gonzalez and Woods, 2002).
Usually, clusters are mainly flats, since the prop-
erty of the region growing algorithm uses the sur-
face curvature information of the point cloud. The
corresponding image as-designed is compared pixel-
to-pixel according to adopted metrics. Figure 8 il-
lustrates this comparison for two distinct compo-
nents, pediment, and frontispiece: on the left, the as-
designed images and, on the right, the clusters result-
ing from the proposed approach.
To check the accuracy of the acquired points by
the UAV, we define some Control Points (CP) using
1
http://pointclouds.org
(a) Pediment (tympanum and cymatium)
(b) Frontispiece voids of windows and doors
Figure 8: As-design elements vs cluster projections.
a Total Station
2
. Figure 9 shows the CP defined to
the facade of the Boa Morte Church. This CP was
comparedto the points obtained by the UAV and those
from the as-designed model.
Figure 9: Control Points (CP) definition, in red.
Table 2 shows the analysis of distance between
different control points using a Total Station and data
of the as-designed Model and point cloud. It is pos-
sible to observe the excellent performance of the ap-
proach and acquired data. The absolute deviation of
the point cloud is between +0,06 m to −0,75 m,
while for the as-designed model this range is from
−0,12 m to +1,12 m. Also, the average deviation is
−0,11m to the point cloud, or −0,04 m if we ignore
the maximum difference (control points 2 and 14).
The photographic acquisition using the UAV, and
the reconstruction employing software, provides a
high precision 3D representation of the building. Its
accuracy can be compared to others works, as re-
ported by (Bayram et al., 2015), which presented a re-
lationship among 3D laser scanning and photogram-
metric reconstruction.
DSM models made from point cloud has non-
structured features as lack of topology and semantic
2
TS650 model FOIF, angular precision 1s, linear preci-
sion 2mm+ 2p.p.m.
Intelligent Digital Built Heritage Models: An Approach from Image Processing and Building Information Modelling Technology
563
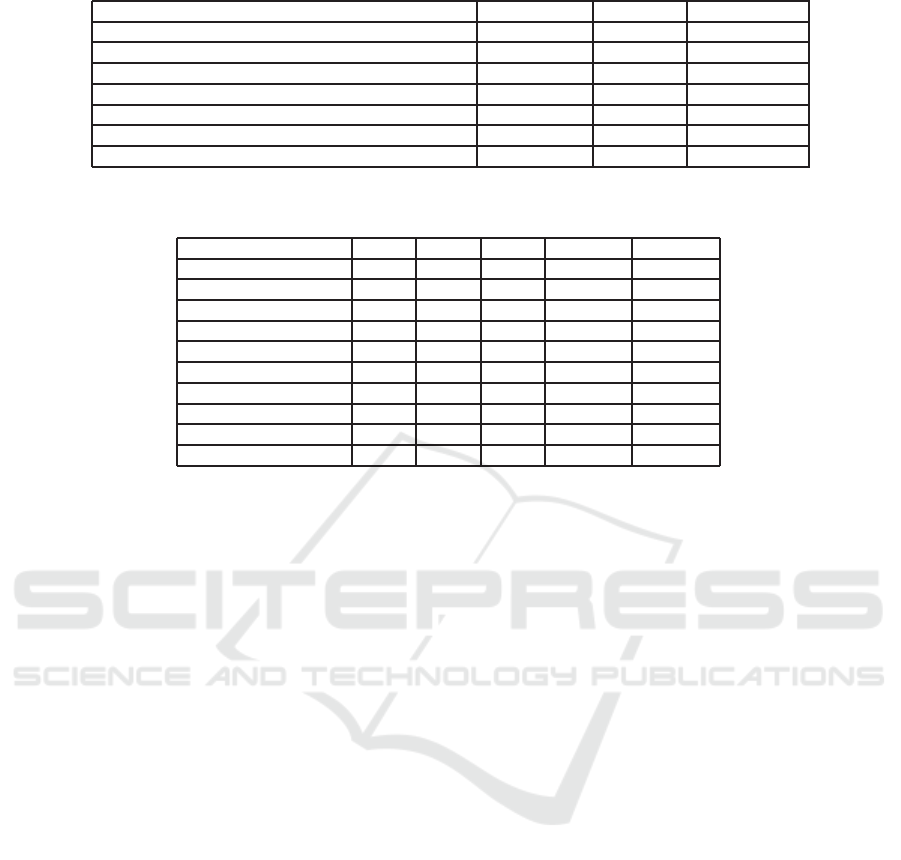
Table 1: Analysis of segmented regions compared to the as-designed model.
COMPONENTS PRECISION RECALL ACCURACY
Frontispiece with voids of windows and doorways 87,7 93,4 85,8
Tower base (right) 94,6 86,6 84,8
Tower base (left) 94,3 94,7 90,9
Right Bell Tower 85,3 89,5 83,4
Left Bell Tower 84,4 63,9 69,5
Doble pediment (tympanum and cymatium) 55,7 39,3 82,3
Scrolled pediment 96,0 87,2 91,2
Table 2: Comparison analysis of distance (in meters) between Total Station (TS), as-designed model (AD) and Point Cloud
(PC).
CONTROL POINTS TS AD PC TS− PC AD− TS
1-2 0,99 1,00 1,00 -0,01 0,01
1-3 4,69 5,20 4,88 -0,19 0,51
2-5 10,17 10,26 10,14 0,03 0,09
2-14 22,88 24,00 23,63 -0,75 1,12
6-7 3,02 3,08 3,12 -0,10 0,06
8-9 1,59 1,93 1,65 -0,06 0,34
9-10 2,09 1,97 2,15 -0,06 -0,12
10-11 1,41 1,53 1,46 -0,05 0,12
13-14 0,97 1,00 0,96 0,01 0,03
2-15 18,16 18,52 18,10 0,06 0,36
discretization. However, the IDBHM created by
BIM methodology, as we presented in this work, can
provide a reliable documentation of the building,
mainly the usual necessary information of historical
heritage.
Limitations. The primary limitation of this work re-
sides on its non-automated phase. Besides significant
time reduction on pre-processing, segmentation and
evaluation, steps as acquisition and modelling still
need laboring work. Another weak point is the use of
proprietary black-box software to create point clouds,
which increase inter-operational dependence.
6 CONCLUSIONS
Our approach is organized in six steps, as follows:(i)
capture planning; (ii) acquisition; (iii) preprocessing;
(iv) point cloud segmentation; (v) 3D semantic model
creation and (vi) evaluation.
We presented two main contributions, related to
the data acquisition protocol and the evaluation of the
image segmentation method. We proposed an evalua-
tion model based on the confusion matrix and metrics
widely used in the literature: precision, recall, and ac-
curacy. These parameters provide useful information
about the quality of resulting image obtained after the
segmentation task. The comparison is accomplished
between cluster image (segmented image from point
cloud data) and component image (from the architec-
tural project). Another relevant contribution was the
validation step proposed in this work. This task com-
pares points acquired by the UAV with those obtained
by a Total Station and the container in the as-designed
model.
The results obtained indicates a satisfactory per-
formance of the cluster segmentation step, according
to precision, recall and accuracy metrics. However,
the values of these metrics are influenced by the ex-
istence of small holes in the clusters generated due
to data acquisition failures. Also, we are investigat-
ing whether the projection technique used in the com-
parison as-designed model vs cluster projection could
decrease the quantitative analysis performance.
In future work, we would like to improve the data
acquisition process, defining a UAV flight protocol.
This protocol must provide a comprehensive angular
point range and high overlap rate. Besides, we also
intend to implement and test different image segmen-
tation techniques, to obtain information-rich clusters
useful for further pattern recognition steps.
ACKNOWLEDGEMENTS
This work was supported by S˜ao Paulo Research
Foundation (FAPESP), grant 2016/04991 − 0 and
2017/02787−9. We acknowledge Prof. Mauro Men-
zori and Prof. Vitor E. Molina Jr. by their collabora-
tion with Total Station equipment. Special thank for
Prof. Vitor R. Coluci for his advices. We also thank
our reviewers for their helpful comments.
VISAPP 2018 - International Conference on Computer Vision Theory and Applications
564

REFERENCES
Alvarado, R. G. (2015). Bim + uav assessment of roofs’ so-
lar potential. In Proceedings of the 19th Conference of
the Iberoamerican Society of Digital Graphics - SIB-
GRADI. SCITEPRESS.
Bayram, B., Nemli, G., Ozkan, T., Oflaz, O. E., Kankotan,
B., and Cetin, I. (2015). Comparison of laser scanning
and photogrammetry and their use for digital record-
ing of cultural monument case study: Byzantine land
walls-istanbul. In ISPRS Annals of Photogramme-
try, Remote Sensing and Spatial Information Sciences,
pages 17–24.
Besl, P. J. and Jain, R. C. (1988). Segmentation
through variable-order surface fitting. IEEE Transac-
tions on Pattern Analysis and Machine Intelligence,
10(2):167–192.
Bhatla, A., Choe, S. Y., Fierro, O., and Leite, F. (2012).
Evaluation of accuracy of as-built 3d modeling from
photos taken by handheld digital cameras. Automation
in construction, 28:116–127.
Brilakis, I., Lourakis, M., Sacks, R., Savarese, S.,
Christodoulou, S., Teizer, J., and Makhmalbaf, A.
(2010). Toward automated generation of parametric
bims based on hybrid video and laser scanning data.
Advanced Engineering Informatics, 24(4):456–465.
De Berg, M., Cheong, O., Van Kreveld, M., and Overmars,
M. (2008). Computational Geometry: Introduction.
Springer.
Dezen-Kempter, E., Soibelman, L., Chen, M., and
M¨uller Filho, A. V. (2015). Escaneamento 3d a
laser, fotogrametria e modelagem da informac¸˜ao da
construc¸˜ao para gest˜ao e operac¸˜ao de edificac¸ ˜oes
hist´oricas. Gest˜ao & Tecnologia de Projetos,
10(2):113–124.
Dore, C. and Murphy, M. (2014). Semi-automatic genera-
tion of as-built bim fac¸ade geometry from laser and
image data. Journal of Information Technology in
Construction (ITcon), 19(2):20–46.
Fai, S., Graham, K., Duckworth, T., Wood, N., and Attar,
R. (2011). Building information modelling and her-
itage documentation. In Proceedings of the 23rd Inter-
national Symposium, International Scientific Commit-
tee for Documentation of Cultural Heritage (CIPA),
Prague, Czech Republic, pages 12–16.
Fischler, M. A. and Bolles, R. C. (1981). Random sample
consensus: a paradigm for model fitting with appli-
cations to image analysis and automated cartography.
Communications of the ACM, 24(6):381–395.
Gonzalez, R. and Woods, R. (2002). Digital Image Process-
ing. Prentice Hall.
Janssen, P. L. (2017). Construction site monitoring using
uav oblique photogrammetry and bim technologies. In
Proc. of the 22nd CAADRIA Conference, pages 665–
662.
Jung, J., Hong, S., Jeong, S., Kim, S., Cho, H., Hong, S.,
and Heo, J. (2014). Productive modeling for devel-
opment of as-built bim of existing indoor structures.
Automation in Construction, 42:68–77.
Lu, Q. and Lee, S. (2017). Image-based technologies for
constructing as-is building information models for ex-
isting buildings. Journal of Computing in Civil Engi-
neering, 31(4):04017005.
Manferdini, A. and Remondino, F. (2012). A review of
reality-based 3d model generation, segmentation and
web-based visualization methods. International Jour-
nal of Heritage in the Digital Era, 1(1):103–123.
Mitra, N. J. and Nguyen, A. (2003). Estimating surface
normals in noisy point cloud data. In Proceedings of
the nineteenth annual symposium on Computational
geometry, pages 322–328. ACM.
Moravec, H. (1996). Robot spatial perceptionby stereo-
scopic vision and 3d evidence grids. Perception.
Murtiyoso, A., Grussenmeyer, P., Koehl, M., and Freville,
T. (2016). Acquisition and processing experiences of
close range uav images for the 3d modeling of heritage
buildings. In Euro-Mediterranean Conference, pages
420–431. Springer.
Nex, F. and Remondino, F. (2014). Uav for 3d mapping
applications: a review. Applied Geomatics, 6(1):1–15.
Nguyen, A. and Le, B. (2013). 3d point cloud segmenta-
tion: A survey. In Robotics, Automation and Mecha-
tronics (RAM), 2013 6th IEEE Conference on, pages
225–230. IEEE.
Penttil¨a, H., Rajala, M., and Freese, S. (2007). Build-
ing information modelling of modern historic build-
ings. Predicting the Future, 25th eCAADe Konferansı,
Frankfurt am Main, Germany, pages 607–613.
Rabbani, T., Van Den Heuvel, F., and Vosselmann, G.
(2006). Segmentation of point clouds using smooth-
ness constraint. International archives of photogram-
metry, remote sensing and spatial information sci-
ences, 36(5):248–253.
Rusu, R. B., Marton, Z. C., Blodow, N., Dolha, M., and
Beetz, M. (2008). Towards 3d point cloud based ob-
ject maps for household environments. Robotics and
Autonomous Systems, 56(11):927–941.
Savarese, S. and Fei-Fei, L. (2007). 3d generic object cate-
gorization, localization and pose estimation. In Com-
puter Vision, 2007. ICCV 2007. IEEE 11th Interna-
tional Conference on, pages 1–8. IEEE.
van Rijsbergen, C. (1979). Information retrieval.
Wang, C., Cho, Y. K., and Kim, C. (2015). Automatic bim
component extraction from point clouds of existing
buildings for sustainability applications. Automation
in Construction, 56:1–13.
Intelligent Digital Built Heritage Models: An Approach from Image Processing and Building Information Modelling Technology
565
