
Annotations as a Support for Knowledge Generation
Supporting Visual Analytics in the Field of Ophthalmology
Christoph Schmidt, Paul Rosenthal and Heidrun Schumann
Institute of Computer Science, University of Rostock, Einsteinstrasse, Rostock, Germany
Keywords:
Annotation, Knowledge Generation Model.
Abstract:
While visual analytics (VA) supports the appraisal of large data amounts, annotations support the amendment
of additional information to the VA system. Despite the fact that annotations have occasionally been used to
facilitate the analysis, a thorough investigation of annotations themselves is challenging. Although they can
represent a suitable way to transfer additional information into the visualization system, there is the need to
characterize annotations in order to assure an appropriate use. With our paper we provide a characteristic
for annotations, revealing and depicting key issues for the use of annotations. By supplementary fitting our
characteristic into the knowledge generation model from Sacha et al. (2014), we provide a systematic view
on annotations. We show the general applicability of our characteristic of annotations with a visual analytics
approach on medical data in the field of ophthalmology.
1 MOTIVATION AND GENERAL
APPROACH
While the science of visual analytics is well estab-
lished, the use of annotations in that context is hardly
considered. Visual analytics reveals answers hidden
in mounts of data and annotations represent the pos-
sibility to integrate additional information to that data
into the analysis. The use of annotations is upcoming
and increasing in the VA community, yet a thorough
analysis is challenging.
With this paper we show that annotations are ben-
eficial, presupposing a thorough analysis. We unfold
different purposes of annotations and different ways,
annotations can be gathered, so that they are available
for further processing and visualization. As a result
we develop a morphological box, portraying the in-
terplay of annotation characteristics. For suitable use
in the VA context, we discuss the integration of an-
notations into the knowledge generation model from
((Sacha et al., 2014)). Additionally we depict obsta-
cles which accompany the use of annotations. This
particularly concerns the visualization of annotations
with different certainty levels.
For evaluation we project our characterization on
a VA approach, annotating optical coherence tomog-
raphy (OCT) image data with the patients supplemen-
tary data, giving users the option to enrich, judge, and
comment. We experience that the need to (i) anno-
tate the data, (ii) comment findings and insights or
(iii) annotate the work of collaborators is generally
present during a visual analysis. Surveying literature
emphasizes that postulation, as the use of annotations
is seen as critical for the visual analytic process (Heer
and Shneiderman, 2012), (Zhao et al., 2017).
However, there are problems to be solved, both
regarding the data, as well as the purpose of annota-
tions. Concerning the former, we observed that the
collected data is unstructured, often incomplete, and
sometimes vague and dependent on the interpretation
of domain experts. Concerning the latter, an annota-
tion may well support the knowledge generation. Yet,
used carelessly, annotations may distort the user’s per-
ception or even amend the data with incorrect infor-
mation leading to insecure visual analytic outcome.
In Chapter 2 we provide an annotation character-
istics, which we integrate into the knowledge genera-
tion model in Chapter 3. The theoretical basis is eval-
uated in Chapter 4 with a use case in the field of oph-
thalmology. Chapter 5 rounds out the paper with a
conclusion and a view on the future work.
2 CHARACTERIZING
ANNOTATIONS
The term ”annotation” is frequently used in literature,
yet it is challenging to find a definition or explanatory
introduction. There is one definition by (Alm et al.,
2015), who declare them as objects (e.g. text snippets,
264
Schmidt, C., Rosenthal, P. and Schumann, H.
Annotations as a Support for Knowledge Generation - Supporting Visual Analytics in the Field of Ophthalmology.
DOI: 10.5220/0006615902640272
In Proceedings of the 13th International Joint Conference on Computer Vision, Imaging and Computer Graphics Theory and Applications (VISIGRAPP 2018) - Volume 3: IVAPP, pages
264-272
ISBN: 978-989-758-289-9
Copyright © 2018 by SCITEPRESS – Science and Technology Publications, Lda. All rights reserved

photos) containing additional information about a re-
lated entity. Most other usages share a similar seman-
tic meaning as the Oxford English Dictionary, which
gives two none-obsolete definitions: (i) ”The action of
annotating or making notes”, and (ii) ”A note added
to anything written, by way of explanation or com-
ment”. So, we understand them as notes of any form
added to the data.
The following descriptions are guided by that per-
spective and relate to several research questions.
2.1 What Are Annotations?
Figure 1: An example of annotations in the linguistic do-
main. Annotations are shown above the sentence elements.
One of the fundamental tasks in our context is to gen-
erally identify different kinds of annotations. Exam-
ining literature several examples can be found in dif-
ferent research communities.
The linguistic community either manually or au-
tomatically mark sub-parts of texts (which are graph-
ical items) to divide sentences into sequences and sin-
gle terms, as shown in Figure 1. In that context anno-
tations are understood as additional textual informa-
tion (categories from a list) on the type of linguistic
term used (Fromont, 2017). According to Roser Saur
´
ı
(Saur
´
ı, 2017) the challenge here lays in the adequate
design of an annotation scheme that is capable of rep-
resenting all aspects found in texts the scheme will be
applied on.
As a contrast (Willett et al., 2011) see annotations
as free text comments added by users. They provide
an application where users can add comments loosely
related to visualized data. The comments can be cat-
egorized and may refer to each other, even including
screenshots of the data. Yet the semantics of the com-
ments can only be interpreted by humans.
Recording user comments is also a feature of
sense.us (Heer et al., 2007), a collaborative visualiza-
tion system, which additionally provides functions to
generate graphical annotations like arrows, squares,
lines, and circles. Within the tool VisTrails (Callahan
et al., 2006) another form of annotations can be found.
The application has the ability to capture the prove-
nance of both data and visualization process, which
can be seen as an amendment to the visualized data.
2.2 Why Do We Annotate?
To round out the annotation definition, we hereinafter
provide reasons why researchers use annotations in
their work. Surveying existing literature we identified
the following three main purposes why researchers in-
tegrated annotations into their work:
Annotate Data Information. We consider any
amendment of information concerning the collected
data for a visual analysis a data annotation. One
prominent example is the communication of class la-
bels, as this is a major task in visual analytics. Class
labels are used for different purposes, such as divid-
ing the data either in subsequences (Fromont, 2017)
or training a machine learning algorithm to classify
images and assign the respective labels (Chang et al.,
2003).
A more implicit way to annotate data information
is supported by reCaptcha. While first CAPTCHAs
(Completely Automated Public Turing test to tell
Computers and Humans Apart) only had the pur-
pose to prevent massive bot abuse on websites, re-
CAPTCHA is nowadays used to include internet users
in annotating images (von Ahn et al., 2008). Even to-
day machine learning algorithms cannot outperform
human perception and pattern recognition, so that re-
CAPTCHA uses humans to manually annotate large
amounts of images with complicated patterns.
Supplementary to classification purposes the iden-
tification and marking of special features like peaks,
vertices or thresholds in a visualization is of high im-
portance, too. (Heer et al., 2007) imply that the use of
additional markings can facilitate the analytic process
and understanding.
Annotate User Information. Whenever a visual
analysis is characterized by the need to somehow pre-
serve the volatile knowledge generated by the domain
expert, the note taking or annotating process can con-
veniently fulfill this task (Willett et al., 2011). (Zhao
et al., 2017) as well as (Heer and Shneiderman, 2012)
even show that taking notes during the visual analytic
process can be critical for successive use.
Another reason to annotate user information is for
communication. (Groth and Streefkerk, 2006) as well
as (Willett et al., 2011) support these types of user
amendments in order to allow questions and answers
by different users. By that the complicated harmo-
nization of visual interpretation, and the knowledge
generation can be supported.
Documenting the provenance of the visual ana-
lytic processes, adding again user information, is sup-
ported by VisTrails. The application from (Callahan
et al., 2006) has the ability to capture the provenance
of both data and analysis work flow.
Annotations as a Support for Knowledge Generation - Supporting Visual Analytics in the Field of Ophthalmology
265

Table 1: A morphological box, showing the different characterizations of annotations. For an annotation problem the box can
be used to identify suitable combinations of annotation properties. Further details can be found in Chapter 3.
What are annotations?
Category Free Text Graphical Item Provenance
Information
Why do we annotate?
Annotate Data
Information
Annotate User
Information
Annotate Outcome
Information
How to gather annotations?
Alpha-
numerical
Input
Screenshot Mark Selection
and
Brushing
Automatic
Computa-
tion
How to visualize annotations?
Visual Separation Layered Visualization Visual Encoding
Annotate Outcome Information. (Mahyar et al.,
2012) show that externalization of insights, findings
and hypotheses plays a critical role in the visual an-
alytic process. Recording these findings and insights
as annotations adds information on the outcome of a
visual analytic approach, which substantially facili-
tates the major goal of generating new and persistent
knowledge.
Working with these annotations is another reason
why outcome information is collected. It is the at-
tempt to analyze the annotations themselves in order
to generate a better understanding. That has been per-
formed by (Zhao et al., 2017), who put user authored
annotations in the center of their research. They de-
veloped a graph visualization for annotations, giving
the user the possibility to order, analyze, connect and
share previously derived annotations. They show that
a graph-based visualization for annotations can effec-
tively support meta-analyses for discovery and orga-
nization of user ideas.
Following this classification, different require-
ments concerning the gathering of annotations arise.
While classifications generally require distinct classes
individually identified; communication is mainly per-
formed between users, who have their own interpreta-
tion on the annotation. Further details on these issues
will be discussed hereafter.
2.3 How Can We Gather Annotations?
For a suitable annotation gathering two categories ap-
ply: (i) direct entering by the user (Heer and Shneider-
man, 2012) or (ii) automatic deriving by the computer
e.g., (M and Wilson, 2015).
Exemplary for the former category (i) can be
a simple selection of an image as done via re-
CAPTCHA (von Ahn et al., 2008), or complex ac-
tions as creating a forum entry, classifying it and link-
ing it to a visualization and other entries (Willett et al.,
2011). Having a closer look on CommentSpace, a tool
from (Willett et al., 2011), three forms of annotation
gathering appear. First there is the use of alphanu-
merical input by creating a user entry in a forum. Sec-
ondly, this forum entry can be categorized by the user.
Thirdly, a screenshot can be taken and attached to the
forum entry. Allowing user comments is also a feature
of sense.us (Heer et al., 2007), a collaborative visual-
ization system, which additionally features graphical
items, like arrows, squares, lines, and circles.
The latter category (ii), deriving automatic anno-
tations (automatic computations), can for instance be
already provided during data collection. That specif-
ically includes device parameters that hold informa-
tion on the data ascertaining circumstances. Similar
to device parameters are facts surrounding the data
collection. That embraces the location and time of
collection, as well as the responsible collector. In ad-
dition classifications can be automatically derived as
described by (Chang et al., 2003). While their ma-
chine learning algorithm needs manual annotations
for a training set, it later is capable of providing auto-
matic annotations for new pictures, by giving classifi-
cation information.
2.4 How Can We Visualize
Annotations?
Visualizing annotations implies the communication of
information to the user that has not been part of the
data. (Willett et al., 2011) found a solution by draw-
ing a clear line of visual separation on the screen.
They present annotations on the left and data visu-
alization on the right side of the display.
Another way of annotation visualization is to
show the annotations as an extra layer on the data,
as (Groth and Streefkerk, 2006) have done (layered
visualization).
The combination of both can be found in the
sense.us system from (Heer et al., 2007), who show
the marks from users directly on the data and have
an additional comment section on the upper right of
the screen. By bookmarking the stage of visualiza-
tion including the annotations, they even preserve it
for later use. Nevertheless, applying annotations di-
rectly on the data without clear separation hints, other
IVAPP 2018 - International Conference on Information Visualization Theory and Applications
266
users may experience difficulties to differentiate be-
tween actual data and annotations.
As (Chang et al., 2003) have the goal to classify
images through machine learning algorithms. They
indirectly communicate their automatically retrieved
annotations through the derived image classes.
A more direct form of visualization is visual en-
coding. By that, annotations are directly visualized
within the data view, as (R
¨
ohlig et al., 2016) have
done. They integrated the annotated location of their
data collection, showing that there is an influence on
the data.
2.5 Summary
To structure and organize the previous investigations,
we developed a morphological system as shown in ta-
ble 1. It comprising a variety of rational combina-
tions for annotation characteristics. By that, we order
the properties concerning the types, purposes, gather-
ing, and visualizing annotations, allowing to combine
them independently.
This thorough analysis enables a determined ap-
proach to (i) sort annotations into the knowledge gen-
eration model and to (ii) successfully apply annota-
tions to OCT-data and supplementary patient infor-
mation. Concerning the former, we use the morpho-
logical box to assign annotations with certain char-
acteristics to each phase of the knowledge generation
model. The latter approach will determine suitable
annotations for the analysis of the OCT and patient
data combination. Contemplating these two issues is
the core of the following chapters 3 and 4.
3 ANNOTATIONS IN THE
KNOWLEDGE GENERATION
MODEL
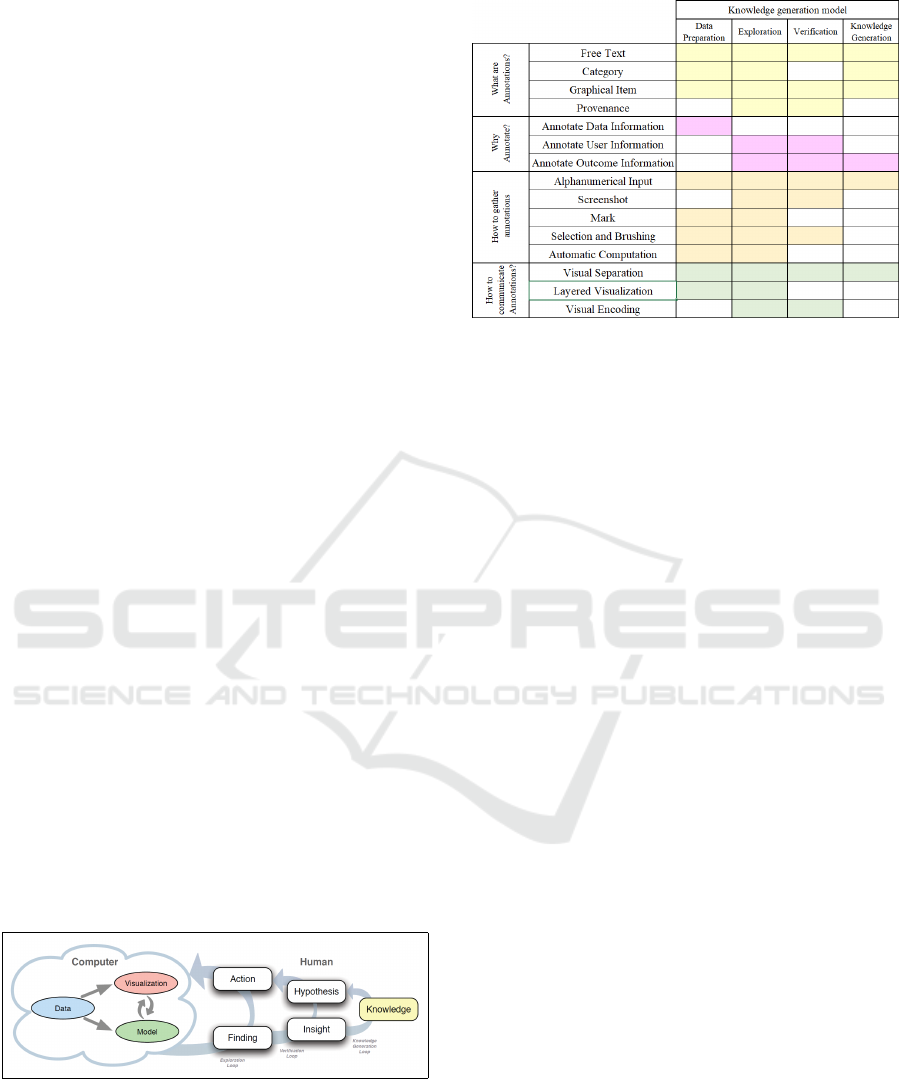
Figure 2: Knowledge generation model from (Sacha et al.,
2014).
In this chapter we depict the possibility to integrate
annotations into the individual phases.
The knowledge generation model consists of sev-
eral loops, representing the different phases of the vi-
sual analytic process as shown in Figure 2. They com-
Figure 3: The table shows suitable annotation characteris-
tics for the respective phase in the knowledge generation
model.
bine the human and computer parts in the process,
beginning with the data preparation, which influences
the model building and visualization steps. During the
exploration loop the user can change the visualization
and the model in several iteration steps, to facilitate
the generation of findings. Subsequently the verifi-
cation loop follows, allowing hypothesis building and
verifying through the gaining of insights which even-
tually will result in additional knowledge within the
expert’s mind. For details on the knowledge genera-
tion model, see (Sacha et al., 2014).
3.1 Data Preparation
In the first step, the raw data undergoes a preparation
process, so that structure and type of the data fits the
visualization properly. One of the main challenges
is to ensure the completeness and correctness of the
data in order to generate a functional data model for
the analysis.
What kind of annotations: Inspecting the data will
demand users to create comments on certain data
ranges, or to mark and categorize data, to create
distinct dimensions or to allow visual analytics
specialists to comprehend the data intension and/or
structure. To support the understanding, free text
comments and graphical items like highlights or
color coding are useful. The structuring of the data
can be performed through categorization.
Why annotate: Laboring with data in the data prepa-
ration phase will evidently add data information,
which is the main purpose of annotation in this phase.
To give an example, domain expert can identify parts
of the data that seem to be important on the first
Annotations as a Support for Knowledge Generation - Supporting Visual Analytics in the Field of Ophthalmology
267

sight because of a distinct structure. Annotating
these data would signify interesting parts for further
investigations.
How to gather annotations: Gathering annotations
can consist of the possibility to select data ranges and
to categorize them. By that, the user provides a con-
venient structure for the data. Alphanumerical input
is mainly used, to ascertain explaining information
on the data. Another suitable solution is to use au-
tomatic computation. That can be the gathering of
system parameters, like time stamps or hardware pa-
rameters that facilitate the structuring and judgment
of the data. These parameters may have direct in-
fluence on a later performed classification, as seen in
(R
¨
ohlig et al., 2016).
To solely collect the content of an annotation may
lead to misinterpretation or questions by the user. To
avoid these, the recording of the author, as well as
the date and time for an annotation is useful. Having
the author of an annotation will ensure that users
can communicate and discuss their actions on the
data, finding a common solution, which can then be
expressed by additional or corrective annotations.
How to visualize annotations: To ensure that the
data and the annotations can easily be distinguished,
visual separation is a suitable method. Especially the
use of free text comments should be visualized sepa-
rately. To still allow the correct association with the
commented data range, a link, visualized through an
extra layer on the data view can be used.
Layered visualization also applies to categorizing
annotations. They can be applied on top of the data
ranges to be categorized, so that the new structure can
be seen, while the original data remains unchanged.
3.2 Exploration Loop
Based on well-prepared data, annotations apply
their full potential, during the exploration loop.
Explorations are characterized by iterative, semi-
coordinated, and often intuitive actions from users
following hints and glimpses to extract valuable find-
ings from the data. To facilitate that process it is cru-
cial to preserve promising ideas, paths and hints, a
support that we provide through annotations.
Consequently we recommend almost all types
of annotations during this phase, assuring that the
certainty level as well as date, time and author are
also recorded.
What kind of annotations: To fully support users,
all kinds of annotations are useful during this phase.
Free text enables comments on findings and com-
munication with others. Categorizing the data can
represent hints on dependencies within the data.
Similar to that is the use of graphical items, as they
can point out interesting facts or findings in the
visualization. Recording the path of the exploration
consequently completes the annotation possibilities.
Why annotate: The purpose of annotations here is
either to integrate user information into the visual-
ization for data examination or communication with
others, or the expression of findings, discovered dur-
ing the exploration process. Generally no information
on data is expected here, as this should be completed
during data preparation phase.
How to gather annotations: Due to the fact that
all kinds of annotations are possible, the are also
multiple ways they can be collected. Categorizing,
selecting, and marking facilitate the data structuring
and analyzing process, leading to findings, which can
be either conserved through screenshots, automated
provenance recording, or verbalization via alphanu-
merical input.
How to visualize annotations: For a suitable visual-
ization in this phase the certainty level is important to
know, yet not necessarily important to be high. If the
awareness for uncertainty is given users can still avoid
mistakes, as (Sacha et al., 2017) have shown. Some of
the highly certain annotations may become part of the
findings or generally represent findings themselves.
For these cases it might be suitable to integrate the
annotations into the data-space to bring them directly
into the visualization via visual encoding. That will
allow all standard methods of the exploration loop on
them. To avoid misleading interpretation it has to be
assured that visual encoding will only be applied with
annotations granting a high certainty value.
For low certainty annotations the visual separation
is a better solution. The user perceives a clear border
between the data and the annotations and, if the cer-
tainty value is given, is also made aware.
Layered visualization is a good solution for graph-
ical items that point directly to interesting features in
the data. Although these graphical items are shown in
the same view as the data, the extra layer establishes
the necessary distance and allows removal, if neces-
sary.
3.3 Verification Loop
In contrast to the exploration the loop, the verifica-
tion loop has the purpose, to increase truthfulness of
IVAPP 2018 - International Conference on Information Visualization Theory and Applications
268

hypotheses built and therefore needs and produces
highly certain information. This may also include
findings that decline a hypothesis.
The integration of annotations at this stage re-
quires some precautions as only verified annotations
can emphasize the outcome. Respecting these cir-
cumstances, we selected the following characteristics:
What kind of annotations: To allow users to perma-
nently store their verifications free text entries hold
true. Nevertheless, it is important to record the cer-
tainty value for these annotations and/or enable con-
firmation or reject by other users. If this is not done,
the free text comments cannot be used for verification.
Graphical items may be used to validate, or
highlight findings that have been annotated during the
exploration loop. Combining them with provenance
information allows reproducibility. Provenance steps
can be marked to show the evolving process for
findings or hypotheses.
Why annotate: The major share of the annotations
during the verification phase will be for user and
outcome information. They provide the judgement
of the user if a certain finding is valuable and proves
or disproves an established hypothesis. The user
examines the exploration process and verifies if the
findings can generate insights. Adding annotations
will be for the purpose of commenting, judging and
validating that process.
How to gather annotations: As the verification
phase follows the exploration phase many annotations
are already available at this point. Therefore the main
task is to validate, amend, and possibly disapprove
the exploration outcome. A functional way to achieve
these tasks is the selection and categorization of
these findings. In completion, the amendment of
texts via alphanumerical input or the inclusion of
screenshots is possible to reason the selection process.
How to visualize annotations: For the purpose of
provenance visualization, visual separation is appli-
cable, to clearly differentiate between the current vi-
sualization and the recorded path of exploration. A
possible realization is the creation of a new view with
the provenance information.
For hypotheses that emerge from previous classi-
fications during the exploration loop, the integration
into existing views can be of use. Applying a classi-
fication directly into the data via visual encoding can
confirm or reject a valid data separation.
3.4 Knowledge Generation Loop
The knowledge generation loop concludes the visual
analysis. That implies that the validated and verified
facts and findings have all been created and linked
to the data. Following now is the connection of
these findings with the user knowledge, so that valid
hypotheses emerge and new knowledge (following
the definition for knowledge from (Sacha et al.,
2014)) is created. Annotations at this point ensure
that the necessary creativity can be made transparent
and permanent in the system.
What kind of annotations: In accordance with the
task all kinds of annotations that accompany the
outflow of knowledge from the human brain into
the computer are appropriate. Free text supports an
unfiltered canal from the user to the system. Graph-
ical items enable the linking to specific hypotheses
or insights found. To somewhat relieve free text
annotations from the lack of systematic appraisal
possibilities, categorizing the text can be adjuvant.
Why annotate: Annotations for knowledge genera-
tion have mainly the purpose to provide information
on the outcome of the visual analysis. They support
the interplay between the user knowledge and the
newly derived findings to generate insights and to
validate hypotheses. If that process, which originally
is captured within the human mind, can be external-
ized, the outcome of the visual analysis is transparent
and permanently available.
How to gather annotations: Suitable ways to gather
annotations during the knowledge generation loop
are fitting methods that accompany the discussion
within and between domain experts. That is best
achieved by annotations from alphanumerical input
with mutual references, which open the possibility
to externalize the knowledge of the experts including
the persistent availability of the discussion between
them. Categorizing them supports the need to
rank the annotations, regarding their certainty and
contribution to the knowledge generation.
How to visualize annotations: As the knowledge
generation loop normally produces annotations on a
higher level then the data and previous annotations,
they should be visualized as a separate view. Ranking
the knowledge annotations within the view can sup-
port the structuring of the outcome.
Annotations as a Support for Knowledge Generation - Supporting Visual Analytics in the Field of Ophthalmology
269
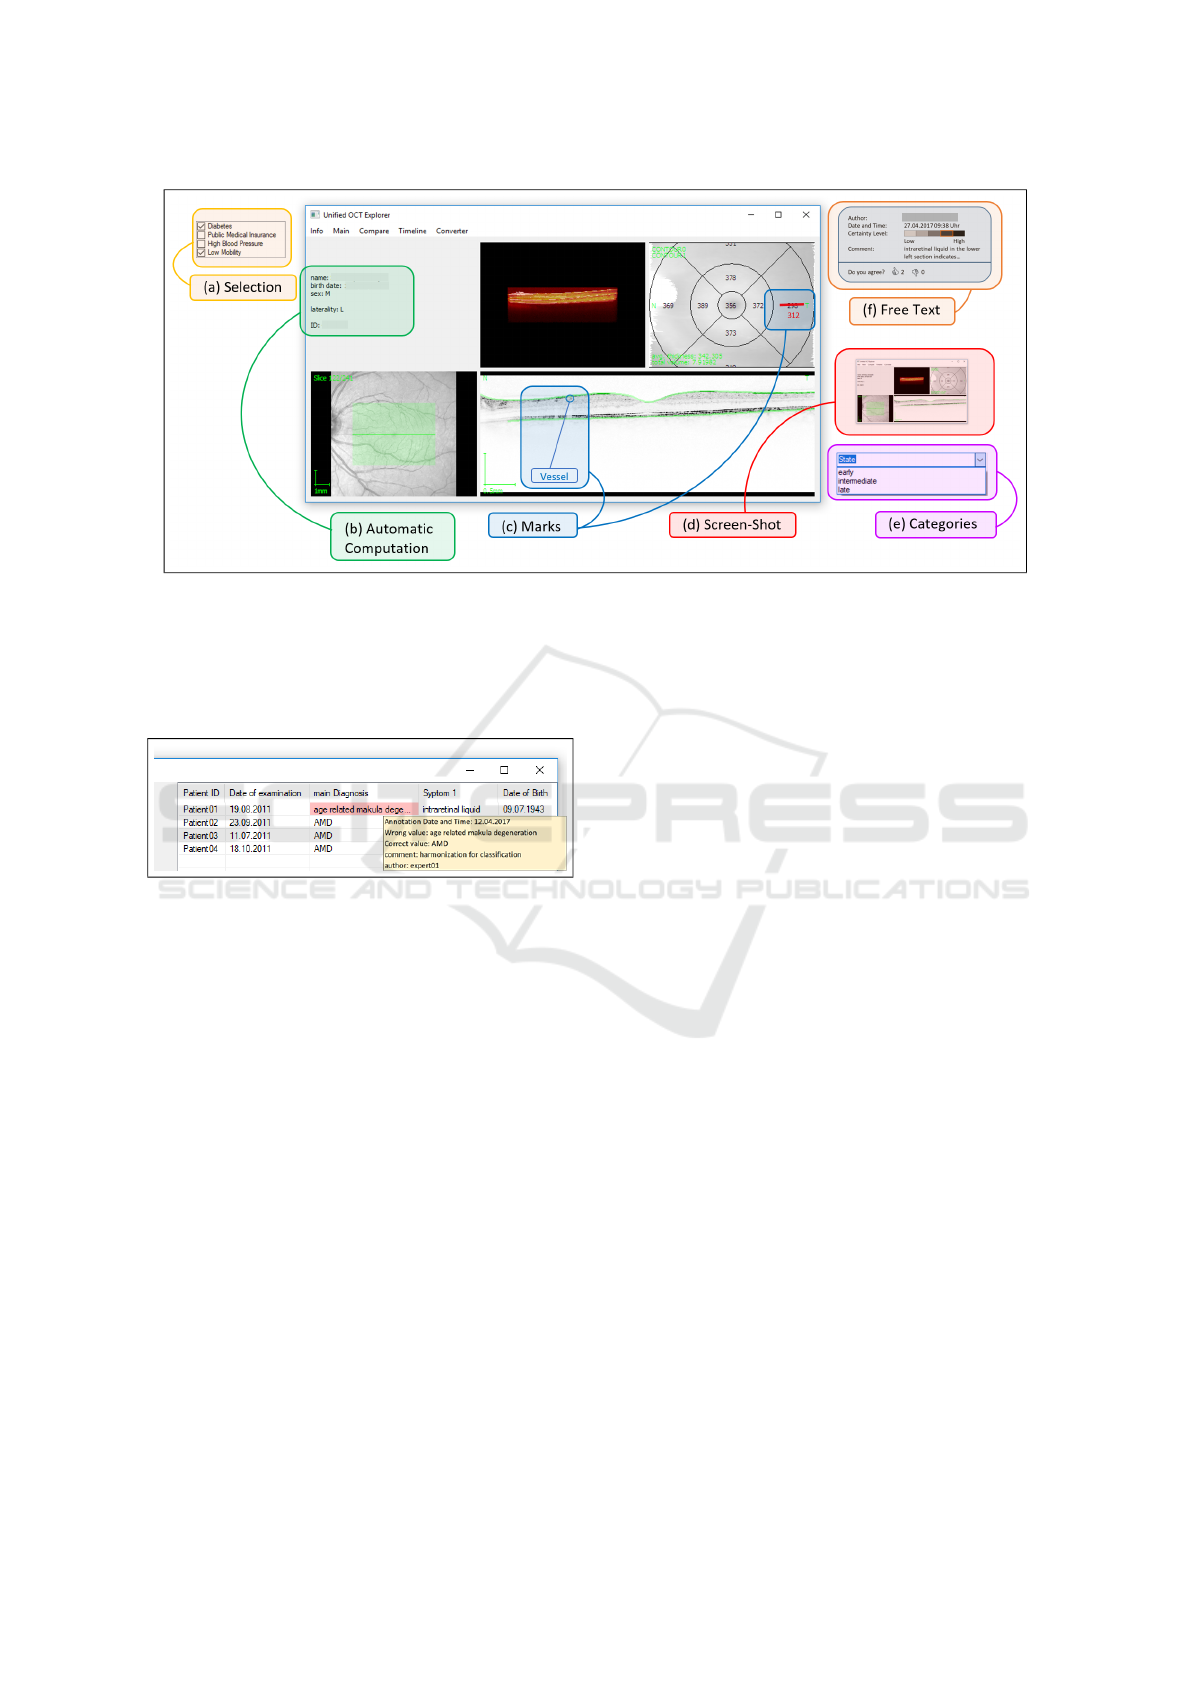
Figure 4: Examples of annotations. (a) Selections are shown on the top left of the image, highlighted in yellow. (b) The
green box surrounds automatically derived annotations, giving supplementary information and/or parameters on the data set,
integrated in the visualization. (c) The blue boxes show manually applied drawings and marks as an extra layer. (d) The red
colored box contains a screenshot example. (e) Purple highlighting shows predefined annotation categories from which the
user can choose one. (f) Orange is text annotation entered by the user with supplementary information, visually separated.
For illustration purposes, we utilize a tool for the visual analysis of OCT data by experts (Rosenthal et al., 2016).
Figure 5: Application for the data preparation phase.
Changes in the basic data are highlighted in red and com-
municated with supplementary data, shown in the yellow
box on mouse-over.
3.5 Summary
With the given morphological box from chapter 2 and
the possible usage within the phases of the knowl-
edge generation model, a first approach for a conve-
nient use of annotations is achieved. Figure 3 gives an
overview of the applicable characteristics in the dif-
ferent phases.
4 EVALUATION ON A USE CASE
In this section we discuss the usage of the results
from chapter 2 and 3 in a use case. In the field of
ophthalmology, specifically the treatment of retinal
diseases we are confronted with large amounts of
heterogeneous data. For a suitable VA approach,
we analyze the use of our morphological box on
annotation characteristics in the different phases of
the knowledge generation model.
Data preparation: For data preparation we show
the structured data were domain specialists can mark
specific data values, judge the value, suggest a correc-
tion, and leave a comment (Figure 5). The free text
section is an extra layer that can only be seen when
the mouse hovers the entry. This is to ensure that each
domain expert can generate an own opinion without
being distracted or influenced by previous annota-
tions. The only hint given is the highlight of the entry
providing the information that a detailed annotation
is available. The second author may leave a com-
ment as well, which will be shown below the first one.
Exploration: To evaluate our characteristic, we use
an existing tool from (Rosenthal et al., 2016) to in-
tegrate the annotation scheme as illustrated in Figure
4. For the exploration loop, several choices are valid.
The blue boxes (c), for instance, depicts the feasibil-
ity to mark features or findings in the graphic that po-
tentially lead to ailment indicators. The purple area
(e) symbolizes a categorization of the patient, lead-
ing to distinct classes of patients. To clearly distin-
guish between data and annotations, visual separation
is a correct choice. On the other hand, the automat-
ically computed information shown in (b) are inte-
grated in the data, as they can help understanding the
data. Knowing the age of a patient, for example, can
assist in image interpretation, as features may be age-
related.
IVAPP 2018 - International Conference on Information Visualization Theory and Applications
270

Verification: A conducive case for verification is
the creation of comments, containing insights and/or
findings as depicted in (f), highlighted in orange. The
annotated text is shown with supplementary informa-
tion like author, date, time, and certainty level. Other
experts have the possibility to vote on that comment
and add additional comments themselves. By linking
these additional comments a communication between
the experts is possible.
Knowledge Generation: To support knowledge gen-
eration all the comments from (f) can be collected and
visualized. Ordered by certainty value, and/or agree-
ment level users can view and appraise the consoli-
dated result. That gives an overview on the gained in-
sights and findings including the discussion between
the experts. A fitting visualization is the use of visual
separation, to obviously show that the annotations are
now in the center of the analysis, similar to the work
of (Zhao et al., 2017).
5 CONCLUSION AND FUTURE
WORK
We have shown that annotations can be characterized
and conveniently integrated into the knowledge gen-
eration model from (Sacha et al., 2014). The next step
will be the continuing evaluation by implementing our
projected use case. The examples for practical use
given in this paper, are only a small extract of the pos-
sibilities. Ongoing effort must be spent on analyzing
the effects of other annotation characteristics on the
visual analysis. That particularly applies to automat-
ically derived annotations, as this work concentrates
on the manually gathered amendments. Additionally,
more research effort must be invested into the clar-
ification of questions as ”How can we store annota-
tions?” and ”How can we integrate annotations into
the data space?”.
ACKNOWLEDGEMENTS
This work has been supported by the German Fed-
eral Ministry of Education and Research. Christoph
Schmidt has been supported by the project TOPOs.
REFERENCES
Alm, R., Aehnelt, M., and Urban, B. (2015). Processing
manufacturing knowledge with ontology-based anno-
tations and cognitive architectures. In Proceedings
of the 15th International Conference on Knowledge
Technologies and Data-driven Business - i-KNOW.
Association for Computing Machinery (ACM).
Callahan, S. P., Freire, J., Santos, E., Scheidegger, C. E.,
Silva, C. T., and Vo, H. T. (2006). Vistrails: Visu-
alization meets data management. In Proceedings of
the 2006 ACM SIGMOD International Conference on
Management of Data, New York, NY, USA.
Chang, E., Goh, K., Sychay, G., and Wu, G. (2003). CBSA:
content-based soft annotation for multimodal image
retrieval using bayes point machines. IEEE Transac-
tions on Circuits and Systems for Video Technology.
Fromont, R. (2017). Toward a format-neutral annotation
store. Computer Speech & Language.
Groth, D. and Streefkerk, K. (2006). Provenance and anno-
tation for visual exploration systems. IEEE Transac-
tions on Visualization and Computer Graphics.
Heer, J. and Shneiderman, B. (2012). Interactive dynamics
for visual analysis. Queue.
Heer, J., Vi
´
egas, F. B., and Wattenberg, M. (2007). Voy-
agers and voyeurs: Supporting asynchronous collabo-
rative information visualization. In Proceedings of the
SIGCHI Conference on Human Factors in Computing
Systems.
M, S. K. and Wilson, J. (2015). A novel method for
automatic discovery, annotation and interactive visu-
alization of prominent clusters in mobile subscriber
datasets. In 2015 IEEE 9th International Confer-
ence on Research Challenges in Information Science
(RCIS).
Mahyar, N., Sarvghad, A., and Tory, M. (2012). Note-
taking in co-located collaborative visual analytics:
Analysis of an observational study. Information Vi-
sualization.
R
¨
ohlig, M., Stachs, O., and Schumann, H. (2016). Detec-
tion of Diabetic Neuropathy - Can Visual Analytics
Methods Really Help in Practice? In EuroVis Work-
shop on Reproducibility, Verification, and Validation
in Visualization (EuroRV3).
Rosenthal, P., Ritter, M., Kowerko, D., and Heine, C.
(2016). Ophthalvis - making data analytics of optical
coherence tomography reproducible. In Proceedings
of EuroRV3, the EuroVis Workshop on Reproducibil-
ity, Verification, and Validation in Visualization.
Sacha, D., Stoffel, A., Stoffel, F., Kwon, B. C., Ellis, G., and
Keim, D. A. (2014). Knowledge generation model for
visual analytics. IEEE Transactions on Visualization
and Computer Graphics.
Sacha, D., Zhang, L., Sedlmair, M., Lee, J. A., Peltonen, J.,
Weiskopf, D., North, S. C., and Keim, D. A. (2017).
Visual interaction with dimensionality reduction: A
structured literature analysis. IEEE Transactions on
Visualization and Computer Graphics.
Saur
´
ı, R. (2017). Building FactBank or How to Annotate
Event Factuality One Step at a Time, pages 905–939.
Springer Netherlands, Dordrecht.
von Ahn, L., Maurer, B., McMillen, C., Abraham, D., and
Blum, M. (2008). recaptcha: Human-based character
recognition via web security measures. Science, pages
1465–1468.
Annotations as a Support for Knowledge Generation - Supporting Visual Analytics in the Field of Ophthalmology
271

Willett, W., Heer, J., Hellerstein, J., and Agrawala, M.
(2011). Commentspace: Structured support for col-
laborative visual analysis. In Proceedings of the
SIGCHI Conference on Human Factors in Computing
Systems, New York, NY, USA.
Zhao, J., Glueck, M., Breslav, S., Chevalier, F., and Khan,
A. (2017). Annotation graphs: A graph-based vi-
sualization for meta-analysis of data based on user-
authored annotations. IEEE Transactions on Visual-
ization and Computer Graphics.
IVAPP 2018 - International Conference on Information Visualization Theory and Applications
272
