
Subtle Motion Analysis and Spotting using the Riesz Pyramid
Carlos Andres Arango, Olivier Alata, R
´
emi Emonet, Anne-Claire Legrand and Hubert Konik
Univ. Lyon, UJM-Saint-Etienne, CNRS, Institut d Optique Graduate School, Laboratoire Hubert Curien UMR 5516,
F-42023, Saint-Etienne, France
Keywords:
Subtle Motion, Temporal Spotting, Riesz Pyramid, Quaternion Representation.
Abstract:
Analyzing and temporally spotting motions which are almost invisible to the human eye might reveal interest-
ing information about the world. However, detecting these events is difficult due to their short duration and
low intensities. Taking inspiration from video magnification techniques, we design a workflow for analyzing
and temporally spotting subtle motions based on the Riesz pyramid. In addition, we propose a filtering and
masking scheme that segments motions of interest without producing undesired artifacts or delays. In order to
be able to evaluate the spotting accuracy of our method, we introduce our own database containing videos of
subtle motions. Experiments are carried out under different types and levels of noise. Finally, we show that
our method is able to outperform other state of the art methods in this challenging task.
1 INTRODUCTION
Although the human visual system is capable of de-
tecting a plethora of objects and phenomena that
surround us it has limited spatio-temporal sensitiv-
ity. There are some movements of low-spatial am-
plitude that are difficult to detect by the human eye
which might conceal interesting information about
the world (Liu et al., 2005). For instance it has been
reported that the cyclical movement of blood in the
human body causes the head to move in a subtle peri-
odic motion which has been used to calculate the heart
rate in a non invasive manner (Balakrishnan et al.,
2013)(Irani et al., 2014). For this reason motion mag-
nification techniques have been developed in order to
reveal almost invisible signals in videos. These tech-
niques have been used for modal analysis (the study
of the dynamic properties of structures under vibra-
tional excitation) (Chen et al., 2015), for enhancing
the motion of the blood flow in the finger veins for
liveness detection (Raghavendra et al., 2015), to en-
hance the movement of facial expressions for anti-
spoofing in a face biometric system (Bharadwaj et al.,
2013), for amplifying the motion of pulsating arteries
during an endoscopic surgery (McLeod et al., 2014)
and for micro-expression recognition (Park and Kim,
2009).
The main problem with motion magnification
methods is that they exaggerate the motion on a video
rather than explicitly estimating it. However, our
careful examination showed that intermediate repre-
sentations produced by these methods can be used as
proxies for motion. Furthermore, considering that a
lot of real-life applications require to detect when an
event takes place, these representations could poten-
tially be used to temporally spot subtle events (find-
ing the temporal locations of subtle movements from
a video sequence). Thus, we propose a method to an-
alyze and spot subtle motions in a video by analyz-
ing the phase variations between frames based on the
Riesz Pyramid. This paper is organized as follows.
Section 2 serves as an introduction to the theoreti-
cal material to understand the Riesz Pyramid outputs,
its quaternionic representation and filtering. Section
3 describes our proposed methodology and contribu-
tions. Section 4 describes some potential applica-
tions, our experiments, results and discussion. Fi-
nally, section 5 presents our conclusions.
2 BACKGROUND
Eulerian motion magnification is a family of tech-
niques that amplifies subtle motion in videos. They
are inspired by the Eulerian perspective, in reference
to fluid dynamics where the properties of a voxel of
fluid, such as pressure and velocity, evolve over time.
The first of these techniques (Wu et al., 2012) exag-
gerates motion by amplifying temporal color changes
at fixed positions. However, this method can signif-
446
Arango, C., Alata, O., Emonet, R., Legrand, A-C. and Konik, H.
Subtle Motion Analysis and Spotting using the Riesz Pyramid.
DOI: 10.5220/0006620004460454
In Proceedings of the 13th International Joint Conference on Computer Vision, Imaging and Computer Graphics Theory and Applications (VISIGRAPP 2018) - Volume 5: VISAPP, pages
446-454
ISBN: 978-989-758-290-5
Copyright © 2018 by SCITEPRESS – Science and Technology Publications, Lda. All rights reserved
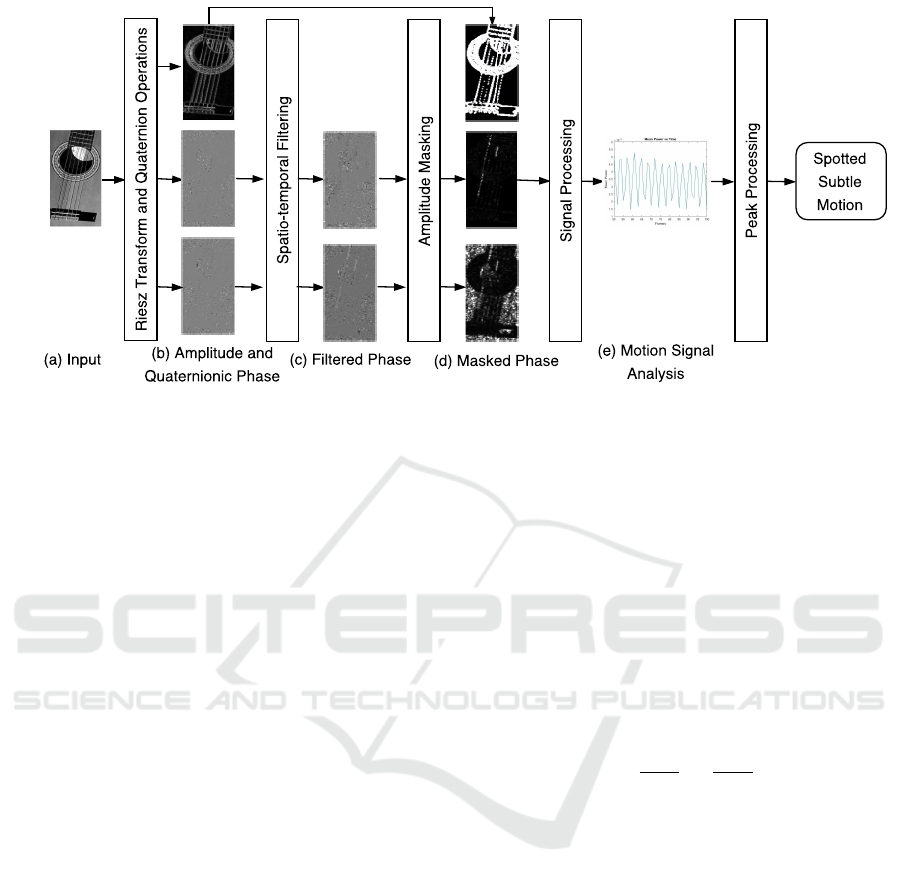
Figure 1: Subtle motion analysis framework. Each frame from an input video (a) is processed with the Riesz Pyramid to
obtain the local amplitude and the quaternionic phase (b). We apply an improved spatio-temporal filter to the quaternionic
phase (c). Then we use local amplitude to mask relevant areas in the quaternionic phase (d). The phase is processed into a
1-D signal (e) and we detect and classify the resulting peaks to spot the subtle motions.
icantly amplify noise when the magnification factor
is increased. Another method proposed by (Wadhwa
et al., 2013), amplifies the phase variation over time
within each image subband using the steerable pyra-
mid (an over-complete transform that decomposes
an image according to spatial scale, orientation, and
position). However, the main disadvantage of this
method comes from the complex steerable pyramids
which are very overcomplete and costly to construct.
Later on, (Wadhwa et al., 2014a) propose a new
method based on the Riesz pyramid which produced
motion-magnified videos of comparable quality to the
previous one, but the videos can be processed in one
quarter of the time, making it more suitable for real-
time or online processing applications.
Although, video magnification is a powerful tool
for magnify subtle motions in videos, it doesn’t in-
dicate the moment when these motions take place.
However, the filtered quaternionic phase differ-
ence obtained during the Riesz magnification ap-
proach (Wadhwa et al., 2014b) seems to be a good
proxy of motion, thus it could potentially be used for
analyzing and temporally segmenting subtle motions.
In this section, we do an introduction to the Riesz
pyramid, its quaternionic representation and quater-
nionic filtering.
2.1 Riesz Monogenic Signal
The Riesz pyramid is constructed by first breaking the
input image into non-oriented subbands using an ef-
ficient, invertible replacement for the Laplacian pyra-
mid, and then taking an approximate Riesz transform
of each band. The key insight into why this repre-
sentation can be used for motion analysis is that the
Riesz transform is a steerable Hilbert transformer and
allows us to compute a quadrature pair that is 90 de-
grees out of phase with respect to the dominant ori-
entation at every pixel. This allows us to phase-shift
and translate image features only in the direction of
the dominant orientation at every pixel.
Following (Unser et al., 2009), in two dimensions,
the Riesz transform is a pair of filters with transfer
functions
−i
ω
x
k
−→
ω k
,−i
ω
y
k
−→
ω k
(1)
with
−→
ω = [ω
x
,ω
y
] being the signal dimensions in the
frequency domain. If we filter a given image subband
I using Eq. 1, the result is the pair of filter responses,
(R
1
;R
2
). The input I and Riesz transform (R
1
;R
2
) to-
gether form a triple (the monogenic signal) that can
be converted to spherical coordinates to yield the lo-
cal amplitude A, local orientation θ and local phase φ
using the equations
I = A cos(φ)
R
1
= A sin (φ)cos(θ)
R
2
= A sin (φ) sin(θ)
(2)
2.2 Quaternion Representation of Riesz
Pyramid
The Riesz pyramid coefficient triplet (I; R
1
;R
2
) can
be represented as a quaternion r with the original sub-
band I being the real part and the two Riesz transform
Subtle Motion Analysis and Spotting using the Riesz Pyramid
447

components (R
1
;R
2
) being the imaginary i and j com-
ponents of the quaternion.
r = I + iR
1
+ jR
2
(3)
The previous equation can be rewritten using (4) as:
r = A cos(φ) + iAsin (φ)cos (θ) + jA sin(φ)sin (θ)
(4)
However, the decomposition proposed by (4) is not
unique. That means that both (A,φ,θ) and (A,−φ,θ +
π) are possible solutions. This can be solved if we
consider
φcos (θ),φ sin(θ) (5)
which are invariant to this sign ambiguity. If the Riesz
pyramid coefficients are viewed as a quaternion, then
Eq. 5 is the quaternion logarithm of the normalized
coefficient
1
. Thus, the local amplitude A and quater-
nionic phase defined in Eq. 5 are computed:
A = krk (6)
iφcos (θ) + jφ sin (θ) = log (r/krk) (7)
2.3 Filtering of Quaternionic Phase
In previous Eulerian motion amplification papers,
motions of interest were isolated and denoised with
temporal filters. However, the quaternionic phase
cannot be naively filtered since it is a wrapped quan-
tity (Wadhwa et al., 2014b). Therefore a technique
developed in (Lee and Shin, 2002) is used to filter a
sequence of unit quaternions (by first unwrapping the
quaternionic phases in time and then using a linear
time invariant (LTI) filter). This technique is used to
filter the Riesz pyramid coefficients at each pixel in
each scale in time. It is also assumed that the local
orientation is roughly constant in time and space.
Suppose at a single frame n, a single pixel (x,y) in
a single scale ω
r
the normalized Riesz pyramid coef-
ficients are:
r
n
= cos (φ
n
) + i sin(φ
n
)cos (θ
n
)
+ j sin (φ
n
)sin (θ
n
)
(8)
In the case of ordinary complex phase unwrap-
ping, we would take the principal value of the differ-
ence between successive terms and then do a cumula-
tive sum to give an unwrapped sequence in which the
difference between two successive terms is always in
the interval (−π,π]. We compute the principal value
of the difference between two successive coefficients
by dividing them and then taking the logarithm:
log(r
1
),log (r
2
r
−1
1
),. .. ,log (r
n
r
−1
n−1
) (9)
1
An extended review of the quaternionic representa-
tion icluding complex exponentiation and logarithms can be
found in (Wadhwa et al., 2014b).
If we assume that θ
n
= θ + ε, that is that the lo-
cal orientation is roughly constant over time at every
pixel, the k term will be close to zero. More specifi-
cally,
r
n
r
−1
n−1
= cos (φ
n
−φ
n−1
)
+isin (φ
n
−φ
n−1
)cos (θ)
+ j sin (φ
n
−φ
n−1
)sin (θ) + O(ε)
(10)
by ignoring the O(ε) term, the logarithm is
i([φ
n
−φ
n−1
])cos (θ) + j([φ
n
−φ
n−1
])sin (θ) (11)
The second step is to perform a cumulative sum of (9)
φ
1
u,(φ
1
+ [φ
2
−φ
1
])u,. ..,
φ
1
+
n
∑
l=2
[φ
n
−φ
n−1
]
!
u
(12)
where u = i cos θ + j sin θ. If we let
φ
0
n
= φ
1
+
∑
n
l=2
[φ
n
−φ
n−1
] the series can be written
as:
iφ
0
n
cos(θ) + jφ
0
n
sin(θ) (13)
Afterwards we can isolate motions of interest in the
quaternionic phase signal using an LTI filter. Further-
more, the signal-to-noise ratio (SNR) of the phase sig-
nal can be increased by spatially denoising each frame
with an amplitude-weighted spatial blur with Gaus-
sian Kernel K
ρ
with standard deviation ρ on the i and
j components of the temporally filtered signal.
i
Aφ
0
cos(θ) ∗K
ρ
A ∗K
ρ
+ j
Aφ
0
sin(θ) ∗K
ρ
A ∗K
ρ
(14)
Assuming that the orientation does not change sub-
stantially in the support of K
p
, then cos(θ) and sin(θ)
can be moved outside of the convolution in Eq. 14 to
get:
icos (θ)φ
00
+ j sin(θ)φ
00
(15)
where
φ
00
=
Aφ
0
∗K
ρ
A ∗K
ρ
(16)
where (15) is the filtered quaternionic phase obtained
for each pixel of each subband in each frame. This
signal is then multiplied by a magnification factor and
the pyramid is reconstructed to obtain the magnified
video (Wadhwa et al., 2014a). In the following sec-
tion, we show how this signal can be used to analyze
subtle motions.
3 SUBTLE MOTION ANALYSIS
Our proposed algorithm goes as follows: first we
use the Riesz Pyramid to calculate the amplitude
and quaternionic phase of the images. Secondly, we
implement a proper spatio-temporal filtering scheme
VISAPP 2018 - International Conference on Computer Vision Theory and Applications
448
which can enhance motions of interest without pro-
ducing delays or undesired artifacts. Thirdly, we iso-
late areas of potential subtle motion based on the com-
puted amplitude. Finally, we measure the dissimilar-
ities of quaternionic phases over time and transform
them into a 1-D signal, which is used to estimate the
moment when the subtle moment is taking place. A
graphic representation of our framework can be seen
in Figure 1.
3.1 Temporal Filtering Considerations
For an image sequence of N frames we perform the
process described in Sec.2.1 and Sec.2.2 for each
frame n ∈ N. However, not all levels of the pyramid
are able to provide useful information about the subtle
motion. Thus, after processing our video using differ-
ent pyramid levels, we select the one that shows more
subtle changes. We then obtain both local amplitude
A
n
and quaternionic phase (φ
n
cos(θ), φ
n
sin(θ)). We
apply the process described in Sec. 2.3 to obtain φ
00
(Eq. 16). However, since we are aiming to detect any
significant quaternionic phase shifts between frames
and to compensate for the cumulative sum made in
(12), we calculate the difference of two consecutive
filtered quaternionic phases:
∆φ
n
u = φ
00
n
u −φ
00
n−1
u (17)
where u = i cosθ + j sinθ. The previous work in eule-
rian motion magnification have given their users free-
dom to choose any temporal filtering method avail-
able. However, since we require to pinpoint the ex-
act moment when subtle motion is detected we can-
not use traditional causal filters which may delay the
signal response (Figure 2c). Therefore we propose to
use a digital non-causal zero-phase finite impulse re-
sponse (FIR) filter.
Φ
n
u = b
0
∆φ
n
u +
p
∑
k=1
b
k
(∆φ
n+k
u + ∆φ
n−k
u) (18)
where p is an even number and b
k
is a coefficient
of a FIR filter of length 2p + 1. One limitation of
this method is that non-causal filters requires to use
the previous and following p frames from the current
frame (therefore for online applications there must be
a delay of at least p frames). Another element to
consider is that Eulerian amplification methods are
tailored for a particular task. These methods aim to
amplify subtle periodical movements (such as human
breathing, the vibration of an engine, the oscillations
of a guitar string, etc) by temporally band-passing
some potential movements and amplify them. How-
ever, these methods do not consider subtle non peri-
odical movements (such as blinking or facial MEs).
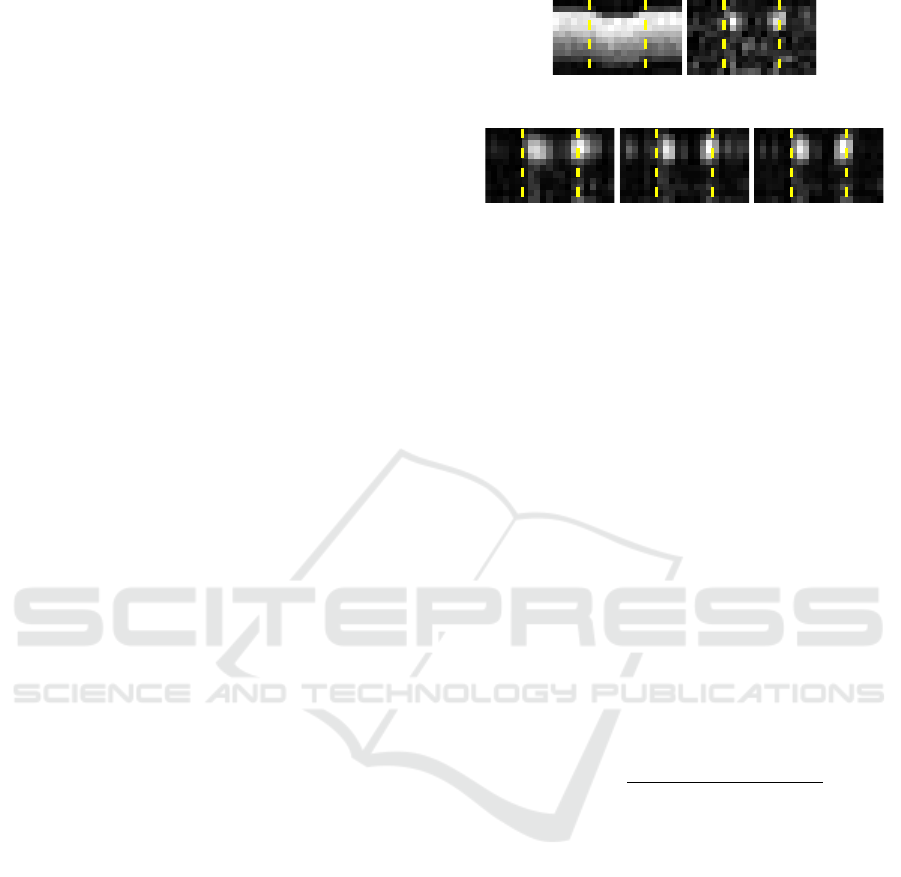
(a) (b)
(c) (d) (e)
Figure 2: A comparison of different filter responses for sub-
tle motion detection. (a) is an slice in time of an input im-
age sequence with subtle non periodical motion (The purple
dashed lines indicate when the subtle movement starts and
ends). (b) is the calculated quaternionic phase shift ∆φ
n
of
(a). We reduce the noise in (b) using three different filtering
schemes: (c) an IIR Butterworth causal filter which delays
the signal; (d) a FIR non-causal band-pass filter which does
not delay the signal but it creates some artifacts before and
after the motion has taken place (Gibbs phenomenon); (e) a
FIR non-causal low-pass filter (our proposal).
The latter type of motion, when band-passed, creates
some large oscillations near the beginning and the end
of the subtle motion (Figure 2d) as stated by Gibbs
phenomenon. Therefore we decided to use low-pass
filtering for this type of signals (Figure 2e).
3.2 Amplitude Masking
The first step is to simplify the quaternionic phase by
discarding the orientation and calculate the euclidean
norm of the phase thus:
|Φ
0
n
| =
q
(Φ
n
sinθ)
2
+ (Φ
n
cosθ)
2
(19)
One thing to consider before trying to detect sub-
tle motion is the problem of image noise. Assuming
the general case of two static images corrupted with
some level of additive Gaussian noise, their quater-
nionic phase difference would be non-zero (|Φ
0
n
|> 0)
even after the phase SNR is improved by ways of
spatial and temporal filtering (Sec. 2.3). We have
observed that the Φ
0
n
values could have a high vari-
ance in areas where local amplitude A has a rela-
tive low value regardless of the presence of motion.
Considering that the motion phase-signal in regions
of low amplitude is not meaningful (Wadhwa et al.,
2013) we decide to isolate these areas using a thresh-
old of validation computed from the local amplitude.
However, since the scale of local amplitude might
vary from subject to subject (Some videos might have
objects with stronger edges compared to others) we
need to normalize the local amplitude before we can
Subtle Motion Analysis and Spotting using the Riesz Pyramid
449
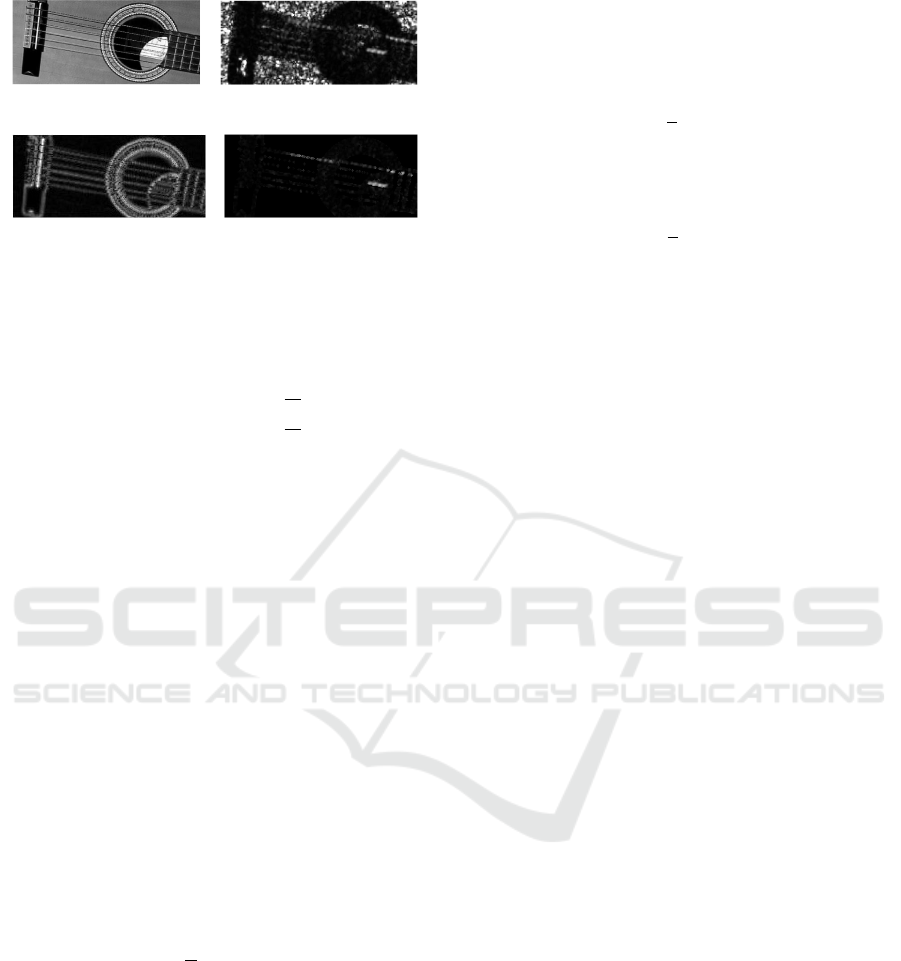
(a) (b)
(c) (d)
Figure 3: Quaternionic phase masked. (a) is an input video
in which the first string of the guitar is subtly oscillating.
(b) is the calculated quaternionic phase shift ∆φ and (c) is
its local amplitude. (d) is the result of masking (b) with (c).
threshold it.
M =
(
1 if β ≤
A
n
A
q
0 if β >
A
n
A
q
(20)
where A
n
is the calculated local amplitude of the im-
age at frame n, A
q
is the 95-percentile of the empirical
distribution of the amplitudes along the video and β is
a threshold selected by the user (See Section 4.2.3).
The mask can be further refined using morphological
opening. Finally, we mask the phase norm (Φ
0
n
) with
M (as seen in Figure 3d). By masking the areas of low
amplitude we have effectively selected the regions in
which subtle motion can be detected.
3.3 Motion Spotting
Although the amplitude masking step aims to discard
any area that could contribute with noisy data, some
spurious pixels might get through this step. Thus, for
each masked frame ∆φ, we select the values smaller
than the 90-percentile. This is done to avoid outliers
caused by noisy pixels which do not represent the sub-
tle motion. From the selected pixels we calculate the
average power:
P
n
=
1
L
L−1
∑
l=0
|∆φ
n,l
|
2
(21)
where l is the index of the selected pixels and L is
the total number of selected pixels. P
n
is a one-
dimensional signal which peaks or local maxima rep-
resents changes in the image sequence.
In order to distinguish relevant peaks (subtle mo-
tions) from local magnitude variations and back-
ground noise, we use a method to contrast the differ-
ences of P
n
proposed by (Li et al., 2017). This method
compares the differences of P
n
within a specified in-
terval. Since subtle motions might take more than 2
consecutive frames, we analyze micro-intervals of K
frames (an odd number bigger than 2). Then, for each
current frame value, we subtract the average of the
k-th frame value before the current frame and the k-th
frame value after the current frame, where
k =
1
2
(K −1) (22)
Thus, for the n-th value in the contrasted difference
vector C(φ) is calculated by:
C
n
= P
n
−
1
2
(P
n−k
+ P
n+k
) (23)
Finally, we select from C
n
the peaks or local maxima
that go over a threshold T and that are separated for
at least K frames. The threshold is calculated as:
T = C
median
+ p ×(C
max
−C
median
) (24)
where C
median
and C
max
are the median and maximum
value of C
k
for the whole video and p is a percentage
parameter in the range [0,1].
4 RESULTS
Our proposed method allows an user to analyze sub-
tle motions in videos. Although, the eulerian am-
plification methods are able to reveal imperceptible
phenomena not previously visualized on video, our
method goes further and is able to quantify this mo-
tion. Thus, in the following section, we decide to
show some potential applications using the videos
provided in the supplemental material of (Wadhwa
et al., 2013; Wadhwa et al., 2014a).
4.1 Preliminary Evaluation
We select a video of a baby sleeping under a blanket in
a cradle that, when it’s magnified, amplifies the sub-
tle movements of the baby breathing (See Figure 4a).
We decided to test our method using the same filtering
parameters suggested by the supplemental material of
(Wadhwa et al., 2013; Wadhwa et al., 2014a). For
the Riesz transform step we select the second level of
the pyramid. We design a non-causal FIR bandpass
FIR temporal filter of order 10 with passband between
0.04 and 0.4 Hz. We use a Gaussian Kernel K
ρ
with
standard deviation ρ = 2 for spatial filtering. For the
amplitude masking step we select a threshold β = 0.3
(See Figure 4b). The segmented areas are transformed
into a 1-D signal using mean power. As we can see
in Figure 4c, the local maxima in the signal corre-
spond to the moment when the breathing motion is at
its peak, thus we can estimate the breathing patter of
the baby.
VISAPP 2018 - International Conference on Computer Vision Theory and Applications
450

(a)
(b)
50 60 70 80 90 100 110 120 130 140 150
Frames
2
2.2
2.4
2.6
2.8
3
3.2
3.4
3.6
3.8
4
Mean Power
10
-4
Mean Power vs Time
(c)
Figure 4: Subtle motion detection for breathing measure-
ment. (a) is the a frame of a video of a baby sleeping, (b) is
the masked phase norm and (c) is the obtained signal.
We also select a video of a drum, for which the
motion amplification method, magnifies its vibrations
(See Figure 5a). For this example we decided to de-
sign a filtering using a passband between 60 and 90
Hz instead of the narrow passband between 74 and 78
suggested by (Wadhwa et al., 2013). This video was
recorded using a high speed camera at 1900 fps. For
the Riesz transform step we select the third level of
the pyramid. The following parameters are the ones
suggested in the supplemental material of (Wadhwa
et al., 2013; Wadhwa et al., 2014a). We design a
non-causal FIR bandpass FIR temporal filter of order
44. with passband between 60 and 90 Hz. We use a
Gaussian Kernel K
ρ
with standard deviation ρ = 2 for
spatial filtering. For the amplitude masking step we
select a threshold β = 0.15 (See Figure 5b). The seg-
mented areas are transformed into a 1-D signal using
mean power. As we can see in Figure 5c, the detected
vibration behaves like a combination of sinusoidal
waves (which is expected since the drum is emitting
acoustic waves). We can further analyze the signal
spectrum using the fast Fourier transform. As we can
see from Figure 5d, there are some frequency peaks
outside the narrow spectrum considered by (Wadhwa
et al., 2013) which could better characterize the fre-
quency of the drum vibration.
4.2 Experiments
Although, the examples presented in the previous sec-
tion show the potential of our method for subtle mo-
tion analysis, we would also like to measure its spot-
ting accuracy and robustness. Thus, we have designed
an experiment to compare the performance of our
method compared with methods in the state of the art
under different levels of noise.
4.2.1 Database
To the extent of our knowledge, there is not a public
labeled subtle motion database available. Thus we de-
cide to create our own database consisting of image
sequences with subtle motions. We create 18 image
sequences using real and artificially generated images
which elements are for the most part static with the
exception of one or two instances of subtle motion.
We simulate the subtle motion by translating either an
object in the image or the whole image by one pixel
per frame during two or three frames. We also la-
bel the time when the subtle motion starts (onset) and
ends (offset).
4.2.2 Method Comparison
We decide to compare our proposed method against
other classical approaches for motion detection. First,
the image is divided into a grid of equal-sized blocks.
Then, we extract information from each block using
three different feature descriptors: local binary pat-
tern (LBP) (Ojala et al., 2002), histogram of oriented
gradients (HOG) (Dalal and Triggs, 2005) and optical
flow (OF) using the Lucas-Kanade method (Barron
et al., 1994). Then we use the feature difference anal-
ysis method proposed by (Li et al., 2017) to compare
the differences of the appearance-based features for
each block within a specified interval. The difference
between HOG and LBP histograms is calculated us-
ing the Chi-Squared (χ
2
) distance. Then we sort the
feature difference values from the blocks and calcu-
late the mean of the greatest values that surpass the
80−percentile. Finally, we use the method to con-
trast the differences and the peak detection discussed
in section 3.3 (Eq. 23 and 24 respectively).
4.2.3 Parameter Selection
We select the parameters for the spotting methods
which will work in all videos without added noise.
For our spotting method we select the second level
of the Riesz pyramid. We design a FIR non-causal
low-pass temporal filter with cutoff frequency of 30
Hz, corresponding to a filter of order 10. We use a
Gaussian Kernel K
ρ
with standard deviation ρ = 2 for
spatial filtering. For the amplitude masking step we
select a threshold β = 0.25.
For the LBP method we divide the image into
a grid of 6 × 6 equal-sized blocks. The LBP de-
scriptor has a radius of 3 pixels with 16 neigh-
bors. For the HOG method we use the function
extractHOGFeatures from Matlab. For each block
produced by the function there are 2 ×2 cells of [8,8]
pixels. For the OF method, we divide the image into
a grid of 6 ×6 and compute the flow’s amplitude
2
.
2
We don’t extract the orientation since it doesn’t provide
Subtle Motion Analysis and Spotting using the Riesz Pyramid
451

(a)
(b)
0 50 100 150 200 250 300 350 400 450
Frames
0
0.2
0.4
0.6
0.8
1
1.2
1.4
1.6
1.8
Mean Power
10
-3
Mean Power vs Time
(c)
0 50 100 150
f (Hz)
0
0.5
1
1.5
2
2.5
3
3.5
4
4.5
5
10
-4
Power Spectral Density
(d)
Figure 5: Subtle motion analysis for spectral analysis. (a) is the a frame of a video of a vibrating drum, (b) is the masked
phase norm,(c) is the obtained sinusoidal signal and (d) is its magnitude spectrum.
4.2.4 Image Noise Measurement
Considering that subtle motions have low amplitude
and, in some cases, they could be mistaken for noise,
we decide to test the robustness of the motion de-
tection methods in the presence of different levels of
noise. We choose to test the videos under Gaussian
additive noise and Salt and Pepper noise. In order
to do a standard measurement of the noise among
the different videos, we measure it using the peak
signal-to-noise ratio (PSNR). PSNR is defined by the
mean square error (MSE). Given a noise-free u ×v
monochrome image I and the image with added noise
K, MSE is defined as:
MSE =
1
uv
u−1
∑
i=0
v−1
∑
j=0
[I(i, j) −K(i, j)]
2
(25)
The PSNR (in dB) is defined as:
PSNR = 10 ·log
10
MAX
I
√
MSE
(26)
where MAX
I
is the maximum possible pixel value of
the image.
4.2.5 Evaluation Methodology
The first step is, for each video, to add a specific
level of noise. Then we evaluate the methods accu-
racy by comparing all the detected peak frames in
each method with the ground truth labels from each
video in order to tell whether they are true or false
positive subtle motions. Within a certain threshold
level (p = 0.75 see Eq. 24), if one spotted peak is lo-
cated within the frame range of [ONSET, OFFSET] of
a labeled subtle motion video, the detected sequence
is be considered as one true positive subtle motion.
any important information about the instant when a subtle
motion takes place.
Otherwise a penalization of a possible detected subtle
motion (ψ frames) is counted as false positive. Since
the noise is added randomly we repeat the test and
measure the methods’ accuracy 20 times.
We define the true positive rate (TPR) as the per-
centage of frames of correctly detected subtle motion
divided by the total number of ground truth subtle mo-
tion frames in the database. The false positive rate
(FPR) is calculated as the percentage of incorrectly
spotted frames divided by the total number of non-
subtle motion frames from all the image sequences.
We evaluate the performance of the subtle motion de-
tection methods by tracing curves with TPR and FPR
as the y axis and PSNR as the x axis.
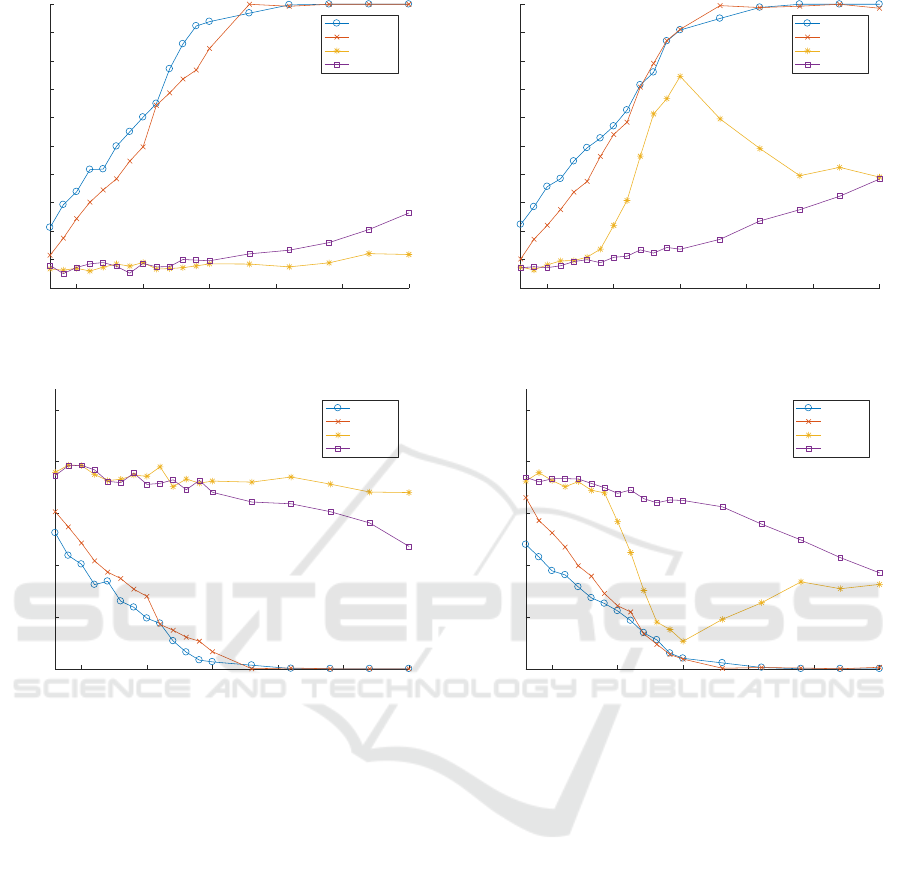
4.2.6 Experimental Results
The spotting results under different levels of Gaus-
sian noise are presented in Figure 6. Our method has
shown to have an equal or higher TPR in the pres-
ence of most levels of Gaussian noise compared to the
other methods except when the PSNR is between 20
and 23 dB in which the OF method has a higher TPR.
Similarly, the FPR of our method is equal or lower in
most levels of Gaussian Noise except when the PSNR
is between 20 and 23 dB. The LBP and HOG method
had a lower TPR and a higher FPR compared to our
method and the OF method.
The spotting results under different levels of den-
sity of Salt and Pepper noise are presented in Figure 7.
Our method has shown to have an equal or higher
TPR in the presence of most levels of Salt and Pep-
per noise compared to the other methods except when
the PSNR is between 19 and 26 dB in which the OF
method has a higher TPR. Similarly, the FPR of our
method is equal or lower in most levels of Salt and
Pepper Noise except when the PSNR is between 19
and 26 dB. The LBP and HOG method had a lower
TPR and a higher FPR compared to our method and
the OF method. However, the LBP method seems to
VISAPP 2018 - International Conference on Computer Vision Theory and Applications
452
10 15 20 25 30 35
PSNRdB
0
0.1
0.2
0.3
0.4
0.5
0.6
0.7
0.8
0.9
1
TPR
TPR vs PSNRdB
Riesz Pyr
OF
LBP
HOG
(a)
10 15 20 25 30 35
PSNRdB
0
0.05
0.1
0.15
0.2
0.25
FPR
FPR vs PSNRdB
Riesz Pyr
OF
LBP
HOG
(b)
Figure 6: Performance curves of different subtle motion
spotting techniques in presence of different levels of Gaus-
sian noise.
have a better performance between 18 and 23 dB than
HOG.
4.2.7 Discussion
The results in the previous section show that our
method has, in general, a better spotting accuracy
compared to the other methods tested. However, a
closer examination of our database has shown that our
method performs better in images with overall strong
edges and its performance decreased in images with
blurry edges. A possible explanation for this behav-
ior is that our amplitude masking method (see sec-
tion 3.2) aims to bypass areas of higher amplitude
in which the phase noise is lower and discard areas
of low amplitude in which the phase noise is higher.
However, in images with blurry edges, the computed
amplitude will be low all over the image and our sys-
10 15 20 25 30 35
PSNRdB
0
0.1
0.2
0.3
0.4
0.5
0.6
0.7
0.8
0.9
1
TPR
TPR vs PSNRdB
Riesz Pyr
OF
LBP
HOG
(a)
10 15 20 25 30 35
PSNRdB
0
0.05
0.1
0.15
0.2
0.25
FPR
FPR vs PSNRdB
Riesz Pyr
OF
LBP
HOG
(b)
Figure 7: Performance curves of different subtle motion
spotting techniques in presence of different levels of Salt
and Pepper noise.
tem will end up bypassing areas of higher noise, thus,
compromising our method’s accuracy.
The performance of the OF method is comparable
to our method. Since the Lucas-Kanade optical flow
method was formulated under the temporal persis-
tence assumption (motion remains small from frame
to frame), it seems like an appropriate method for de-
scribing subtle motion (Kamate and Yilmazer, 2015).
However, in videos with color gradients and certain
levels of noise, the optical flow accuracy is decreased.
The accuracy of the HOG method was low be-
cause image gradients are sensible to noise. The
accuracy of the LBP method was also low because
LBP is sensitive to noise and sometimes may clas-
sify two or more different patterns falsely to the same
class (Rassem and Khoo, 2014). However, the overall
results suggest that our method better describes subtle
motion than LBP and HOG descriptors.
Subtle Motion Analysis and Spotting using the Riesz Pyramid
453

5 CONCLUSIONS
We presented a subtle motion analysis and spot-
ting method based on the Riesz pyramid. Our
method adapted the quaternionic representation of the
Riesz monogenic signal by proposing a new filtering
scheme. We were also able to mask regions of inter-
est where subtle motion might take place in order to
reduce the effect of noise using the image amplitude.
Furthermore, we illustrated the power of our subtle
motion analysis method by briefly presenting a couple
of potential real-life applications. After testing our
method using our own database under different levels
of Gaussian additive noise and salt and peper noise,
we can conclude that our method surpasses other state
of the art methods.
Due to the unavailability of a public labeled subtle
motion database we had to test our experiments in a
rather limited dataset. Further tests will require us to
create or find a more complete database in order to
obtain more statistically significant results.
The quaternionic representation of phase and ori-
entation from the Riesz monogenic signal is a power-
ful tool that could potentially be exploited in the fu-
ture for more focused applications like modal analy-
sis, biomedical signals processing, and facial micro-
expression spotting and recognition.
REFERENCES
Balakrishnan, G., Durand, F., and Guttag, J. (2013). Detect-
ing Pulse from Head Motions in Video. In 2013 IEEE
Conference on Computer Vision and Pattern Recogni-
tion, pages 3430–3437.
Barron, J. L., Fleet, D. J., and Beauchemin, S. S. (1994).
Performance of optical flow techniques. International
Journal of Computer Vision, 12(1):43–77.
Bharadwaj, S., Dhamecha, T. I., Vatsa, M., and Singh, R.
(2013). Computationally Efficient Face Spoofing De-
tection with Motion Magnification. In 2013 IEEE
Conference on Computer Vision and Pattern Recog-
nition Workshops, pages 105–110.
Chen, J. G., Wadhwa, N., Cha, Y.-J., Durand, F., Freeman,
W. T., and Buyukozturk, O. (2015). Modal identifica-
tion of simple structures with high-speed video using
motion magnification. Journal of Sound and Vibra-
tion, 345:58–71.
Dalal, N. and Triggs, B. (2005). Histograms of oriented gra-
dients for human detection. In 2005 IEEE Computer
Society Conference on Computer Vision and Pattern
Recognition (CVPR’05), volume 1, pages 886–893
vol. 1.
Irani, R., Nasrollahi, K., and Moeslund, T. B. (2014). Im-
proved Pulse Detection from Head Motions Using
DCT. Institute for Systems and Technologies of In-
formation, Control and Communication.
Kamate, S. and Yilmazer, N. (2015). Application of Object
Detection and Tracking Techniques for Unmanned
Aerial Vehicles. Procedia Computer Science, 61:436–
441.
Lee, J. and Shin, S. Y. (2002). General construction of time-
domain filters for orientation data. IEEE Transactions
on Visualization and Computer Graphics, 8(2):119–
128.
Li, X., Hong, X., Moilanen, A., Huang, X., Pfister, T.,
Zhao, G., and Pietikainen, M. (2017). Towards Read-
ing Hidden Emotions: A Comparative Study of Spon-
taneous Micro-expression Spotting and Recognition
Methods. IEEE Transactions on Affective Computing,
PP(99):1–1.
Liu, C., Torralba, A., Freeman, W. T., Durand, F., and Adel-
son, E. H. (2005). Motion Magnification. In ACM
SIGGRAPH 2005 Papers, SIGGRAPH ’05, pages
519–526, New York, NY, USA. ACM.
McLeod, A. J., Baxter, J. S. H., de Ribaupierre, S., and
Peters, T. M. (2014). Motion magnification for en-
doscopic surgery. volume 9036, pages 90360C–
90360C–8.
Ojala, T., Pietikainen, M., and Maenpaa, T. (2002). Mul-
tiresolution gray-scale and rotation invariant texture
classification with local binary patterns. IEEE Trans-
actions on Pattern Analysis and Machine Intelligence,
24(7):971–987.
Park, S. and Kim, D. (2009). Subtle facial expression recog-
nition using motion magnification. Pattern Recogni-
tion Letters, 30(7):708–716.
Raghavendra, R., Avinash, M., Marcel, S., and Busch, C.
(2015). Finger vein liveness detection using motion
magnification. In 2015 IEEE 7th International Con-
ference on Biometrics Theory, Applications and Sys-
tems (BTAS), pages 1–7.
Rassem, T. H. and Khoo, B. E. (2014). Completed local
ternary pattern for rotation invariant texture classifica-
tion. The Scientific World Journal, 2014.
Unser, M., Sage, D., and Ville, D. V. D. (2009). Multires-
olution Monogenic Signal Analysis Using the Riesz-
Laplace Wavelet Transform. IEEE Transactions on
Image Processing, 18(11):2402–2418.
Wadhwa, N., Rubinstein, M., Durand, F., and Freeman, W.
(2014a). Riesz pyramids for fast phase-based video
magnification. In 2014 IEEE International Confer-
ence on Computational Photography (ICCP), pages
1–10.
Wadhwa, N., Rubinstein, M., Durand, F., and Freeman,
W. T. (2013). Phase-based Video Motion Processing.
ACM Trans. Graph., 32(4):80:1–80:10.
Wadhwa, N., Rubinstein, M., Durand, F., and Freeman,
W. T. (2014b). Quaternionic representation of the
riesz pyramid for video magnification. Technical re-
port.
Wu, H.-Y., Rubinstein, M., Shih, E., Guttag, J., Durand, F.,
and Freeman, W. (2012). Eulerian Video Magnifica-
tion for Revealing Subtle Changes in the World. ACM
Trans. Graph., 31(4):65:1–65:8.
VISAPP 2018 - International Conference on Computer Vision Theory and Applications
454
