
A Hybrid Pedestrian Detection System based on Visible Images and
LIDAR Data
Mohamed El Ansari
1
, Redouan Lahmyed
1
and Alain Tremeau
2
1
LabSIV, Department of Computer Science, Faculty of Science, University of Ibn Zohr, Agadir, Morocco
2
Hubert Curien Laboratory, University Jean Monnet, Saint-Etienne, France
Keywords:
Pedestrian Detection, LIDAR Sensor, Visible Camera Sensor, Support Vector Machines (SVMs), Adaboost,
Histogram of Oriented Gradients (HOG), Local Self-similarity (LSS).
Abstract:
This paper presents a hybrid pedestrian detection system on the basis of 3D LIDAR data and visible images
of the same scene. The proposed method consists of two main stages. In the first stage, the 3D LIDAR data
are classified to obtain a set of clusters, which will be mapped into the visible image to get regions of interests
(ROIs). The second stage classifies the ROIs (pedestrian/non pedestrian) using SVM as classifier and color
based histogram of oriented gradients (HOG) together with the local self-similarity (LSS) as features. The
proposed method has been tested on LIPD dataset and the results demonstrate its effectiveness.
1 INTRODUCTION
Advanced Driver Assistance Systems (ADAS) is an
active research area that has attracted a lot of inter-
est in the recent years, due to the fact that it plays
an important role at enhancing vehicle systems for
safety and better driving to avoid collisions and ac-
cidents. There are various sensors upon which ADAS
technology is based, such as the visible cameras (Lim
and Kim, 2013; Zhang et al., 2016), thermal cameras
(Yang et al., 2016; Elguebaly and Bouguila, 2013),
LIDAR sensors (Lahmyed and El Ansari, 2016; Pre-
mebida and Nunes, 2006) and so on. The diverse
kinds of data acquired from those sensors could be
exploited in many ADAS fields such as pedestrian de-
tection (Zhu and Peng, 2017), traffic sign detection
and recognition (Ellahyani and El Ansari, 2017; El-
lahyani et al., 2016), vehicle environment perception
(Ilyas El Jaafari et al., 2017; El Jaafari et al., 2016;
Mazoul et al., 2014; El Ansari et al., 2010) and so
on. One of the major challenges that ADAS face is
the comprehension of the environment and directing
the vehicles in real outdoor scenes (Prieto and Allen,
2009). For that, the requirement of determining and
identifying the presence of pedestrians in the scene is
considered as a crucial task.
The purpose of a pedestrian detection system is
to find out the presence of both moving and station-
ary humans in a particular area of interest around the
moving vehicle in order alert the driver. However,
there are many factors that make the pedestrian de-
tection problem difficult such as:
• The appearance of pedestrians shows very wide
variability: High variety of poses, wear different
clothes, carry diverse objects and have a consider-
able range of sizes.
• Complex backgrounds: the pedestrians must be
well detected in outdoor urban scenarios despite
the wide range of illumination and weather condi-
tions that affect the quality of the sensed informa-
tion.
• Occlusions and different scales between pedestri-
ans as well as the appearance of the pedestrians at
different viewing angles.
In this paper, we present a new pedestrian de-
tection approach that includes both LIDAR and vi-
sion sensors. The proposed approach is an extension
of that early presented in (Lahmyed and El Ansari,
2016) by the same authors. It takes as input a 3D LI-
DAR data and its corresponding visible image. The
proposed approach is composed of two major stages.
The first stage clusters the 3D LIDAR data into con-
nected components using the DBSCAN (Ester et al.,
1996) technique. The obtained clusters are projected
on the corresponding visible image to generate ROIs.
The second stage identifies the pedestrians from the
extracted ROIs using the Color-based HOG feature
combined with LSS feature that they are provided to
the SVM classifier.
Ansari, M., Lahmyed, R. and Tremeau, A.
A Hybrid Pedestrian Detection System based on Visible Images and LIDAR Data.
DOI: 10.5220/0006620803250334
In Proceedings of the 13th International Joint Conference on Computer Vision, Imaging and Computer Graphics Theory and Applications (VISIGRAPP 2018) - Volume 5: VISAPP, pages
325-334
ISBN: 978-989-758-290-5
Copyright © 2018 by SCITEPRESS – Science and Technology Publications, Lda. All rights reserved
325

The rest of the paper is organized as follows. Sec-
tion 2 presents an overview of recent works on pedes-
trian detection. Section 3 details the new proposed
pedestrian detection method. Experimental results are
presented in Section 4. Section 5 concludes the paper.
2 RELATED WORK
Different pedestrian methods have been suggested in
the literature. Comparing between those approaches
is a challenging task since they use different data
recorded from various sensors such as visible cam-
era (Lim and Kim, 2013; Zhang et al., 2016), infrared
camera (Yang et al., 2016; Elguebaly and Bouguila,
2013), LIDAR sensor (Lahmyed and El Ansari, 2016;
Premebida and Nunes, 2006), and so on.
Compared to other sensors, visible cameras (Lim
and Kim, 2013) are more suited for pedestrian de-
tection approaches due to its low cost. Those works
could be classified into two main categories. The first
one is based on the idea of presenting the human body
as a set of parts (Cho et al., 2012; Wu and Nevatia,
2005; Mikolajczyk et al., 2004) called part-based de-
tection. The second one tries to detect the whole body
without modelling it as collection of parts, named
Holistic detection (Dalal and Triggs, 2005; Papageor-
giou and Poggio, 1999). Both categories adopted for
pedestrian detection share the same direction in the
aim of creating robust features (Tang and Goto, 2010;
Mu et al., 2008; Dalal and Triggs, 2005; Lowe, 2004)
using ad-hoc features or learning features (Sch
¨
olkopf
and Smola, 2002; Viola and Jones, 2001; Friedman
et al., 2000).
In the first direction, different features have been
exploited including Haar (Viola et al., 2003), Lo-
cal Binary Pattern (LBP) (Ojala et al., 1996), Local
Self-Similarity (LSS) (Shechtman and Irani, 2007),
Histogram of Oriented Gradient (HOG) (Dalal and
Triggs, 2005) and so on. Histogram of oriented gradi-
ents (HOG) features has been widely utilized in many
studies and being the basis of many current detectors
due to its robustness for the variation of human shape,
height as well as clothes color. Local Binary Patterns
(LBP) (Ojala et al., 1996) was first proposed for tex-
ture classification. LBP-based features for human de-
tection have been suggested in (Tang and Goto, 2010;
Mu et al., 2008).
In the second direction, different learning al-
gorithms have been introduced. Boosting (Fried-
man et al., 2000) and SVM methods (Sch
¨
olkopf and
Smola, 2002) are two famous training methods in the
field. Boosting methods (Viola and Jones, 2001) are
generally utilized in cascade detector. They provide a
satisfying performance by constructing a strong clas-
sifier using a set of weak ones. In SVM methods, the
simplicity of the training phase can grant the possi-
bility of accelerating the SVM based detection using
a Multi-core CPU and a GPU in the feature extrac-
tion part. Zhang et al. (Zhang et al., 2010) intro-
duced HOG feature and linear SVM-based human de-
tection system. Zhu et al. (Zhu et al., 2006) presented
a system that integrates the cascade of rejectors con-
cept with the HOG feature and the Adaboost. Miko-
lajczyk et al. (Mikolajczyk et al., 2004) suggested
a system for human detection using probabilistic as-
sembly of robust part detectors. They used the Ad-
aboost classifier to combine the weak classifiers to
produce a fast and strong one. The Adaboost clas-
sifier has been used to construct a cascade of simple
features to create a system for detecting faces (Viola
and Jones, 2004) and to build a pedestrian detection
system (Viola et al., 2003) using appearance and mo-
tion information.
In order to alleviate difficulties related to visible
cameras, some relevant works on object classification
in urban scenarios suggest to use data acquired from
the laser detection and ranging (LIDAR) (Gidel et al.,
2008; Premebida and Nunes, 2006; Streller and Di-
etmayer, 2004; Dietmayer et al., 2001). Premebida
and Nunes (Premebida and Nunes, 2006) proposed
the utilization of a GMM classification system over
a set of geometric features for pedestrian detection in
outdoor environments. In (Xavier et al., 2005), the au-
thors proposed a new type of features named inscribed
angle variance (IAV), which performs a leg-segment
feature correspondence to detect persons in indoor en-
vironments. In (Arras et al., 2007), Arras et al. used a
set of statistical primitives such as number of points,
mean average deviation from median, standard devi-
ation and eleven more, supplying them as an input to
Adaboost classifier.
Some works propose combining the information
acquired by both the LIDAR and the visible camera to
increase the detection performance (Premebida et al.,
2009b; Spinello and Siegwart, 2008; Douillard et al.,
2007). In (Spinello and Siegwart, 2008), a pedes-
trian detection method based on combining visible
and LIDAR sensors information has been presented.
A Bayesian fusion is called together with linear SVM
to perform the detection task. Douillard et al. (Douil-
lard et al., 2007) introduced a system to detect and
recognize the objects using vision and laser informa-
tion in outdoor environments by taking advantage of
the spatial and temporal dependencies.
VISAPP 2018 - International Conference on Computer Vision Theory and Applications
326
3 PROPOSED METHOD
The proposed algorithm takes as input a set a 3D LI-
DAR data and one visible image of the same scene.
The 3D LIDAR data is used to extract ROIs while the
visible image image is used to classify each of the ex-
tracted ROIs as pedestrian or non pedestrian. The pro-
posed method is achieved in two main steps: (1) ROIs
extraction based on the LIDAR data and ROIs classi-
fication based on the information issued from the vis-
ible image. Here, we detail each of the two steps.
3.1 ROIs Extraction
The 3D points acquired by the LIDAR sensor are clus-
tered into a set of groups using DBSCAN cluster-
ing technique, which was introduced in (Ester et al.,
1996). It is a density-based clustering algorithm.
Starting from a set of points in some space, the DB-
SCAN algorithm groups together points with many
nearby neighbours. It considers as outliers points
whose nearest neighbours are too far away. The al-
gorithm requires two important input parameters such
as MinPts the minimum number of points required to
form a dense region and EPS the maximum radius
of the neighbourhood from a point p. More details on
how the DBSCAN works can be found in (Ester et al.,
1996).
The DBSCAN clustering stage provides a set of
clusters. As shown in Figure 1, the obtained clus-
ters are represented with white spots. The points in
the border of the clusters are projected to their equiv-
alent pixels in the image captured by camera. Each
cluster will generate a ROI in the corresponding im-
age. To transform the points in the border of a cluster
to their equivalent pixels, the calibration method pro-
posed in (Zhang and Pless, 2004) is used by consider-
ing the camera extrinsic and intrinsic parameters and
the LIDAR-camera coordinate transformation matrix.
3.2 ROIs Classification
Once the candidate ROIs are generated, they are given
to the classification module to classify them as pedes-
trians or non-pedestrians. In the classification mod-
ule, the computed features describing the pedestrian
are fed to a classifier in order to identify. The features
and classifier we adopt for the proposed method are
selected based on the experiments we perform on the
LIPD dataset (Premebida and Nunes, 2016).
3.2.1 Adaboost
Adaboost ”Adaptive Boosting” was introduced first
by Yoav Freud and Robert Schapire (Freund et al.,
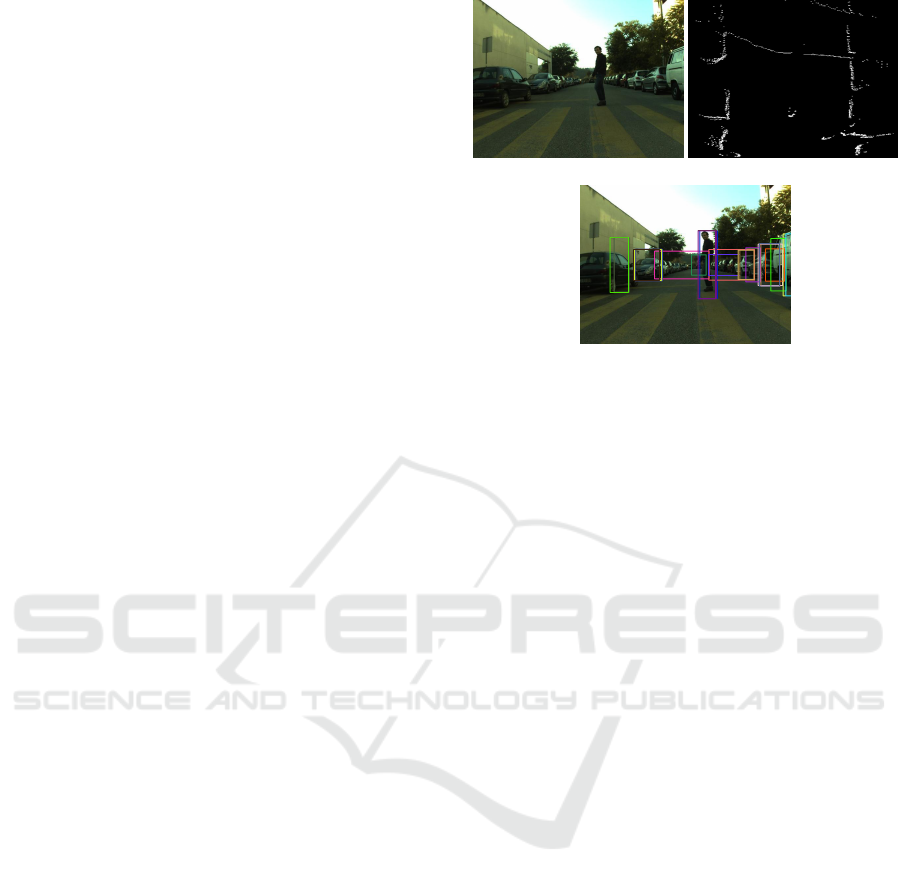
(a) (b)
(c)
Figure 1: (a) A visible image. (b) Its corresponding clus-
ters of range points using DBSCAN algorithm as seen from
above (upside view). (c) The mapped clusters on the visible
image.
1999) in an attempt to select a small number of critical
visual features from a very large set of potential ones.
It provides an effective learning algorithm and strong
bounds on generalization performance. Adaboost fo-
cuses new experts on examples that others get wrong
and it trains experts sequentially. The errors of early
experts indicate the hard examples. It focuses later
classifiers on getting these examples right. In the end,
the whole set is combined into one class, i.e., many
weak learners are converted into one complex classi-
fier.
3.2.2 Support Vector Machine (SVM)
SVM is a classifier derived from statistical learning
theory by Vapnik (Vapnik and Vapnik, 1998), and
some extensive introductions were presented later in
(Burges, 1998) and (Christiannini and Shawe-Taylor,
2000). SVM aims to separate the positive samples
(pedestrian) from negative ones (non-pedestrian). It
was introduced in the purpose of solving binary clas-
sifications. The training data are labelled {x
i
,y
i
},
where i = 1,...,nb, y
i
∈ {−1,1} , x
i
∈ {R
d
} .
In our case, the x
i
are the vectors computed by apply-
ing our proposed descriptor on the samples described
above. The values y
i
are “1“ for one class (pedestrian)
and “-1“ for the others, d is the dimension of the vec-
tor, and nb is the number of training vectors.
If a hyperplane {w, b} separates the two classes, the
points that lie on it satisfy x.w
T
+ b = 0 where w is
normal to the hyperplane, |b|/kwk is the perpendic-
ular distance from the hyperplane to the origin, and
kwk is the Euclidean norm of w.
In the separable case, the following constraints are
A Hybrid Pedestrian Detection System based on Visible Images and LIDAR Data
327
verified:
y
i
(x
i
.w
T
+ b) − 1 ≥ 0 ∀i = 1..nb. (1)
The points for which the equality in (1) holds are
located on the two hyperplanes: H1 : x
i
.w
T
+ b = 1
and H2 : x
i
.w
T
+ b = −1. Consequently, the margin
between the two data sets is equals 2/kwk. The mar-
gin can be maximized by minimizing between both
sets kwk
2
/2 under the constraints (1).
If we set positive Lagrange multipliers (α
i
,where
i = 1,...,nb) one for every of the inequality con-
straints, the objectif now will be to reduce or mini-
mize Lp given by:
Lp =
1
2
kwk
2
−
nb
∑
i=1
α
i
y
i
(x
i
.w
T
+ b) +
nb
∑
i=1
α
i
. (2)
Once the optimization is done, we can easily decide
on which part of the hyperplane a given test vector x
belongs.
The decision function is given by:
f (x) = sgn(x.w
T
+ b). (3)
Figure 2: The margin between the two datasets.
In this paper, we have utilized not only a linear
function but we used a Gaussian kernel as well, as
follows:
K(x
i
,x
j
) = e
−
kx
i
−x
j
k
2
2σ
2
(4)
and the decision function for a new input vector is :
f (x) = sgn(
N
s
∑
i=1
α
i
y
i
K(s
i
,x)+ b). (5)
3.2.3 Feature Extraction
Here we describe the features (HOG, LBP and LSS)
utilized in the second step of the proposed approach.
To decide which of those features could be used in the
pedestrian detection problem, a comparison is made.
The HOG (Dalal and Triggs, 2005) is one of the fea-
ture descriptors used in computer vision and image
processing aiming to detect an object in the image.
The fundamental idea behind the HOG descriptor is
that the local object appearance and shape within an
image can be depicted pretty well by the distribution
of intensity gradients or edge directions, even with-
out accurate knowledge of the corresponding gradient
or edge positions. A preprocessing step is performed
before the HOG computation by converting the image
into grayscale for the purpose of simplifying the com-
putations. However there are many disadvantages of
this conversion. This process removes all color in-
formation, leaving only the luminance of each pixel,
which means that the specific information captured in
the three color channels has been permanently lost,
affecting the quality of the HOG features. We believe
that extracting HOG from color images could enhance
the quality of the classification. The classical man-
ner of using the color information in HOG descrip-
tor is based on concatenating the obtained three HOG
vectors derived separately from the three color chan-
nels to create RGB-HOG descriptor. However, the
computed RGB-HOG is three times longer than the
grayscale HOG descriptor. Therefore, the required
computational time is proportionally increased.
In this paper, we introduce a new approach in
which we compute the HOG features using the color
components in such a way that the final descriptor
has the same size as the HOG descriptor computed
from grayscale images. As a result, we preserve the
color information without increasing the computa-
tional time. The new HOG descriptor, named HOG-
Color, will be computed by following the same steps
as the classical one (HOG derived from grayscale im-
age) excluding the gradient magnitude and orientation
step, where we use those corresponding to the color
component that maximizes the gradient magnitude.
Contrary to the grayscale-base HOG, the new
HOG descriptor is generated for the gradient values
computed based on the color information of the image
while preserving the same size as the classical HOG.
The second feature adopted in our experiments is
the LBP, which was introduced in (Ojala et al., 1996).
It describes the surrounding of a pixel by generating
a bit-code from the binary derivatives of a pixel. The
LBP operator labels the pixels of an image by thresh-
olding the 3 × 3 neighborhood of each pixel with the
center value and converts the result into a binary num-
bers defined by equation (6).
LBP(x
i
) =
T
∑
i=1
s(I
i
− I
c
)2
i
(6)
such that
s(I
i
− I
c
) =
1 I
i
− I
c
≥ 0
0 I
i
− I
c
≤ 0
. (7)
VISAPP 2018 - International Conference on Computer Vision Theory and Applications
328

where I
c
and I
i
are the grey value of image and T
is the total number of involved neighbours.
The performance of the HOG decreases when the
background is cluttered with noisy edge points (Ojala
et al., 1996). To avoid that, the concatenation be-
tween the HOG and LBP features is made in order
to create new features named HOG+LBP that allow
reducing the effect of the noise on the classification
results. Given that the result obtained by HOG-Color
is better than the classic grayscale HOG and RGB-
HOG, the concatenation HOG-Color with LBP called
HOG-Color+LBP is used instead of HOG+LBP and
RGB-HOG+LBP, respectively.
The third feature involved in this paper is LSS
(Shechtman and Irani, 2007). This feature has the
ability of capturing the internal geometric layouts of
local self-similarities within image, while accounting
for small local affine deformations as well as captur-
ing self-similarity of edges, color, repetitive patterns
and complex textures in a single unified manner. In
LSS features, we divide the chosen image into sev-
eral patches which, efficiently compared with a cell
located at center of the image. Then, we normalize
the obtained distance and we project it into the space
intervals divided by radial intervals and the number
of angle intervals. We take the extreme value in an
interval space as the value of the feature.
LSS features was concatenated with the HOG-
Color features to build a descriptor, called HOG-
Color+LSS. This descriptor is used by a classifier to
classify pedestrians.
In this paper, a comparison between many fea-
tures is made to determine which ones gives the best
results. First, we used a simple HOG on grayscale
image. Then, we computed the HOG from the col-
ored image named HOG-Color. Furthermore, the new
HOG-Color is combined with LBP to build an aug-
mented feature vector. Another combination of HOG-
Color with LSS is made to create one more feature
vector.
4 EXPERIMENTAL RESULTS
This section presents the results obtained by the pro-
posed approach. Different experiments have been per-
formed on the LIPD dataset to evaluate the perfor-
mances of the classifiers as well as the features intro-
duced in the preceding section. All the experiments
have been performed using the processor Intel (R)
core (TM) i5-2430M CPU 2.4 GHz.
4.1 Dataset
The Laser and Image Pedestrian Detection Dataset
(LIPD) (Premebida and Nunes, 2016) has been used
to test the performance of the proposed system.
The LIPD Dataset was collected in outdoor condi-
tions (the Coimbra Univeristy/ISR Campus zone). It
was recorded using Yamaha-ISR electric vehicle (IS-
RobotCar), equipped with a multilayer automotive
laserscanner Alasca-XT from Ibeo, a TopCon Hyper-
Pro GPS device in RTK mode, one IMU Mti from
Xsens and a monocular Guppy camera. The LIPD
dataset contains 4823 frames (one frame is composed
of one visible image and its corresponding LIDAR
data). The images format is 24-bit color jpg and their
size is 640 x 480 pixels.
4.2 Parameters Setting
The parameters involved in the various modules of
the proposed system were selected empirically using
images from LIPD dataset. In the first stage, two
parameters of DBSCAN clustering algorithm were
utilized: EPS and the minimum number of points
needed to compose a dense region (MinPts). Fig-
ure 3 (a) clarifies the number of true positives (TPs)
and Figure 3 (b) shows the computing time, while
varying these two parameters over 900 images chosen
from the LIPD dataset. Notice that a correct detected
person is counted true positive if its corresponding
bounding box overlaps with at least 70 % of the area
covered by the person present in the image. We ob-
serve that the number of true positives is not quite
sensitive to EPS parameter. However, the computing
time increments with these two parameters. EPS = 5,
and MinPts = 400 are chosen since they guarantee
high accuracy (more than 890 true positives) while
the computational time is at its lowest value (less than
40 ms).
To get the optimal parameters of the classifiers
utilized in the system, cross-validation experiments
have been achieved on a training dataset. The images
of the dataset are divided into a training and valida-
tion subsets. By training and testing the classifiers
on the two subsets using various parameters settings,
the parameters that enable to get the high classifi-
cation accuracy have been selected. The classifiers
have been retrained again using the chosen parame-
ters on the LIPD training dataset. In this work, we
use SVM with radial basis function (RBF) kernel with
C=2 and G=0.03. The classification accuracy varies
while changing the value of these two parameters and
become higher as these parameters reach the values 2
and 0.03, respectively, for all the features used.
A Hybrid Pedestrian Detection System based on Visible Images and LIDAR Data
329
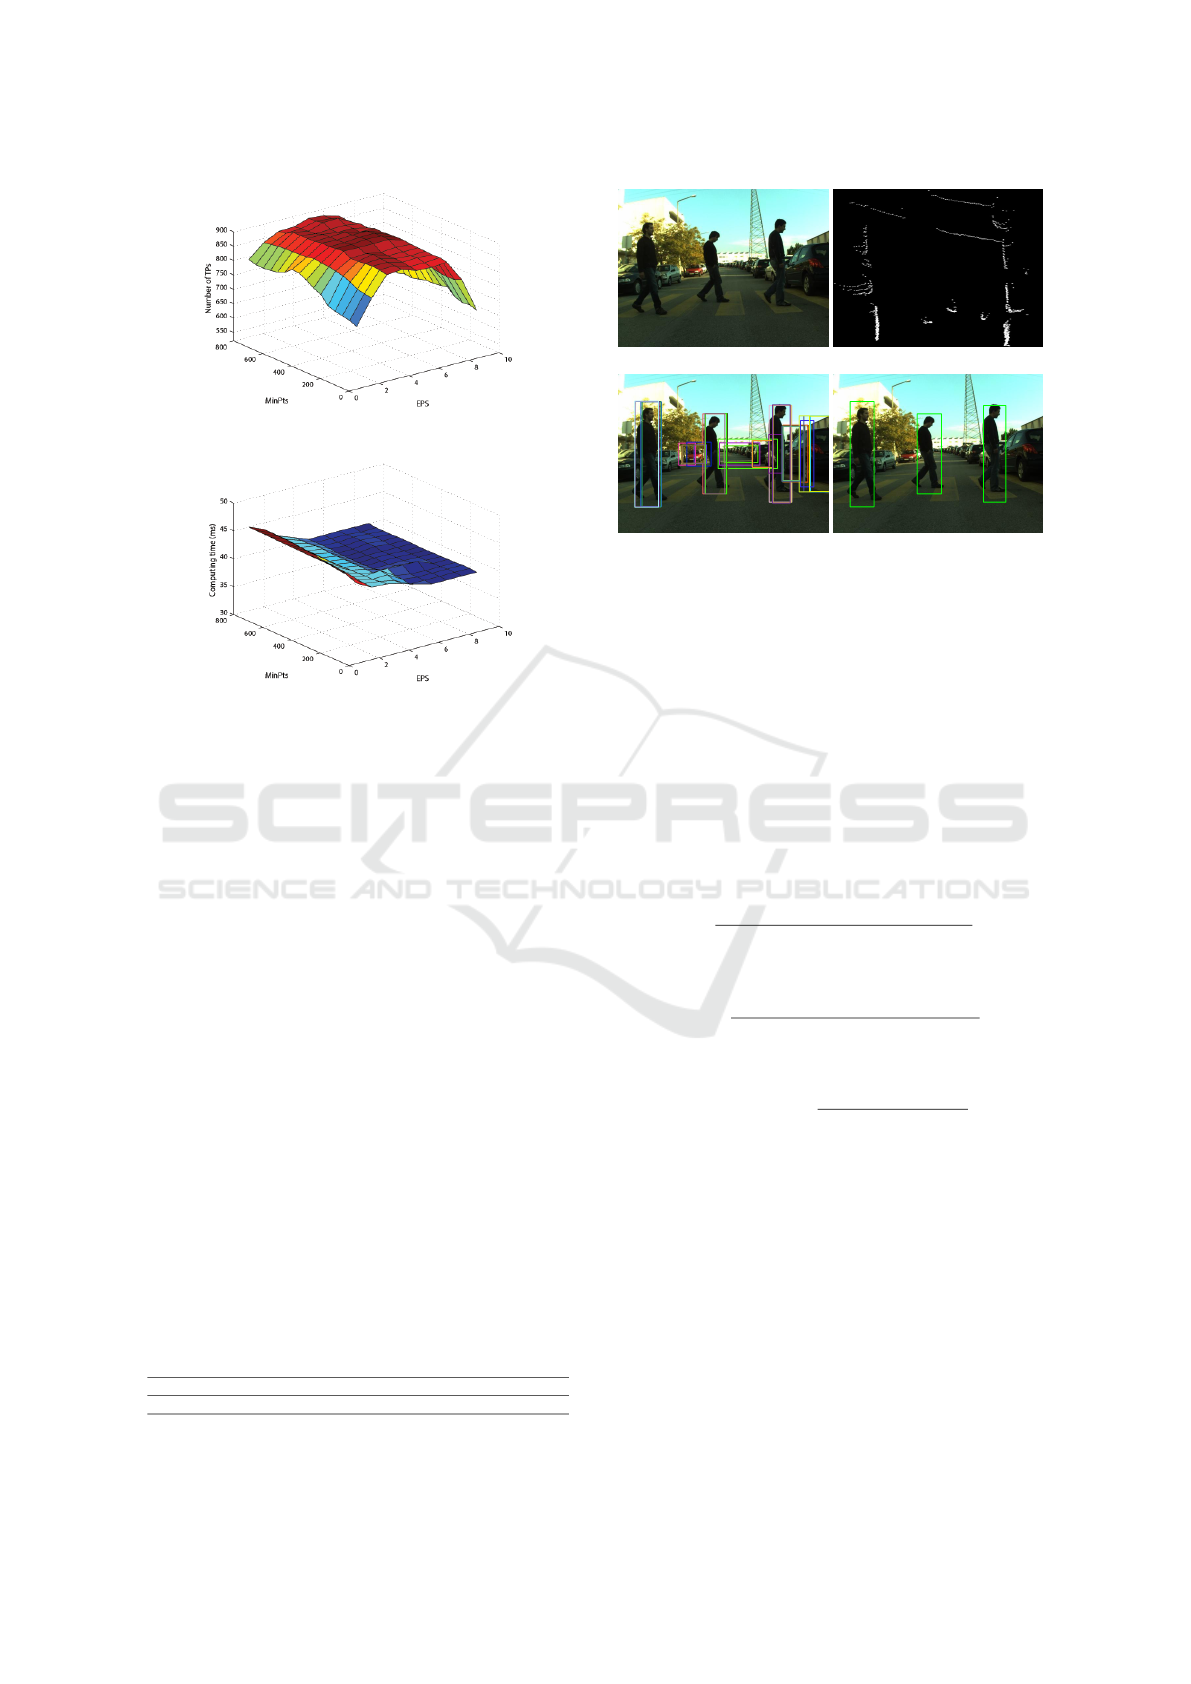
(a)
(b)
Figure 3: Number of TPs and the computing time while
changing EPS and MinPts.
4.3 Results
An example of detection results is provided in Figure
4. The algorithm takes an image (Figure 4 (a)) and
its corresponding 3D LIDAR data as input. The clus-
tering results are depicted in Figure 4 (b). The ROIs
obtained based on the mapping of the clusters (Fig-
ure 4 (b)) on the image (Figure 4 (a)) are showed in
Figure 4 (c). A number of ROIs were detected even
if they did not represent pedestrians meanwhile they
represented other objects in the road scene. In the aim
of rejecting these ROIs, we refer to the classification
step. The detected ROIs are classified into pedestri-
ans or non-pedestrians using the HOG-Color and LSS
features together with SVM classifier. The classifica-
tion results are illustrated in Figure 4 (d). Only three
ROIs have been classified as pedestrians, while the
other ROIs have been discarded. The green bound-
ing boxes correspond to the detected pedestrians. The
running time of each one of the previous steps is rep-
resented in Table 1. The required time for the whole
detection method is 39.82 + 49.11= 88.93 ms.
Table 1: The computing time of each step of the proposed
approach in ms/f.
ROIs extraction ROIs classification
Consuming time (ms) 39.82 49.11
(a) (b)
(c) (d)
Figure 4: (a) Original image. (b) Its corresponding clusters
generated from LIDAR data. (c) Clustering results mapped
into the visible image (ROIs). (d) Pedestrian detection re-
sults.
Three evaluations have been included in this pa-
per. First, to evaluate the performance of the pro-
posed HOG-Color and compare it with the classical
grayscale HOG and RGB-HOG. The second one eval-
uates the combination of the proposed HOG-Color
with each of LBP and LSS features to look for possi-
ble improvements. A comparison between the results
provided by the SVM and Adaboost classifiers is also
done. The precision, recall and F-measure, given be-
low, are used for the different evaluations.
Recall =
TruePositives
TruePositives + FalseNegatives
× 100
(8)
Precision =
TruePositives
TruePositives + FalsePositives
× 100
(9)
F − measure = 2 ×
Precision × Recall
Precision + Recall
(10)
Figure 5 (a) shows a sample input image used to
test the proposed pedestrian detection approach. The
clustering results we get when we apply the DBSCAN
technique to the corresponding LIDAR data are illus-
trated in Figure 5 (b). The generated ROIs after pro-
jecting the obtained clusters on the image are shown
in Figure 5 (c). To validate the detected ROIs, a clas-
sification was performed on the basis of the features
we have presented above. The classification results
helped us to select the appropriate feature as well as
the classifier to consider for the proposed method.
Table 2 illustrates the F-measure, the precision
and the recall values while using the various versions
VISAPP 2018 - International Conference on Computer Vision Theory and Applications
330
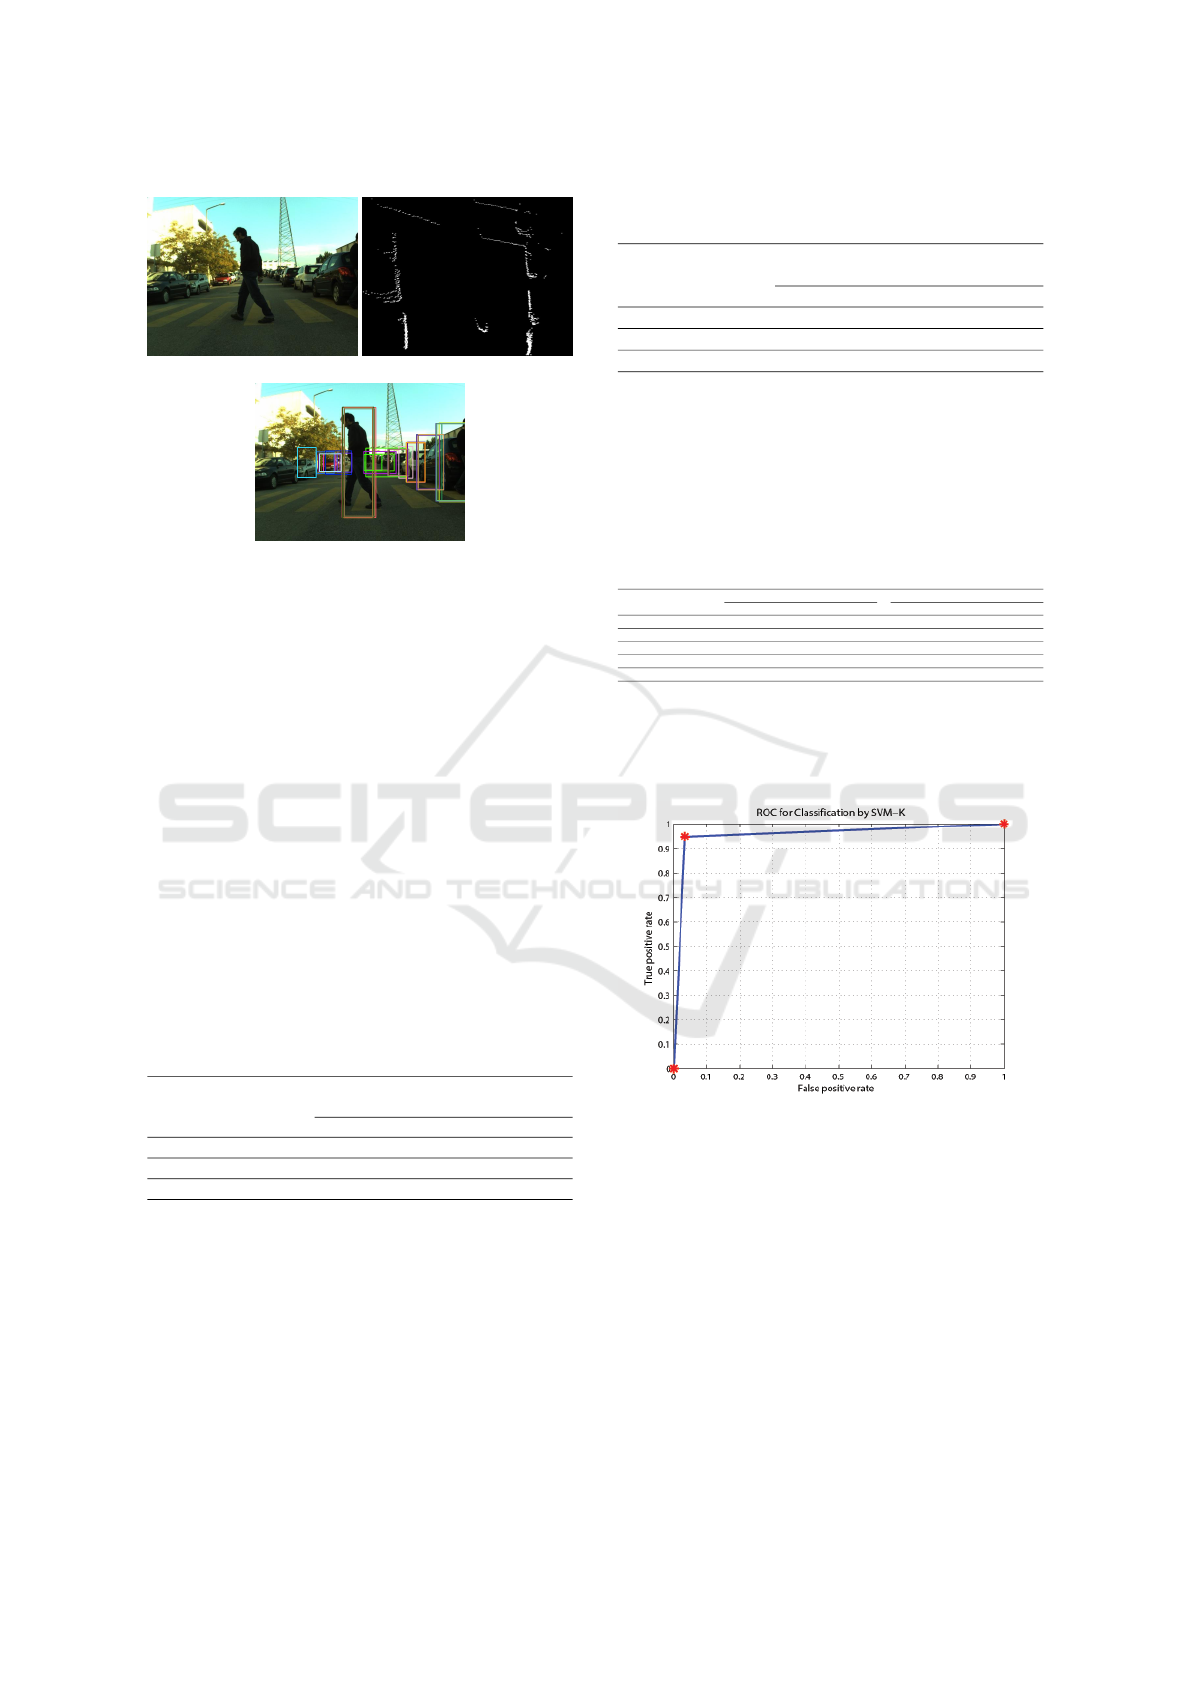
(a) (b)
(c)
Figure 5: Example of ROIs extraction step results. (a) Orig-
inal image. (b) DBSCAN algorithm results. (c) ROIs ob-
tained in the ROIs extraction step.
of the HOG features with the SVM classifier. Table 3
shows the results we get while using : (a) the HOG-
Color feature; (b) the combination HOG-Color and
LBP and (c) the combination HOG-Color and LSS. It
is obvious form table 2 that the HOG-Color outper-
forms the other features which confirms the impor-
tance of color information. The required time to com-
pute the HOG-Color feature is 46.98 ms. However,
the rates illustrated in Table 3 show that the combina-
tion HOG-Color and LSS has the best performance
compared to the other features and their combina-
tions. It achieves 95.47% recall, 94.83% precision
and 95.15% F-measure in only 49.11 ms/f. Therefore,
we take advantage of this combination in the classifi-
cation step of the proposed approach.
Table 2: Performance of each feature descriptor on LIPD
dataset.
Feature Performance on LIPD
dataset
Precision Recall F-measure
GRAYSCALE-HOG 93.33% 93.80% 93.56%
RGB-HOG 93.83% 94.94% 94.38%
HOG-Color 94.33% 94.97% 94.65%
In order to justify the utilization of the SVM with
radial basis function (RBF) kernel as classifier, a com-
parison with SVM linear and Adaboost classifiers is
made. Table 4 shows the comparison results in terms
of F-measure and consuming time. We notice that
the combination HOG-Color and LSS outperforms all
the other features. It achieves 95.15%, 94.51% and
92.61% using SVM-K , SVM-L and Adaboost classi-
fiers, respectively. The Adaboost classifier gives the
best consuming time (only 47.08 ms), however, the
Table 3: Performance of each feature descriptor on LIPD
data set.
Feature Performance on LIPD
dataset
Precision Recall F-measure
HOG-Color 94.33% 94.97% 94.65%
HOG-Color+LBP 94.50% 95.13% 94.81%
HOG-Color+LSS 94.83% 95.47% 95.15%
F-measure rate of the combination HOG-Color and
LSS feature is low (92.61%) compared to the other
classifier. Therefore, the SVM-K classifier is adopted
as classifier in the classification step of the proposed
method.
Table 4: The F-measure and the average running time of the
classifiers used in this work.
Feature F-measure(%) of all data set Run time (ms/frame)
SVM-K SVM-L Adaboost SVM-K SVM-L Adaboost
GRAYSCALE-HOG 93.56 92.60 91.00 47.02 47.76 45.95
RGB-HOG 94.38 93.30 91.29 50.82 57.73 48.85
HOG-Color 94.65 93.92 92.12 46.98 47.74 45.92
HOG-Color+LBP 94.81 94.17 92.28 49.81 50.61 47.83
HOG-Color+LSS 95.15 94.51 92.61 49.11 49.95 47.08
Figure 6 shows the Receiver Operating Character-
istic curve obtained by the new system for pedestrian
detection. It attains 95.86% AUC for LIPD dataset on
average run time of 8-10 frames per second.
Figure 6: ROC curve of the proposed method when applied
to LIPD dataset.
More detection results are represented in Figure 7.
Figures 7 (a) and (b) depict the test images. The cor-
responding clustering results using the LIDAR points
are shown in Figures 7 (c) and (d). Figures 7 (e) and
(f) show the extracted ROIs after projecting the deter-
mined clusters on the images in Figures 7 (a) and (b),
respectively. Among all generated ROIs, only two at
each image are considered as pedestrians (Figures 7
(g) and (h)). The other ROIs are rejected in the classi-
fication step. The detected pedestrians are shown on
the corresponding test images by the means of green
bounding boxes.
A Hybrid Pedestrian Detection System based on Visible Images and LIDAR Data
331
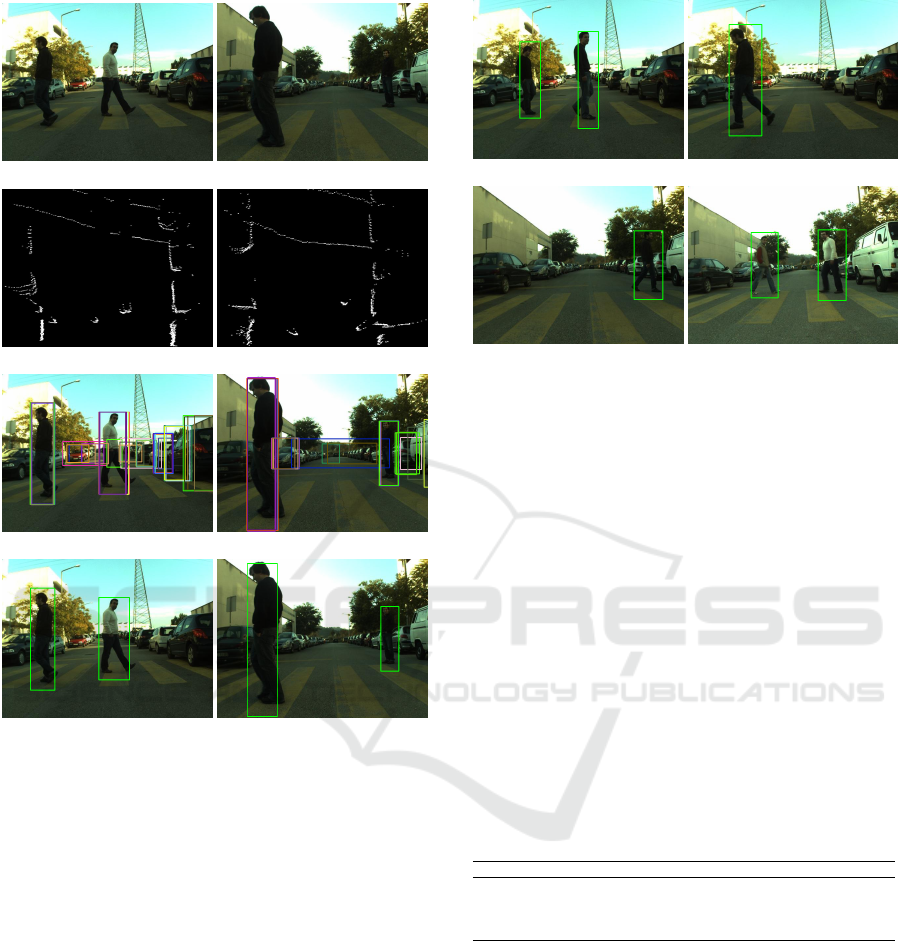
(a) (b)
(c) (d)
(e) (f)
(g) (h)
Figure 7: Example of detection results. (a) and (b) Original
images. (c) and (d) The corresponding clusters of range
points using DBSCAN algorithm. (e) and (f) Extracted
ROIs. (g) and (h) ROIs classification results.
4.4 Performance Comparison with
State of the Arts
A comparison versus some state-of-the-art works is
given to evaluate the performance of the proposed
method. Such a comparison has been conducted with
the methods illustrated in (Gao et al., 2015; Preme-
bida et al., 2009a; Premebida et al., 2009b) using the
LIPD dataset. The classification accuracies achieved
by the earlier methods as well as the proposed method
are presented in the Table 5. The method illustrated in
(Premebida et al., 2009b) presents a system to detect
pedestrians using the trainable fusion method FGMM
as combination of Gaussian Mixture Model (GMM)
and Fisher’s Linear Discriminated Analysis classifiers
(FLDA). A layered graph model in D-depth domains
(a) (b)
(c) (d)
Figure 8: Detection results.
and RGB-image are used in (Gao et al., 2015) to
detect and track the pedestrians. The last approach
(Premebida et al., 2009a) included in the table per-
forms the detection using only LIDAR-based features
with Minimization of InterClass Interference (MCI)
for Neural Networks (NN) classifier (MCI-NN).
We can notice from the table that the proposed
method achieves a higher accuracy than the other sys-
tems (95.86 %). The accuracy of the method pre-
sented in (Premebida et al., 2009a) is 93.10%. Al-
though the computational cost of the methods pro-
posed in (Premebida et al., 2009b) and (Gao et al.,
2015) is much higher compared to the proposed sys-
tem as a result of using the LIDAR-based features and
vision-based features simultaneously, their accuracies
is only 89.92% and 87.70%, respectively.
Table 5: Comparison between the proposed method and
other published methods using LIPD data set.
Method CCR (%)
LIDAR-GMMC/vision-FLDA (Premebida et al., 2009b) 89.92
LGM (Gao et al., 2015) 87.70
MCI-NN (Premebida et al., 2009a) 93.10
The new method 95.86
Figures 8 and 9 illustrate some other examples of
detection results while using the proposed method to
images of LIPD dataset. In Figure 8, the pedestrians
included in the four images have been successfully
detected. In Figure 9, the pedestrians could not be de-
tected due to different reasons. The pedestrians were
too far which make the LIDAR sensor incapable to
measure properly their distances. Consequently, their
corresponding ROIs won’t extracted.
VISAPP 2018 - International Conference on Computer Vision Theory and Applications
332
(a) (b)
Figure 9: Examples of misdetections.
5 CONCLUSION AND
PERSPECTIVES
In this paper, a two steps pedestrian detection system
is presented. In the first step, we generate ROIs based
on clustering the data provided by a LIDAR sensor.
Next, we project the obtained clusters on the corre-
sponding visible image. In the second step, we com-
bine the so-called HOG-Color with LSS feature to
build a new descriptor. This descriptor is then used
with the SVM classifier to detect pedestrians from
the ROIs. Experimental results illustrate that the pro-
posed system achieves AUC of 95.86% on the LIPD
dataset.
Although the proposed method proves its effec-
tiveness compared to recent state of-art ones, we are
planning in the future to extend it by using the 3D LI-
DAR data not only to generate the ROIs but to im-
prove classification step as well. Furthermore, we
aim to ameliorate the system by employing other ma-
chine learning techniques to accelerate the classifica-
tion process.
REFERENCES
Arras, K. O., Mozos, O. M., and Burgard, W. (2007). Us-
ing boosted features for the detection of people in
2d range data. In Robotics and Automation, 2007
IEEE International Conference on, pages 3402–3407.
IEEE.
Burges, C. J. (1998). A tutorial on support vector machines
for pattern recognition. Data mining and knowledge
discovery, 2(2):121–167.
Cho, H., Rybski, P. E., Bar-Hillel, A., and Zhang, W.
(2012). Real-time pedestrian detection with de-
formable part models. In Intelligent Vehicles Sympo-
sium (IV), 2012 IEEE, pages 1035–1042. IEEE.
Christiannini, N. and Shawe-Taylor, J. (2000). Support vec-
tor machines and other kernel-based learning meth-
ods.
Dalal, N. and Triggs, B. (2005). Histograms of oriented gra-
dients for human detection. In Computer Vision and
Pattern Recognition, 2005. CVPR 2005. IEEE Com-
puter Society Conference on, volume 1, pages 886–
893. IEEE.
Dietmayer, K. C., Sparbert, J., and Streller, D. (2001).
Model based object classification and object tracking
in traffic scenes from range images. In Proceedings of
IV IEEE Intelligent Vehicles Symposium, volume 200.
Douillard, B., Fox, D., and Ramos, F. (2007). A spatio-
temporal probabilistic model for multi-sensor object
recognition. In Intelligent Robots and Systems, 2007.
IROS 2007. IEEE/RSJ International Conference on,
pages 2402–2408. IEEE.
Elguebaly, T. and Bouguila, N. (2013). Finite asymmetric
generalized gaussian mixture models learning for in-
frared object detection. Computer Vision and Image
Understanding, 117(12):1659–1671.
Ellahyani, A. and El Ansari, M. (2017). Mean shift and log-
polar transform for road sign detection. Multimedia
Tools and Applications, pages 1–19.
Ellahyani, A., El Ansari, M., and El Jaafari, I. (2016). Traf-
fic sign detection and recognition based on random
forests. Applied Soft Computing, 46:805–815.
Ester, M., Kriegel, H.-P., Sander, J., and Xu, X. (1996).
A density-based algorithm for discovering clusters in
large spatial databases with noise. In Kdd, pages 226–
231.
Freund, Y., Schapire, R., and Abe, N. (1999). A short in-
troduction to boosting. Journal-Japanese Society For
Artificial Intelligence, 14(771-780):1612.
Friedman, J., Hastie, T., Tibshirani, R., et al. (2000). Addi-
tive logistic regression: a statistical view of boosting
(with discussion and a rejoinder by the authors). The
annals of statistics, 28(2):337–407.
Gao, S., Han, Z., Li, C., Ye, Q., and Jiao, J. (2015). Real-
time multipedestrian tracking in traffic scenes via an
rgb-d-based layered graph model. IEEE Transactions
on Intelligent Transportation Systems, 16(5):2814–
2825.
Gidel, S., Checchin, P., Blanc, C., Chateau, T., and
Trassoudaine, L. (2008). Pedestrian detection method
using a multilayer laserscanner: Application in urban
environment. In Intelligent Robots and Systems, 2008.
IROS 2008. IEEE/RSJ International Conference on,
pages 173–178. IEEE.
Lahmyed, R. and El Ansari, M. (2016). Multisensors-based
pedestrian detection system. In AICCSA.
Lim, J. and Kim, W. (2013). Detecting and tracking of mul-
tiple pedestrians using motion, color information and
the adaboost algorithm. Multimedia tools and appli-
cations, 65(1):161–179.
Lowe, D. G. (2004). Distinctive image features from scale-
invariant keypoints. International journal of computer
vision, 60(2):91–110.
Mazoul, A., El Ansari, M., Zebbara, K., and Bebis,
G. (2014). Fast spatio-temporal stereo for intelli-
gent transportation systems. Pattern Anal. Appl.,
17(1):211–221.
El Ansari, M., Mousset, S., and Bensrhair, A. (2010). Tem-
poral consistent real-time stereo for intelligent vehi-
cles. Pattern Recognition Letters, 31(11):1226–1238.
A Hybrid Pedestrian Detection System based on Visible Images and LIDAR Data
333

El Jaafari, I., El Ansari, M., Koutti, L., Mazoul, A., and El-
lahyani, A. (2016). Fast spatio-temporal stereo match-
ing for advanced driver assistance systems. Neuro-
computing, 194:24–33.
Ilyas El Jaafari, Mohamed El Ansari, and Koutti, L. (2017).
Fast edge-based stereo matching approach for road
applications. Signal, Image and Video Processing,
11(2):267–274.
Mikolajczyk, K., Schmid, C., and Zisserman, A. (2004).
Human detection based on a probabilistic assembly of
robust part detectors. Computer Vision-ECCV 2004,
pages 69–82.
Mu, Y., Yan, S., Liu, Y., Huang, T., and Zhou, B. (2008).
Discriminative local binary patterns for human detec-
tion in personal album. In Computer Vision and Pat-
tern Recognition, 2008. CVPR 2008. IEEE Confer-
ence on, pages 1–8. IEEE.
Ojala, T., Pietik
¨
ainen, M., and Harwood, D. (1996). A com-
parative study of texture measures with classification
based on featured distributions. Pattern recognition,
29(1):51–59.
Papageorgiou, C. and Poggio, T. (1999). Trainable pedes-
trian detection. In Image Processing, 1999. ICIP 99.
Proceedings. 1999 International Conference on, vol-
ume 4, pages 35–39. IEEE.
Premebida, C., Ludwig, O., and Nunes, U. (2009a). Ex-
ploiting lidar-based features on pedestrian detection
in urban scenarios. In Intelligent Transportation Sys-
tems, 2009. ITSC’09. 12th International IEEE Confer-
ence on, pages 1–6. IEEE.
Premebida, C., Ludwig, O., and Nunes, U. (2009b). Lidar
and vision-based pedestrian detection system. Journal
of Field Robotics, 26(9):696–711.
Premebida, C. and Nunes, U. (2006). A multi-target track-
ing and gmm-classifier for intelligent vehicles. In
Intelligent Transportation Systems Conference, 2006.
ITSC’06. IEEE, pages 313–318. IEEE.
Premebida, C. and Nunes, U. (2016). Laser and
image pedestrian detection dataset - lipd.
http://www2.isr.uc.pt/ cpremebida/dataset/.
Prieto, M. S. and Allen, A. R. (2009). Using self-organising
maps in the detection and recognition of road signs.
Image and Vision Computing, 27(6):673–683.
Sch
¨
olkopf, B. and Smola, A. J. (2002). Learning with ker-
nels: support vector machines, regularization, opti-
mization, and beyond. MIT press.
Shechtman, E. and Irani, M. (2007). Matching local self-
similarities across images and videos. In Computer Vi-
sion and Pattern Recognition, 2007. CVPR’07. IEEE
Conference on, pages 1–8. IEEE.
Spinello, L. and Siegwart, R. (2008). Human detection
using multimodal and multidimensional features. In
Robotics and Automation, 2008. ICRA 2008. IEEE In-
ternational Conference on, pages 3264–3269. IEEE.
Streller, D. and Dietmayer, K. (2004). Object tracking and
classification using a multiple hypothesis approach.
In Intelligent Vehicles Symposium, 2004 IEEE, pages
808–812. IEEE.
Tang, S. and Goto, S. (2010). Histogram of template for hu-
man detection. In Acoustics Speech and Signal Pro-
cessing (ICASSP), 2010 IEEE International Confer-
ence on, pages 2186–2189. IEEE.
Vapnik, V. N. and Vapnik, V. (1998). Statistical learning
theory, volume 1. Wiley New York.
Viola, P. and Jones, M. (2001). Rapid object detection using
a boosted cascade of simple features. In Computer Vi-
sion and Pattern Recognition, 2001. CVPR 2001. Pro-
ceedings of the 2001 IEEE Computer Society Confer-
ence on, volume 1, pages I–I. IEEE.
Viola, P. and Jones, M. J. (2004). Robust real-time face
detection. International journal of computer vision,
57(2):137–154.
Viola, P., Jones, M. J., and Snow, D. (2003). Detecting
pedestrians using patterns of motion and appearance.
In null, page 734. IEEE.
Wu, B. and Nevatia, R. (2005). Detection of multiple, par-
tially occluded humans in a single image by bayesian
combination of edgelet part detectors. In Computer
Vision, 2005. ICCV 2005. Tenth IEEE International
Conference on, volume 1, pages 90–97. IEEE.
Xavier, J., Pacheco, M., Castro, D., Ruano, A., and Nunes,
U. (2005). Fast line, arc/circle and leg detection from
laser scan data in a player driver. In Robotics and Au-
tomation, 2005. ICRA 2005. Proceedings of the 2005
IEEE International Conference on, pages 3930–3935.
IEEE.
Yang, T., Fu, D., and Pan, S. (2016). Pedestrian tracking
for infrared image sequence based on trajectory man-
ifold of spatio-temporal slice. Multimedia Tools and
Applications, pages 1–15.
Zhang, G., Gao, F., Liu, C., Liu, W., and Yuan, H. (2010).
A pedestrian detection method based on svm classi-
fier and optimized histograms of oriented gradients
feature. In Natural Computation (ICNC), 2010 Sixth
International Conference on, volume 6, pages 3257–
3260. IEEE.
Zhang, J., Li, F.-W., Nie, W.-Z., Li, W.-H., and Su, Y.-T.
(2016). Visual attribute detction for pedestrian detec-
tion. Multimedia Tools and Applications, pages 1–18.
Zhang, Q. and Pless, R. (2004). Extrinsic calibration
of a camera and laser range finder (improves cam-
era calibration). In Intelligent Robots and Systems,
2004.(IROS 2004). Proceedings. 2004 IEEE/RSJ In-
ternational Conference on, volume 3, pages 2301–
2306. IEEE.
Zhu, C. and Peng, Y. (2017). Discriminative latent semantic
feature learning for pedestrian detection. Neurocom-
puting, 238:126–138.
Zhu, Q., Yeh, M.-C., Cheng, K.-T., and Avidan, S. (2006).
Fast human detection using a cascade of histograms
of oriented gradients. In Computer Vision and Pat-
tern Recognition, 2006 IEEE Computer Society Con-
ference on, volume 2, pages 1491–1498. IEEE.
VISAPP 2018 - International Conference on Computer Vision Theory and Applications
334
