
Towards a Pre-diagnose of Surgical Wounds through the Analysis of
Visual 3D Reconstructions
Neus Muntaner Estarellas
3
, Francisco Bonin-Font
1
, Juan J. Segura-Sampedro
2
,
Andres Jim
´
enez Ram
´
ırez
3
, Pep L. Negre Carrasco
1
, Miquel Massot Campos
1
,
Francesc X. Gonzalez-Argent
´
e
2
and Gabriel Oliver Codina
1
1
Department of Mathematics and Computer Engineering, University of the Balearic Islands,
Ctra. Valldemossa Km 7.5, 07122 Palma de Mallorca, Spain
2
Department of General and Digestive Surgery, University Hospital Son Espases,
07122 Palma de Mallorca, Spain
3
Group of Ingenier
´
ıa Web y Testing Temprano, Department of Languages and Computing Systems, University of Sevilla,
c/ San Fernando 4, 41004 Sevilla, Spain
Keywords:
3D Visual Reconstruction, Structure From Motion, Post-surgical Wound, Telemedicine.
Abstract:
This paper presents a new methodology to pre-diagnose the state of post-surgical abdominal wounds based
on visual information. The process consist of four major phases: a) building dense 3D reconstruction of the
abdominal area around the wound, b) selecting an area close to the wound to fit a plane, c) calculating the
distance from each point of the 3D model to the plane, d) analyzing this map of distances to infer if the wound
is inflamed or not. This method needs to be wrapped in an application to be used by patients in order to save
unnecessary visits to the medical center.
1 INTRODUCTION
The emergency and the outpatient facilities of the
Spanish public health care system are usually col-
lapsed by the numerous of unnecessary visits to the
assistance centers that could be solved at home with
several indications given by the corresponding spe-
cialist.
In 2017, more than 3000 operations were done
in the University Hospital Son Espases, in Palma de
Mallorca, from which, only approximately the half of
them were programmed. That makes a mean of 250
patients per month, 63 patients per week, and 13 pa-
tients per day. If the consult mean time in Spain is
intended to range between 6 and 10 minutes, it makes
a mean of 2 hours a day dedicated only to take care
of post surgery wounds, without taking into consid-
eration the rests of tasks, such as, new patients, non
surgery patients, management meetings or emergen-
cies.
Every surgery patient is evaluated twice after the
surgical procedure. The first review is at the health
center after a week. And it is evaluated again one
month later as outpatient, at the hospital. One of the
main reasons for this evaluation is to check the surgi-
cal wound and detect its infection. However the rate
of infection is low and when it happens it is usually
detected in the emergency department.
This face-to-face consultations, where most of
them present no anomalies, could be easily managed
remotely, having a cheaper cost and affecting less
the patients’ quality of life, as they require unneces-
sary transfers to the health facility and absences from
work. Moreover, if the patient is unable to suspect
the wound infection on time, as it usually happens, an
increase of the emergency department consultations
is produced, normally with a delay in the wound in-
fection diagnosis which results in an increase of visit
time per patient.
Consequently, every technological progress in the
field of health care management, in general, and in the
post-surgery assistance in particular, is very useful to
reduce the costs, to improve the quality of assistance
time and thus to increase the quality of life of the
patients. Medical computer and mobile applications
focused on remote automatic diagnose and patient
management/monitoring have been advancing in the
last years citenephroflow, (Topdoctors, 2017). Lately,
some studies in telemedicine support the feasibility
and safety of remote follow-up in surgical wounds
Estarellas, N., Bonin-Font, F., Segura-Sampedro, J., Ramírez, A., Carrasco, P., Campos, M., Gonzalez-Argenté, F. and Codina, G.
Towards a Pre-diagnose of Surgical Wounds through the Analysis of Visual 3D Reconstructions.
DOI: 10.5220/0006628505890595
In Proceedings of the 13th International Joint Conference on Computer Vision, Imaging and Computer Graphics Theory and Applications (VISIGRAPP 2018) - Volume 4: VISAPP, pages
589-595
ISBN: 978-989-758-290-5
Copyright © 2018 by SCITEPRESS – Science and Technology Publications, Lda. All rights reserved
589
and the patients satisfaction (Segura-Sampedro et al.,
2017). In this later reference as well as in similar
studies (Nordheim et al., 2014), photos or videos of
the wound and filled questionnaires constitute the ex-
changed data between the patient and the doctor, but
is the doctor who always analyzes and evaluates the
received information. However, to our knowledge,
none of the revised methods or Apps is able to esti-
mate, automatically, a reliable pre-diagnose based on
visual data, and to filter out those wounds that clearly
present a good evolution, without the intervention of
the physician. Following this line, the Department of
General and Digestive Surgery of the University Hos-
pital Son Espases is collaborating with the Systems,
Robotics and Vision group of the University of the
Balearic Islands, in order to go one step forward in the
design and implementation of a vision-based mobile
App for telemedicine that can help in the estimation
of a pre-diagnose of abdominal post surgery wounds.
The objective is filtering, automatically, those wounds
that potentially present inflammation as sign of infec-
tion and need a face-to-face evaluation in the hospital
from those that course a normal evolution and can be
managed at home, saving time and medical resources.
The novelty of this work is more in the methodology
itself and the application than in the pipeline of visual
algorithms designed to get the objective. This method
needs to be wrapped into a future compact mobile
App, which will contain additional functionalities to
increase the communication and data exchange be-
tween doctors and patients.
The wound analysis process consists of a pipeline
that involves the next steps: a) grab a video sequence,
with the mobile, of the abdominal zone around the
wound, from side to side, viewing the same area but
from different perspectives and viewpoints, b) extract
images of the video sequence, c) extract and track
common visual features in all the images, d) build a
3D sparse point cloud using a Structure From Motion
(SFM) (Hartley and Zisserman, 2003) algorithm, e)
build a dense point-cloud and a textured meshed sur-
face, f) establish a polyline and a plane fitted in this
polyline in a selected portion of the 3D model; this
plane is intended to be, either tangent to the abdomen
surface, or crossing the abdominal area, below the
wound, g) compute the distance between each point
of the 3D model and the plane, and emit a diagnose
function of these distances.
2 METHODOLOGY
Firstly, the patient must record with the mobile tele-
phone a video of the wound, from side to side of the
abdominal area, in order to have views from different
perspectives and viewpoints. The second step is au-
tomatic and consist of extracting all the images from
the video sequence. Once the images have been ex-
tracted, the process of 3D reconstruction starts auto-
matically with the feature tracking process. The SFM
geometric theory (Hartley and Zisserman, 2003) is
based on the tracking of a set of world points pro-
jected in several images taken by the same camera
from different viewpoints. These projected points
and their correspondences in the subsequent images
are obtained thanks to a process of a classical visual
feature detection and matching (Hartley and Zisser-
man, 2003) using two reputed detectors invariant to
rotation and scale: one detector with scalar descrip-
tor, SIFT (Lowe, 2004), and one detector with binary
descriptors, ORB (Rublee et al., 2011). Both tech-
niques have proved extendedly his excellent perfor-
mance in terms of number of features, robustness and
traceability. Invariance to scale and rotation is impor-
tant for this kind of application since the image key
points must be identified in all frames of the video se-
quence, which show the affected area from different
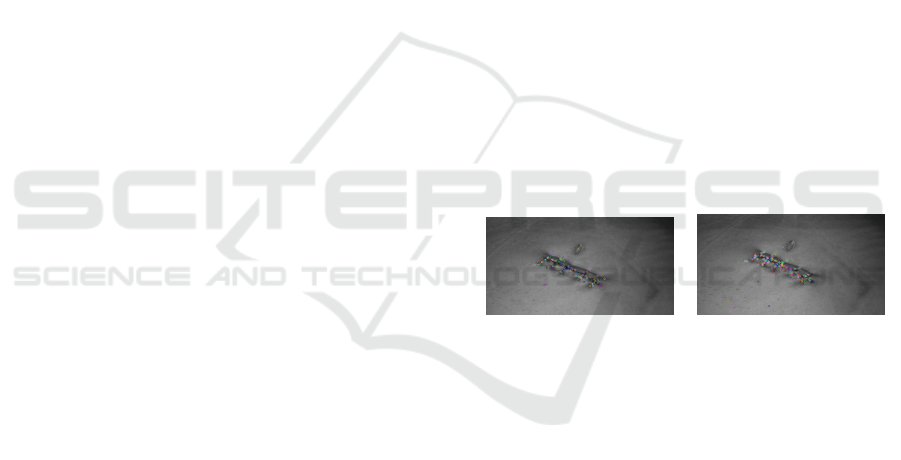
viewpoints. Figure 1 shows an image provided by the
University Hospital Son Espases of a surgical wound,
with the visual features obtained using the 2 different
detectors.
(a) (b)
Figure 1: Feature detection with: (a) SIFT, (b) ORB.
The feature detection with the 2 tested features has
been implemented with the feature detector OpenCv2
functions. The descriptor matching has been imple-
mented with the FLANN (Muja and Lowe, 2009)
matcher library. Good matches (inliers) are consid-
ered to be those which distance between correspon-
dences in different images is under a certain threshold
(typically, either 0.02 or 2 times the minimum dis-
tance between all the matches). Bad matches are dis-
carded.
Given the projection matrices, the 3D coordinates
of a world point can be obtained from its correspond-
ing image points (in this case visual features) identi-
fied in several views (matching) using triangulation.
Ideally, the 3D point should lie in the intersection of
all back-projected rays. But, in general, these rays
will not intersect in a single point due to the errors in-
herent to the feature matching process. The 3D coor-
dinates of the world point are obtained minimizing the
VISAPP 2018 - International Conference on Computer Vision Theory and Applications
590
sum of squared errors between the measured and the
predicted image positions of the 3D point projected
in all involved views where the world point is visible:
X = argmin
x
∑
i
ku
i
− ˆu
i
k
2
, where u
i
is the predicted
image point and ˆu
i
is the corresponding measured im-
age point, for all the i images where the 3D point is
projected. The predicted image point can be obtained,
for example, from the feature matching process, and
the measured point is directly the projection of the
world point on the image.
The library OpenMVG (Moulon et al., 2017) im-
plements the point triangulation and the 3D recov-
ery applying the SFM and the epipolar theories, re-
covering also the camera displacement, and has been
used to form sparse 3D point-clouds from input sets
of images. OpenMVS (cDcSeacave, 2017) provided
us with a complete set of algorithms to recover a full,
fine and textured surface from a set of camera poses
and a sparse point-cloud.
Figure 2 illustrates the image processing pipeline
designed and implemented to obtain a dense 3D
model of the recorded area. The four first steps have
been programmed with OpenMVG, and the last four
steps with OpenMVS. The SFM implementation is
based on (Moulon et al., 2013). This process is incre-
mental, which means that, the first reconstruction is
done only with two views, and at every iteration a new
view is incorporated adding features, some match-
ing with the previous and needing triangulation, some
new in the scene. The reconstruction with known
poses refers to the process of refining the 3D model
using the camera poses and the 3D point position rel-
ative to the know camera poses, once the SFM and
the camera motion have been computed. The point
cloud densification is based on (Barnes et al., 2009),
the mesh reconstruction is based on (Jancosek and
Pajdla, 2014), the mesh refinement is based on (Vu
et al., 2012), and finally, the mesh texturing is based
on (Waechter et al., 2014).
Figure 2: Image processing pipeline for wound 3D recon-
struction.
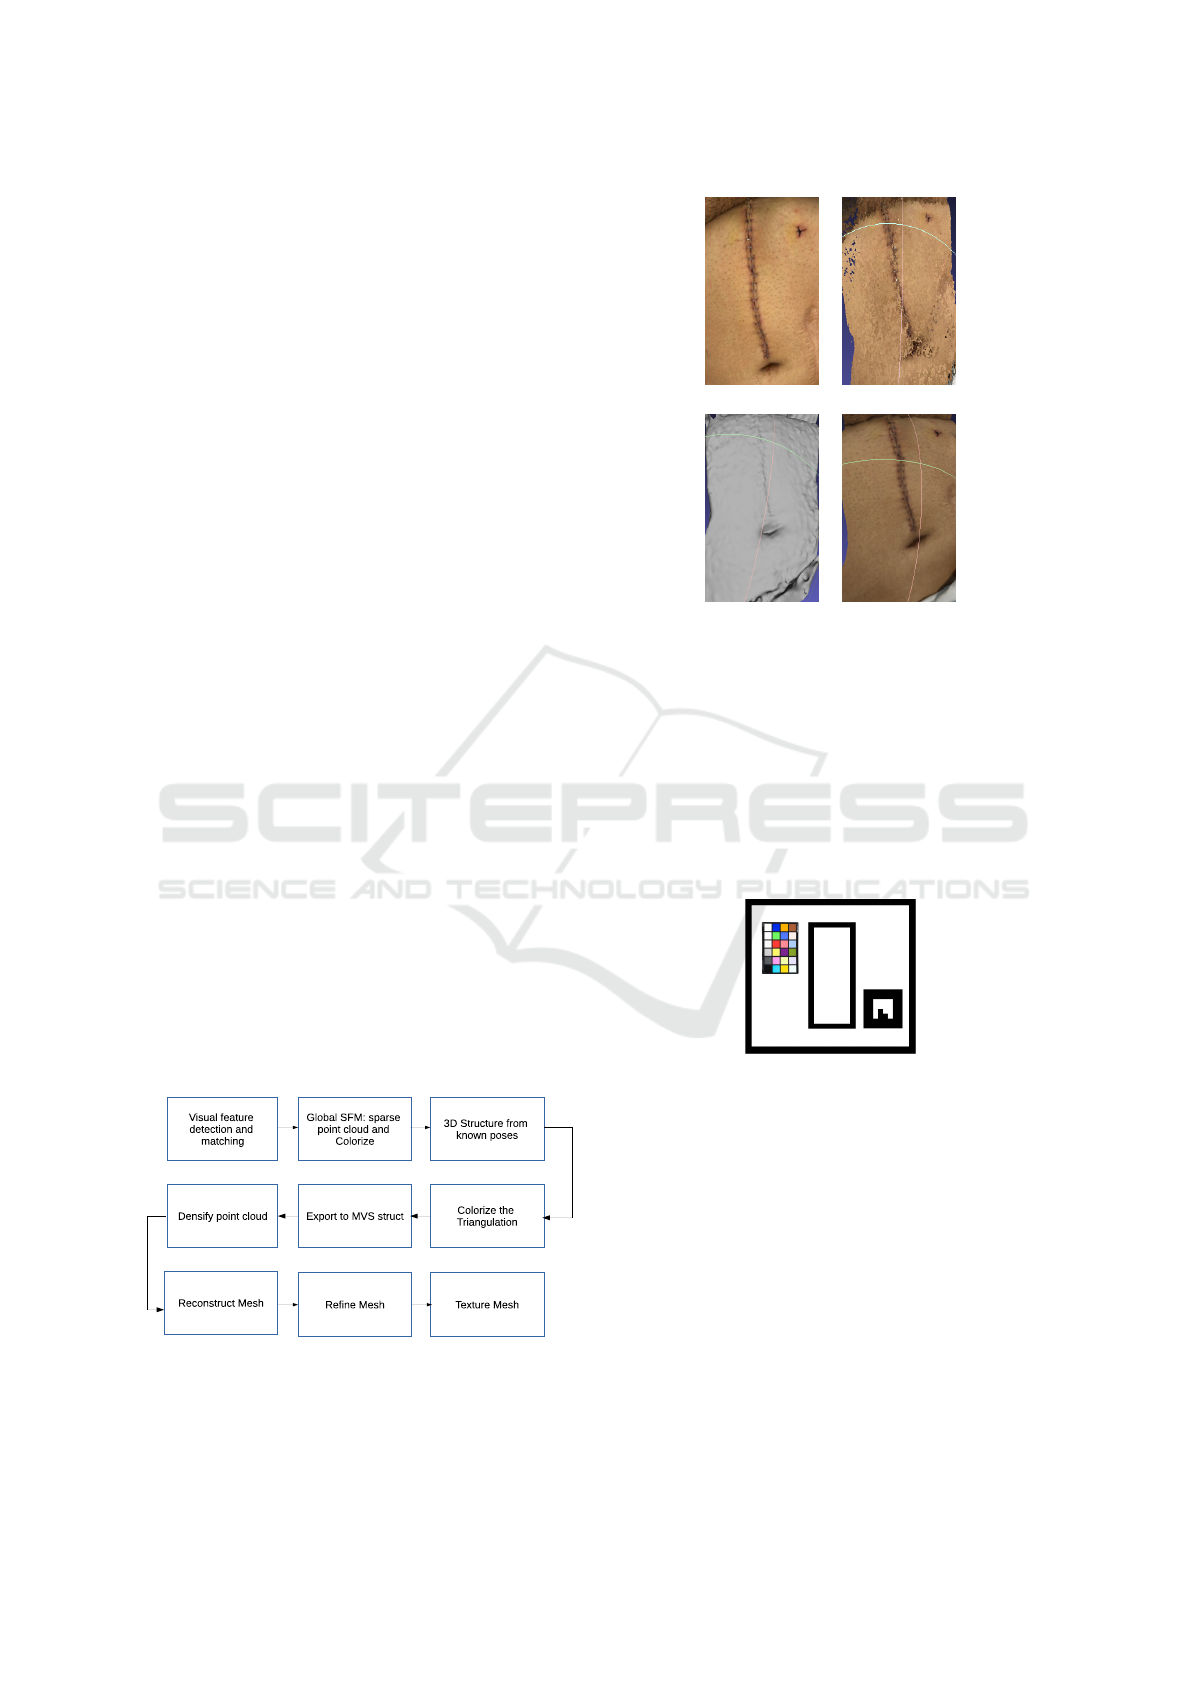
A 3D reconstruction of an abdominal area with
a post surgical wound is presented in figure 3 as
(a) (b)
(c) (d)
Figure 3: A result of the 3D reconstruction pipeline: (a) a
frame of the recorded video, (b) the dense point cloud, (c)
refined mesh, (d) refined and textured mesh.
a sample of the pipeline performance. 130 frames
were extracted from the video. One sample image is
shown in figure 3-(a) and the video can be seen in
https://youtu.be/XW18WMFZPTw. The appearance
of the reconstructed abdomen is highly realistic, but
without a metric scale it is impossible to infer the 3D
structure dimensions.
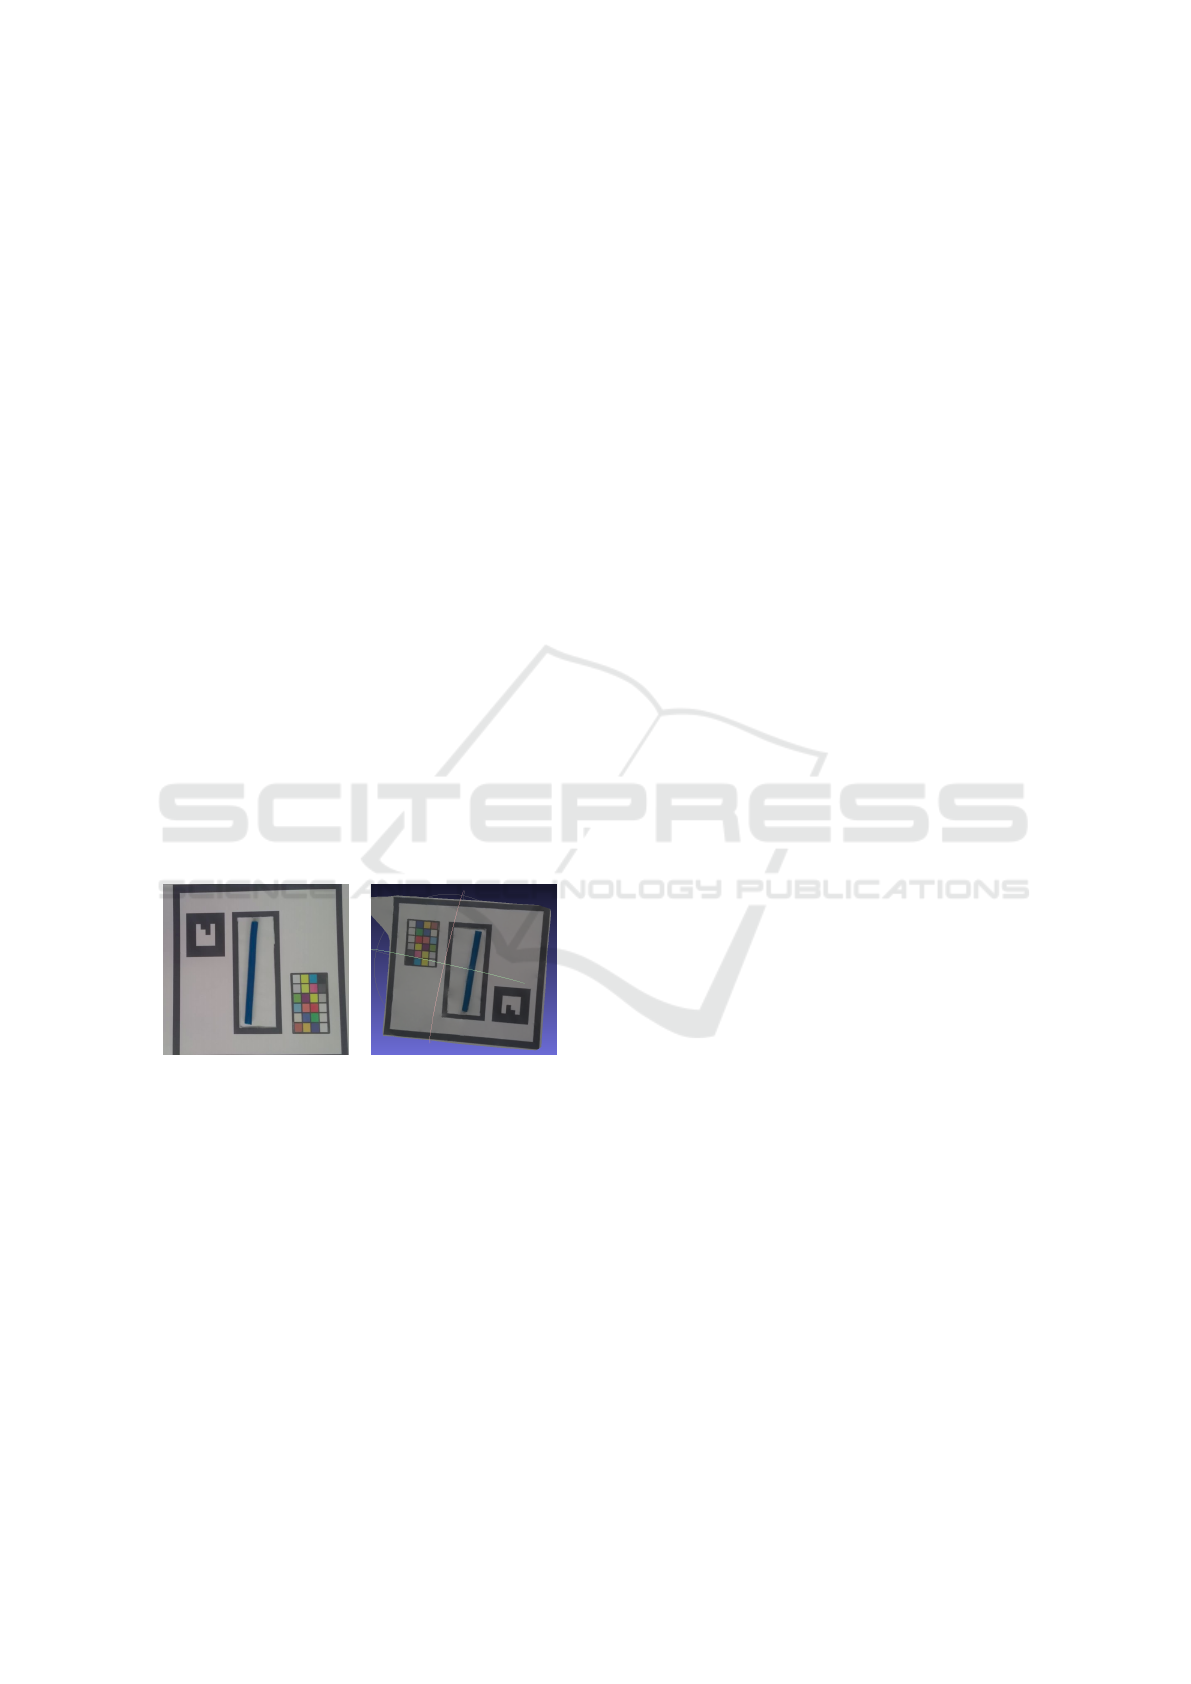
Figure 4: Template used to scale the obtained 3D model.
The obtained 3D model has no metrical units,
since it is computed from the images and the vi-
sual feature coordinates which are expressed in pix-
els. Converting these data into metrical data was nec-
essary to estimate the wound state from the 3D re-
construction. To this end, the geometric template of
figure 4 was designed. This template contains one
color calibration pattern, not yet used in this work,
one geometrical marker which side measures 3.1cm
and a rectangular hole in between. The template must
be placed on the abdomen with the wound falling
just inside the rectangular hole. Once the template
is correctly placed, the video can be recorded. The
scale ratio applicable to all reconstructed 3D points
can be calculated dividing the marker side real metric
Towards a Pre-diagnose of Surgical Wounds through the Analysis of Visual 3D Reconstructions
591
by its length measured in the 3D model. A sample
of a video recorded with the template can be seen at
https://youtu.be/INtkQlNXbu0.
In order to perform the last steps of the pipeline
which include the plane fitting and the distance calcu-
lation, the resulting 3D point cloud was opened with
Cloud Compare (Girardeau-Montaut, 2017). Using
this application, the 3D volume was cropped around
the wound and scaled according to the measures pro-
vided by the marker of the template (if it was avail-
able). Afterwards, a polyline was created inside the
processed 3D volume to fit a plane inside it. This
plane was intended to be, either coincident with the
plane of the marker, or parallel to it, tangent to the
abdomen surface, just at the wound base, or cutting
the abdomen surface in four points, below the wound.
Finally, the distance of each point of the cloud to the
fitted plane was calculated and exported to a csv file.
The analysis of these distances for each case leads to
an attempt of estimated diagnose.
3 EXPERIMENTS
In order to evaluate the complete procedure, some
simulated experiments were initially performed using
the template and a small cable with a diameter of 4mm
simulating an inflamed wound. Figure 5-(a) shows an
image of one simulated scene.
(a) (b)
Figure 5: Simulated wound: (a) an image of the simulated
scene, (b) the textured mesh.
The length of the marker side in the 3D recon-
struction, measured in Cloud Compare was 0.122898
units. Knowing that the real length of the marker side
is 3.1cm, the scale factor set in Cloud Compare for
the 3 directions (x, y, z) was 0.031(m)/0.122898 =
0.25224169m. In this case, the fitted plane was co-
incident with the plane of the marker. Figure 5-(b)
shows the textured mesh.
Figure 6 shows the selected volume in yellow (a),
the same volume with the fitted plane (border in white
and plane area in blue) in (b), and the spatial map
of distances between all points of the selected vol-
ume and the fitted plane, in (c). Notice how the pos-
itive (yellow-orange) distances range between 2mm
and 4mm, along the rectangle, clearly differentiating
the cable profile from the surrounding area (blue). Ly-
ing the fitted plane on the template, these positive dis-
tances coincide approximately with the cable diame-
ter.
Figure 7-(a) shows an image of another inflamed
wound simulated with a small cable. Figures 7-(b), 7-
(c) and 7-(d) show, respectively, the refined and tex-
tured mesh, the selected volume in yellow with the
polyline fitting plane in white and the map of dis-
tances from points to the plane. The scale factor re-
sulted in 0.031m/0.0611679 = 0.50680177m, being
0.0611679 the marker side length measured in Cloud
Compare. The map of distances shows clearly the
linear shape of the simulated inflamed wound in the
center of the rectangle with positive distances around
3mm surrounded by points that mark negative dis-
tances below −4mm.
Figure 8-(a) shows the selected volume in yellow
around the wound of figure 3 with the polyline fitting
the plane in white. In this case, the plane intersects the
abdomen below the wound, in one part, and above,
in another. This is a case of a wound with a good
evolution, without inflammation. Figure 8-(b) shows
the corresponding map of distances to the fitted plane.
The central area in yellow indicates where the plane
is below the wound and the distance is bigger while
the extremes which tend to blue indicate where the
distance is smaller. In this case, the metric units and
values have no relevance. Since there are no points
in the center of the map that mark the shape of the
wound, one can conclude that most likely there is no
inflammation on the explored area.
Figure 9-(a) shows an image extracted from a
video of another example of post surgical wound with
a good evolution and no inflammation. In this case
the scale is also irrelevant. 35 images were extracted
to build the refined and textured 3D model, shown
in figure 9-(b). In this experiment, the plane was
fitted below the abdomen as shown in white in fig-
ure 9-(c). The map of distances is show in figure 9-
(d). The later shows clearly the difference between
the central area with positive distances corresponding
to the zone with maximum curvature of the abdomen
(maximum distance to the plane), and both sides (top
and bottom) where the distance between the plane and
the abdomen is minimum, without any part suggest-
ing the presence of any inflamed area in the form of
a transversal line of distances clearly above the rest.
These type of resulting plot would suggest to the pa-
tient and to the doctor, in principle, an unnecessary
face-to-face revision.
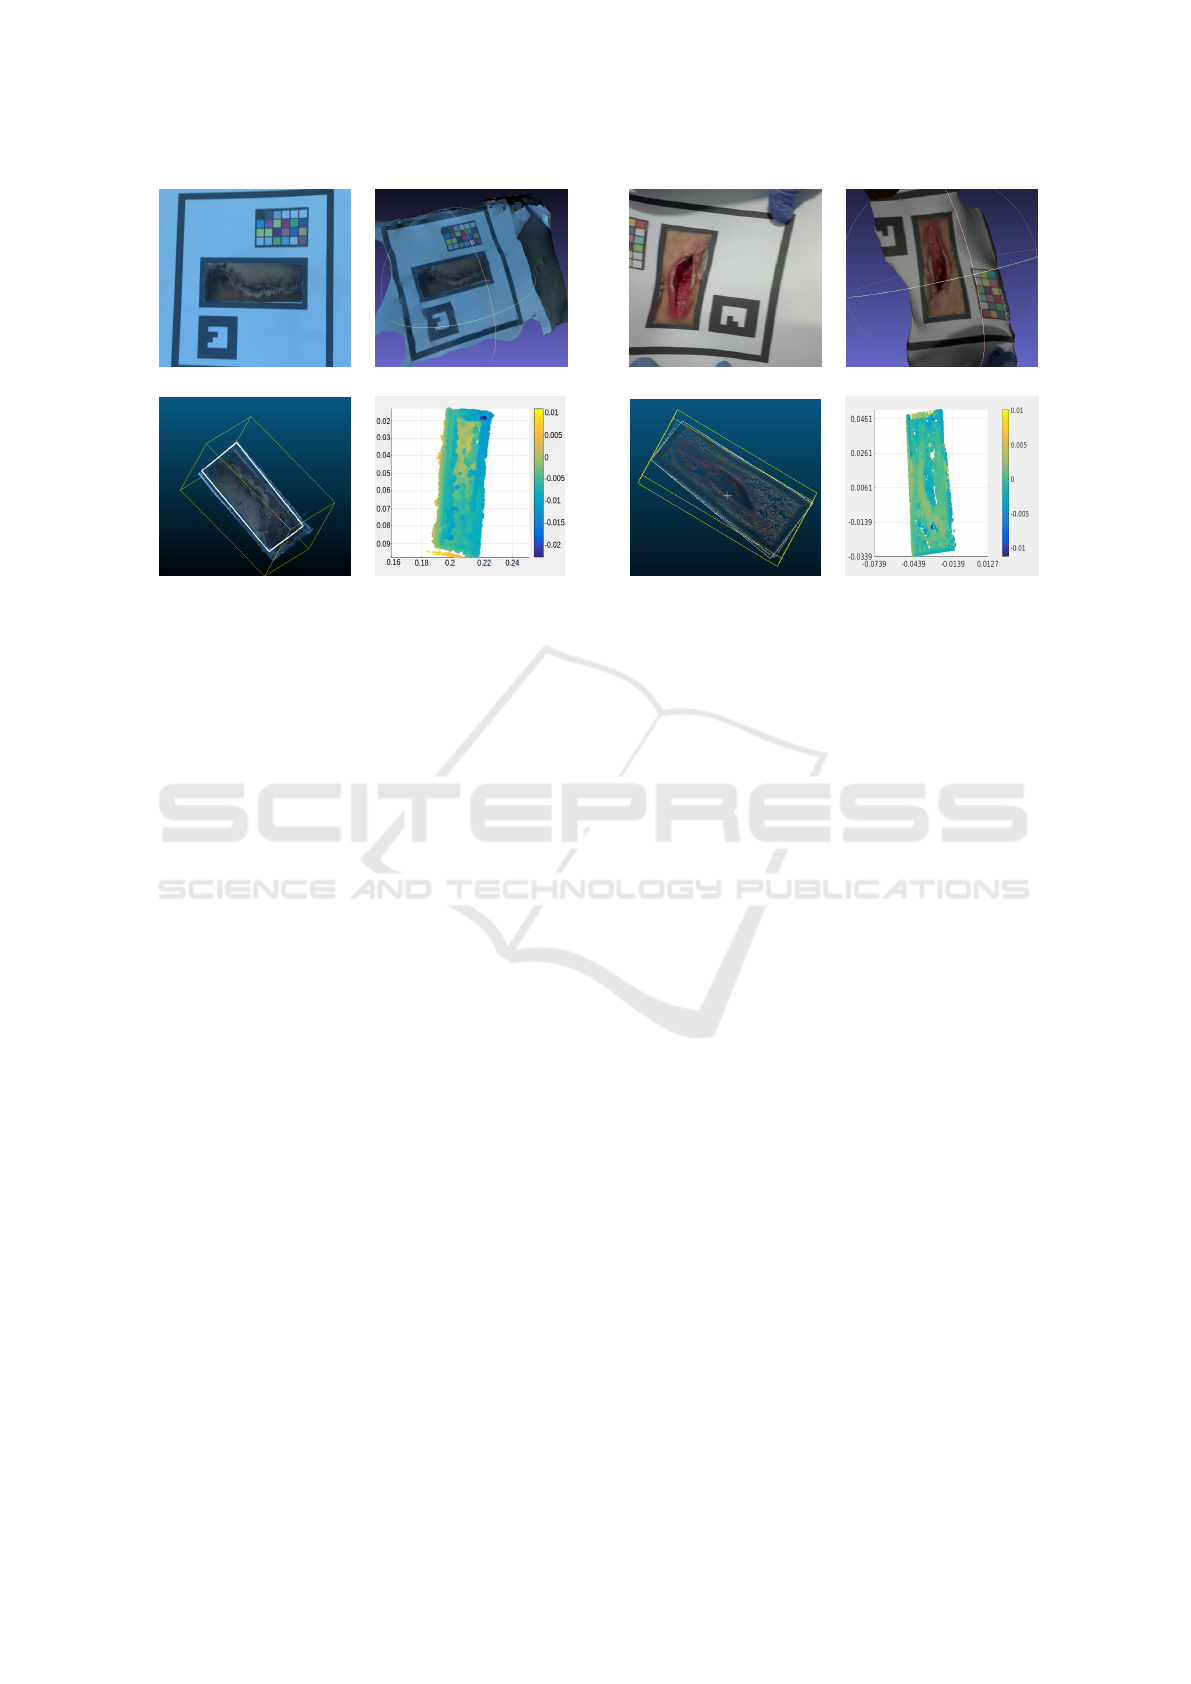
Figure 10-(a) shows an image extracted from
VISAPP 2018 - International Conference on Computer Vision Theory and Applications
592
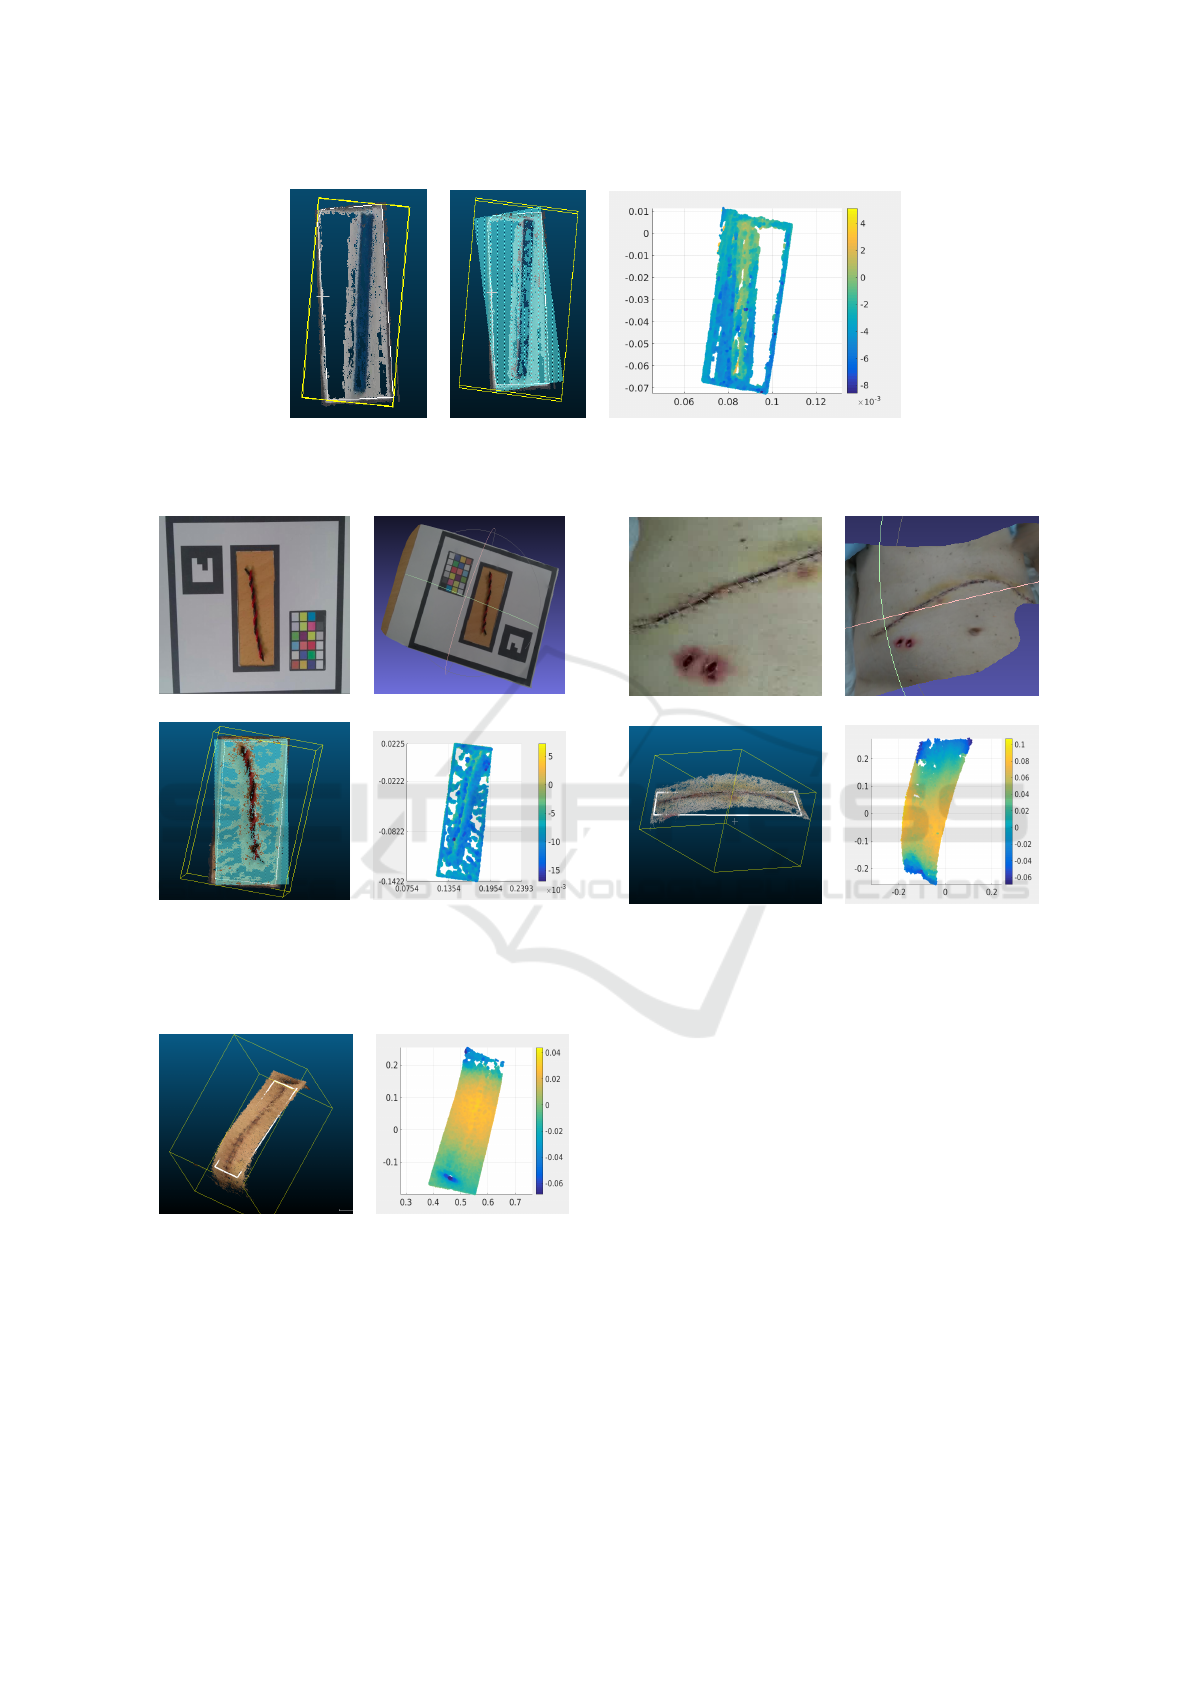
(a) (b) (c)
Figure 6: Simulated wound: (a) the selected volume and the polyline around it depicted in yellow, (b) the polyline in yellow
and the fitted plane in white, (c) map of distances from each point to the fitted plane.
(a) (b)
(c) (d)
Figure 7: Experiment 2: (a) an image extracted from the
video sequence, (b) refined and textured mesh, (c) the
wound with the fitted plane depicted in white, (d) Map of
distances from each point to the fitted plane.
(a) (b)
Figure 8: Experiment 3: wound of figure 3: (a) the wound
with the polyline and the fitted plane, (b) Map of distances
from each point to the fitted plane.
another experiment on a real post-surgical wound
grabbed with the template. In this case, the wound
presents an evident inflammation of several milime-
ters. 17 images were extracted from the video to
build the 3D model. The scaling factor turned out
(a) (b)
(c) (d)
Figure 9: Experiment 4: (a) an image extracted from the
video sequence, (b) refined and textured mesh, (c) the
wound with the fitted plane, (d) Map of distances from each
point to the fitted plane.
to be 0.359m in all directions. Figures 10-(b), 10-
(c) and 10-(d) show, respectively, the refined textured
mesh, the 3D model with the polyline in white fit-
ting the plane, coincident with the template central
hole, and the corresponding graphic of distances. The
later shows how the points located in the borders of
the rectangle present distances between −5mm and
−10mm, while in the middle, especially in the upper
part which coincides with the side of the wound that
has the marker at its left and it is clearly below the
plane, point distances range between 0mm and 5mm.
Although there is a clear gradient of distances be-
tween some parts of the center and the sides of the
evaluated area, susceptible of being pre-diagnosed as
inflamed, the shape of the wound is not clearly iden-
tified, being necessary a final and definitive diagnose
given by the doctor.
Towards a Pre-diagnose of Surgical Wounds through the Analysis of Visual 3D Reconstructions
593
(a) (b)
(c) (d)
Figure 10: Experiment 5: (a) an image extracted from
the video sequence, (b) refined and textured mesh, (c) the
wound with the fitted plane, (d) map of distances from each
point to the fitted plane.
Finally, figure 11-(a) shows one frame of a wound
which was opened due to an internal infection. Fig-
ure 11-(b), figure 11-(c) and figure 11-(d) show, re-
spectively, the refined and colored mesh, the 3D area
with the polyline fitting the plane, in white, and the
map of distances. The template was put just on the
skin, and the plane was fitted around the hole. The
distance map evidences a blue zone in the middle cor-
responding to the opened wound with distances be-
low the plane around 3mm (−3mm), surrounded by
a orange area with distances between 1mm and 4mm
above the plane corresponding to the skin. This gradi-
ent of distances marks clearly an anomaly in the area.
The position in which the template is placed on
the wound, its adjustment to the abdomen, and the
way the plane it fitted in the selected volume affects
clearly the obtained results. The procedure needs to
be refined, but the initial results are clearly encourag-
ing.
4 CONCLUSIONS
This paper has presented an innovative methodology
to estimate a previous diagnose of post-surgical ab-
dominal wounds using visual data. Although experi-
ments with simulated scenes reveal a clear difference
between the simulated infected wound and the back-
ground, results of experiments with real wounds are
still on a preliminary stage, but pointing in a clear
good direction. Now the challenge lies, mainly, in
(a) (b)
(c) (d)
Figure 11: Experiment 6: (a) an image from the video se-
quence, (b) refined and textured mesh, (c) the wound with
the fitted plane, (d) map of distances.
two different issues: a) refine the current process to
get clearer results, basically testing several possibili-
ties in the positioning of the template and in the gen-
eration of the fitted plane, and b) integrating this me-
thodology in a software package, which automatizes
all the stages of the process run manually with Cloud
Compare to be integrated in a users application.
ACKNOWLEDGEMENTS
This work is partially supported by Ministry of
Economy and Competitiveness under contracts
TIN2014-58662-R, DPI2014-57746-C3-2-R and
FEDER funds.
REFERENCES
Barnes, C., Shechtman, E., Finkelstein, A., and Goldman,
D. (2009). PatchMatch: A Randomized Correspon-
dence Algorithm for Structural Image Editing. ACM
Transactions on Graphics, 28(3):24:1–24:11.
cDcSeacave (2017). OpenMVS. Open Multi-
View Stereo Reconstruction Library.
https://github.com/cdcseacave/openMVS.
Girardeau-Montaut, D. (2017). Cloud Compare, 3D Point
Cloud and Mesh Processing Software Open Source
Project. http://www.danielgm.net/cc/.
Hartley, R. and Zisserman, A. (2003). Multiple View Geom-
etry in Computer Vision. Cambridge University Press.
Jancosek, M. and Pajdla, T. (2014). Exploiting Visibil-
ity Information in Surface Reconstruction to Preserve
VISAPP 2018 - International Conference on Computer Vision Theory and Applications
594

Weakly Supported Surfaces. International Scholarly
Research Notices, 2014.
Lowe, D. G. (2004). Distinctive Image Features from Scale-
Invariant Keypoints. Int. Journal on Computer Vision,
60(2):91–110.
Moulon, P., Monasse, P., and Marlet, R. (2013). Global
Fusion of Relative Motions for Robust, Accurate and
Scalable Structure from Motion. In Proceedings of the
International Conference on Computer Vision.
Moulon, P., Monasse, P., Marlet, R., and Others (2017).
OpenMVG. An Open Multiple View Geometry Li-
brary. https://github.com/openMVG/openMVG.
Muja, M. and Lowe, D. (2009). Fast Approx-
imate Nearest Neighbors with Automatic Algo-
rithm Configuration. Source code available at
https://github.com/mariusmuja/flann/.
Nordheim, L., Haavind, M., and Iversen, M. (2014). Ef-
fect of Telemedicine Follow-up Care of Leg and Foot
Ulcers: a Systematic Review. BMC Health Services
Research, 14(565):58–62.
Rublee, E., Rabaud, V., Konolige, K., and Bradski, G.
(2011). ORB: An Efficient Alternative to SIFT or
SURF. In Proceedings of the 2011 International Con-
ference on Computer Vision, pages 2564–2571.
Segura-Sampedro, J., I.Rivero-Belench
´
on, Pino-D
´
ıaz, V.,
S
´
anchez, M. R., Pareja-Ciur
´
o, F., Padillo-Ruiz, J., and
Rodr
´
ıguez, R. J. (2017). Feasibility and Safety of Sur-
gical Wound Remote Follow-up by Smart Phone in
Appendectomy: A Pilot Study. Annals of Medicine
and Surgery, 21:58–62.
Topdoctors (2017). Topdoctors. www.topdoctors.es/.
Vu, H., Labatut, P., and Pons, J. (2012). High Accuracy and
Visibility-Consistent Dense Multiview Stereo. IEEE
Transactions on Pattern Analysis and Machine Intel-
ligence, 34(5):889–901.
Waechter, M., Moehrle, N., and Goesele, M. (2014). Let
There Be Color! Large-Scale Texturing of 3D Recon-
structions. In Proceedings of the European Confer-
ence on Computer Vision, pages 836–850.
Towards a Pre-diagnose of Surgical Wounds through the Analysis of Visual 3D Reconstructions
595
