
Reconstructing Textureless Objects
Image Enhancement for 3D Reconstruction of Weakly-Textured Surfaces
Nader H. Aldeeb and Olaf Hellwich
Computer Vision & Remote Sensing Group, Technische Universit
¨
at Berlin, Berlin, Germany
Keywords:
3D Reconstruction, Weakly-Textured Surfaces, Image Enhancement, Denoising, Histogram Equalisation.
Abstract:
Photogrammetric techniques for 3D reconstruction of weakly-textured surfaces are challenging. This paper
proposes a new method to enhance image-based 3D reconstruction of weakly-textured surfaces. The idea
behind it is to enhance the contrast of images, especially in weakly-textured regions, before feeding them
to the reconstruction pipeline. Images contrast is enhanced using a recently proposed approach for noise
reduction. The dynamic range of the generated denoised-images has to be squeezed to the limited 8-bit range
that is used by the standard 3D reconstruction techniques. Dynamic range squeezing is a very critical process
and can lead to information losses, since many levels in the original range will no longer be available in the
limited target range. To this end, this paper proposes a new tone-mapping approach that is based on Contrast
Limited Adaptive Histogram Equalization (CLAHE). It amplifies the local contrast adaptively to effectively
use the limited target range. At the same time, it uses a limit to prevent local noise from being amplified. Using
our approach leads to a significant improvement of up to 400% in the completeness of the 3D reconstruction.
1 INTRODUCTION
In the presence of the accelerated developments of
modern digital cameras, automated image-based
3D reconstruction of scenes and objects has been
widely used in both commercial and research
fields. 3D reconstruction mainly depends on a well
known pipeline, called structure from motion (SfM)
/ multi view stereo (MVS). Generally speaking,
SfM/MVS pipeline includes feature detection,
feature description, feature matching, camera motion
estimation, bundle adjustment, and finally 3D points
estimation. It is worth mentioning that, the degree
of success of the pipeline depends mainly on both
feature detection and matching. The more key points
detected and correctly matched, the more accurate the
estimated camera motion and the more complete and
denser the generated 3D models are (Lu et al., 2017).
Therefore, we believe that feature detection and
matching are the most critical parts in any SfM/MVS
pipeline. Nowadays, because of the vast advances
in both feature detection and matching techniques,
it has been possible to generate accurate 3D models
of objects appearing in images in a relatively short
time and with little effort. Nevertheless, there are
some difficult surfaces where feature detection and
matching techniques fail. This leads to inaccurate or
incomplete 3D models. These problematic surfaces
include but are not limited to reflective surfaces,
weakly-textured surfaces, and their combinations
(Aldeeb and Hellwich, 2017).
This paper tackles the problem of 3D
reconstruction of objects having weakly-textured
surfaces. Particularly, it investigates the gain of
some image processing techniques to strengthen
the details in weakly-textured surfaces of objects in
order to facilitate feature detection and matching.
This in turn has a direct impact on improving the 3D
reconstruction of those objects.
In reality, there is no object having an untextured
surface. Therefore, failing to find feature points
and correspondences between image pairs is not
because of having no texture. The reason is
mostly either because of the low contrast of the
details on the surface which is not sufficient to
overcome the existing noise in the captured images,
or because of variations of the lighting conditions
from one image to the other. And so, this leads
to inaccurate 3D reconstructions. Consequently,
in order to overcome these problems, the first
goal of this research is to get rid, or at least
reduce the impact, of the noise that hides the
existing weak texture. Then, investigate image
processing techniques for enhancing the contrast of
572
Aldeeb, N. and Hellwich, O.
Reconstructing Textureless Objects - Image Enhancement for 3D Reconstruction of Weakly-Textured Surfaces.
DOI: 10.5220/0006628805720580
In Proceedings of the 13th International Joint Conference on Computer Vision, Imaging and Computer Graphics Theory and Applications (VISIGRAPP 2018) - Volume 5: VISAPP, pages
572-580
ISBN: 978-989-758-290-5
Copyright © 2018 by SCITEPRESS – Science and Technology Publications, Lda. All rights reserved

the restored weak-texture while trying to efficiently
exploit the range of the gray levels simultaneously.
Preferably if this contrast enhancement redistributes
the pixels over the gray levels as an attempt to
unify the lighting effect to show the hidden details
in over- and under-exposed regions. The outcome
of noise reduction and contrast enhancement leads
to a noticeable improvement in the image quality,
which in turn helps in improving the completeness
of the generated 3D models. An example is
shown in Fig. 1. This exemplary reconstruction
shows the point cloud (middle) generated using a
standard 3D reconstruction technique for one of the
challenging objects (speaker - left) that has a smooth,
homogeneous, and reflective surface, along with the
point cloud (right) generated using the proposed
approach.
Figure 1: Exemplary reconstruction: One view of the
object (left) along with 3D reconstructions using a standard
method (middle) and using our approach (right).
2 BACKGROUND AND RELATED
WORK
Image-based methods for reconstructing the 3D
geomentry of objects have been quite popular since a
long time. They are cheaper than other alternatives
like laser scanners, as they use standard cameras
and some computer vision tools (many of them are
free and non-commercial). Some of these methods
depend on the enhancement of the image’s quality
to ease the task of the 3D reconstruction of objects.
Quality-enhancement based methods can be divided
into either exploiting single image or multiple images
per viewpoint.
In a nutshell, single-image based
contrast-enhancement techniques were investigated
and proved an increase of the performance of feature
point detectors, as can be seen in (Lehtola and
Ronnholm, 2014). In addition, (Ballabeni et al.,
2015) experimented the impact of a couple of image
preprocessing techniques on the performance of
automated orientation and 3D reconstruction. They
concluded that image preprocessing pipeline that
includes image denoising, image color and content
enhancement, and color to Gray conversion can
efficiently and positively affect the performance of
the key-point matching tools.
There is not much work in the literature about
methods that make use of multiple images per
viewpoint. This is not surprising, as it is well
known in photogrammetry that the best image-pair
candidate should have a large common field of view
and not too small baseline. However, the principle
of using multiple images per viewpoint is already
used in generating High Dynamic Range (HDR)
images. Unfortunately, the entire dynamic range
of the real-life scenes usually cannot be handed by
standard cameras. They lead to clipping of the
large dynamic range into a smaller one. The basic
idea behind HDR imaging is to combine multiple
shots with different exposure times of the same scene
into a single radiance composition capturing a large
dynamic range (Debevec and Malik, 1997).
For no clear reasons, the advantages of the
HDR imaging are not much exploited in computer
vision applications, especially in multi-view stereo.
Although (Gomez-Gutierrez et al., 2015) showed that
there is no significant enhancement observed in the
generated 3D models when using HDR images in one
remote sensing application, in (Cai, 2013) advantages
of HDR photogrammetry were studied and validated
by means of laboratory experiments. It has been
concluded that HDR photogrammetry could benefit
many applications.
Among the few works who try to take advantage
of HDR images are the works of (Guidi et al., 2014),
(Kontogianni et al., 2015), and (Ley et al., 2016). In
(Guidi et al., 2014), image-acquisition and processing
techniques are experimented to enhance the contrast
in shiny and dark image regions simultaneously in
order to improve 3D reconstructions of vases and
plates of cultural heritage. To treat the problem of
shiny regions, for each viewpoint images are captured
with and without polarizing filters and merged into a
single HDR image, which is then tone-mapped into
an 8-bit image. Also, to treat dark regions (that
are usually clipped using Standard Dynamic Range
(SDR) images), HDR images are generated using 3
images per viewpoint with different exposure times.
Using their proposed approaches, they recorded an
improvement in the percentage of the matched feature
points.
In (Kontogianni et al., 2015), the impact of using
HDR images on key-points detection was tested.
They compared the performance and speed of feature
detection based on SDR images on one hand and
based on tone-mapped HDR images on the other
hand. Their results show a noticeable increase
in the number of the detected points when using
tone-mapped HDR instead of SDR images, with
almost no increase in time.
Reconstructing Textureless Objects - Image Enhancement for 3D Reconstruction of Weakly-Textured Surfaces
573

In (Ley et al., 2016), a new approach for the 3D
reconstruction of weakly-textured surfaces has been
proposed. A white wall and a textureless sculpture
have been tackled as two case studies. This approach
is trying to highlight the fine details on the target
objects. This is being achieved by first improving the
PSNR in weakly-textured regions by means of noise
reduction. Then, because the restored texture may
still be weaker than other strong textures originally
in the same image, they try to amplify it adaptively
based on the local variance using Wallis filter (Wallis,
1974).
In this paper, we use the idea of noise reduction
that is also used in (Ley et al., 2016). However, we
propose a new tone-mapping approach that amplifies
the local contrast adaptively to effectively use the
limited 8-bit target range. In the same time, this
paper proposes to use an amplification limit that is
based on the remaining local noise to prevent noise
amplification.
3 PROPOSED METHODOLOGY
The flowchart of the proposed approach is shown
in Fig. 2. This scenario has to be done per
viewpoint. Consequently, an image is generated for
each viewpoint. Later, the generated set of images for
all viewpoints can be fed into an SfM/MVS pipeline
(free and open-source implementations are VSFM
(Wu, 2013; Wu et al., 2011) followed by PMVS2
(Furukawa and Ponce, 2010)) for the sake of 3D
reconstruction.
Image 2
Image 1
Remove
FP noise
Image n
...
Remove
FP noise
Remove
FP noise
Average
Input FPN
removal
RN
removal
Color space
conversion
...
Tone mapping
Pick
single-band
CLAHE-based
mapping
Figure 2: Flowchart of the proposed approach.
As mentioned before, to assist 3D reconstruction
of weakly-textured surfaces, this paper first motivates
that texture by means of suppressing the noise that
might have a stronger measured signal than that of
the weak texture. Images are subject to two types of
noise; Fixed Pattern Noise (FPN), and Random Noise
(RN). FPN is camera dependent, spatially random,
and temporally constant process. RN is spatially
and temporally random process. The easiest way
to suppress the noise, i.e. increase SNR ratio, is
to handle each noise type separately. Therefore,
we first estimate the parameters of the FPN of the
used camera in order to reduce its impact on each
input image before being processed in the subsequent
stages. Then, to reduce the impact of the RN, this
paper uses the idea of averaging multiple exposures
per viewpoint. Images have to be captured in a way
that guarantees a highest possible alignment, using
stable tripods is recommended. Generally speaking,
assuming that our RN is independent and identically
distributed, the standard deviation of that noise can
be reduced by a factor of 1/
√
n if n images are
averaged. This means, noise will gradually decrease
by averaging more and more images.
It is worth mentioning that the idea of combining
multiple exposures to generate a higher quality image
is not new. It is already used to generate HDR
radiance maps as in (Debevec and Malik, 1997).
Also, the impact of using this idea on improving
3D reconstructions of relatively difficult objects
and weakly-textured walls has been investigated
respectively in (Guidi et al., 2014) and (Ley et al.,
2016) and proved to succeed. Also, the idea of
removing FPN before averaging has been investigated
by (Ley et al., 2016). Nevertheless, according to their
proposed approach for noise reduction, significant
gains of FPN removal can only be achieved if large
number of images are averaged per viewpoint. More
specifically, after about 30 to 40 images. This means,
if the number of shots acquired per viewpoint is less
than 30 images, FPN removal does not affect the
gain of noise reduction by averaging. On contrary,
according to the proposed approach in this paper,
the gain of FPN removal starts to appear even if the
number of images that are averaged per viewpoint is
small.
In this paper, in all processing stages or at
least after noise reduction stages, we propose using
single-band images. This way, we avoid any possible
losses of the achieved gain that might be caused later
by color conversion during the 3D reconstruction.
For each viewpoint, the outcome of noise
reduction is an HDR image with floating point
values. Unfortunately, there is almost no free
SfM/MVS pipeline that can take HDR radiance maps
as input. They only work on 8-bit images. Therefore,
it is required to map the tone of the generated
denoised-images into an 8-bit tone. But, because the
texture in that restored, hopefully noise-free, image
remains weak compared to other strong textures in the
same image, this paper proposes to further motivate
it by means of contrast enhancement processing
that also prevents the strong textures from being
VISAPP 2018 - International Conference on Computer Vision Theory and Applications
574

saturated. To these ends, this paper proposes a new
tone-mapping approach that is based on Contrast
Limited Adaptive Histogram Equalization (CLAHE)
(Zuiderveld, 1994). One more bonus point for using
CLAHE is that it enhances the details in the over-
and under-exposed regions simultaneously. This
will definitely facilitate feature matching process,
which in turn benefits the 3D reconstruction. In
the following subsections each stage of the proposed
approach will be discussed in more details.
3.1 Noise and Signal Model
Because electrical circuity of cameras is subject to
noise, cameras can generate image noise. In digital
imaging, signal and noise are subject to several other
processes like A/D conversion, demosaicing, color
correction, tone mapping, and JPG compression.
This will further complicate the nature of the noise
and make its separation a hard process. Luckily,
SfM/MVS pipelines are robust to these processes and
can work even if they are bypassed. Therefore, to
simplify noise modeling, this paper uses raw images
generated immediately after demosaicing. This also
eliminates the need to model complex processes. In
addition, raw images have a bonus point of being
richrer than the 8-bit JPG images.
Assume v(x,y) is the measured value of the pixel
at location x,y, and let e(x, y) be the corresponding
point in the real exposure, which we intend to
estimate. The relation between these two values can
be linearly expressed as seen in (1) by means of a
scale s(x,y) and an offset o(x,y).
v(x,y)
|{z}
output
= s(x,y)
|{z}
scale
·
e(x,y)
|{z}
input
+n(x,y)
|{z}
noise
+ o(x,y)
|{z}
offset
(1)
It is assumed that the additive noise has a zero mean
(i.e. E[n(x,y)] = 0). This means, if the expected
value of the noise should not be zero, it can be simply
modeled by the remaining terms, scale and offset.
We refer to the random and zero-mean noise term
n(x,y) as the random noise (RN). Also, we refer to the
pattern deviations caused by scales s(x,y) and offsets
o(x,y) as the fixed pattern noise (FPN). Accordingly,
given N images v
i
(x,y) per viewpoint, to estimate the
real exposure e(x,y), we first need to get rid of the
FPN in each of the images using (2) then suppress the
RN by averaging the N images using (3).
ˆe
i
(x,y) =
v
i
(x,y) −o(x,y)
s(x,y)
(2)
¯e(x,y) =
1
N
N
∑
i=1
ˆe
i
(x,y) (3)
3.2 Estimating FPN of the Sensor
One simple method to estimate the FPN of a camera
is to capture multiple images for a uniformly colored
surface that undertakes same and constant light
conditions. Then, the captured images are averaged
to reduce the effect of the random noise. After
averaging, it is supposed to have a homogeneous
image. Therefore, all deviations of pixels are assumed
as FPN. This approach has also been used by (Ley
et al., 2016). But for more accurate estimation of the
FPN, multiple exposure times are also considered. In
this paper, a number N = 80 of images are captured
for each of the used M = 7 stops. For each stop, an
expected true exposure is estimated by blurring the
average-image of that stop. Then all the estimated
true exposures are used to formulate a least squares
fit problem, which is then solved to estimate the FPN.
3.3 Using Single-band Images
As mentioned before, image-based 3D reconstruction
pipelines involve two core processes: feature
extraction and feature matching. Most of the used
feature extraction algorithms depend on measures that
are applied to the grayscale images. For instance,
SIFT uses Difference of Gaussians (DoG) method
which subtracts two blurred versions (different
blurring levels) of the same gray variant of the
original input image in order to extract local feature
points. This means, most of the ordinary 3D
reconstruction techniques consider only gray scale
images in one or more of the intermediate processing
stages. Hence, if the technique is fed color-images,
they might be converted to single-band images in
some processing stages. Many color conversion
methods have been proposed, but unfortunately none
of them is designed to fulfill the needs of image
matching algorithms, where the preservation of the
local contrast is very crucial. These methods merely
focus on plausible visual and perceptual accuracy.
Hence, the gain of the contrast enhancement methods
can be lost after color conversion (Ballabeni and
Gaiani, 2016).
In (Ley et al., 2016), identical processing chain
for contrast enhancement is applied to each of
the three color components independently. Then,
the enhanced 3 color components are merged into
one color-image that is used for reconstruction.
However, because of the aforementioned problem,
the gain of the enhancement methods might be lost
completely or partially. Moreover, applying the
same enhancement method on the three components
of colored images leads to severe changes in the
Reconstructing Textureless Objects - Image Enhancement for 3D Reconstruction of Weakly-Textured Surfaces
575

balance of the images color. This happens because
the relative distributions of the three channels are
broken as a consequence of arbitrarily applying the
same enhancement method. It can be claimed that
this argument is made for preserving perceptual and
visual accuracy. Nevertheless, we still see that it is
an important argument, as dramatic changes in the
color-image will definitely lead to dramatic changes
in its gray version. And consequently, will have
a direct impact on the performance of the feature
detection and matching of the reconstruction pipeline.
In this paper, to avoid any possible losses of the
signal fidelity, we apply our contrast enhancement
only on single-band images. More specifically,
the Green channel is used, as it contains all the
intensity information that are sufficient for SfM/MVS
pipelines. This applies only if the generated denoised
image is a color image. Otherwise, we proceed using
the same single-band image.
3.4 CLAHE-based Tone-mapping
As mentioned before, most SfM/MVS pipelines run
on 8-bit grayscale or color images. Therefore, the
dynamic range of each generated denoised-image has
to be tone-mapped or quantized into 8-bits. However,
dynamic range squeezing is a very critical process,
since many levels in the original range will no longer
be available in the limited target range. (Ley et al.,
2016) propose to filter the generated denoised-images
and remove the low-frequency components with the
aim of reserving the limited target range only for
high frequency components. This has been achieved
by applying an augmented version of Wallis filter
(Wallis, 1974). It normalizes the signal by subtracting
the local mean then amplifies the result adaptively
based on the local variance and remaining noise.
According to our point of view, the way by which the
amplification factor is defined can be problematic in
some regions. This is because different constants are
chosen apart from defining to which level the signal
is assumed weak and starting from which level it is
assumed strong. In addition, this Wallis filter-based
quantization approach performs poorly at region
boundaries, where the corresponding histograms are
mostly multi-modal. This happens because the used
Wallis-filter-based tone-mapping approach maps the
dynamic range just by scaling and shifting, and this
does not solve the multi modality of the histogram.
This paper alleviates the aforementioned
problems by employing a CLAHE-based method that
both enhances the contrast and maps the dynamic
range simultaneously. It amplifies the local contrast
adaptively for efficient use of the limited target range.
In addition, a contrast enhancement limit is used to
avoid the enhancement (amplification) of the noise
especially in homogeneous tiles.
The goal is to map each floating-point pixel in
the denoised-image into the limited target range,
while assigning it an optimal contrast. This is done
adaptively using a squared window sliding on the
input image and the amplification is done to the center
pixel of that window. Assuming that the window
covers n pixels (samples), the approach of histogram
equalization involves amplifying each sample, such
that it occupies one of the n intervals that have the
same width 1/n, while keeping its order among the
other samples. In detail, samples are first sorted in
an ascending order, then each of them is mapped to
the center of the corresponding interval. That means,
all samples undertake a linear mapping function of a
slope equals 1/n. However, this ordinary histogram
equalization approach does not discriminate the noise
from the real data, especially in homogeneous areas.
It may increase the contrast of the noise at the expense
of the real signal. To solve this problem, when
the amplification factor exceeds some amplification
threshold, the slope of the mapping function is scaled
down by a factor of that increase. This paper proposes
a maximum amplification threshold t(x,y) for a given
sample at (x,y), such that 3σ of the remaining local
noise range does not exceed 10/255 after signal
amplification, see (4-5).
t(x,y) =
10
255 ·3 ·
p
noise(x,y)
(4)
noise(x,y) = ˆn(x,y) ∗G
σ=10
(x,y) (5)
For each denoised-image ¯e(x,y), we estimate the
variance of the remaining noise ˆn(x, y) using the
set of N images v
i
(x,y) that are used to generate
that denoised-image. This is done by first adjusting
the brightness of each image v
i
(x,y) using (6), then
estimating ˆn(x, y) using (7).
v
0
i
(x,y) = v
i
(x,y) ·
¯e(x,y) ∗G
σ=10
(x,y)
v
i
(x,y) ∗G
σ=10
(x,y)
(6)
ˆn(x,y) =
1
N
2
N
∑
i=1
v
0
i
(x,y) − ¯e(x,y)
2
(7)
The amplification factor for a given input sample S
i
in
the sorted list of samples can be calculated as in (8).
F
i
=
1/n
m
in,i
(8)
Where m
in,i
is the slope of the current input sample
S
i
. This slope depends on the previous sample S
i−1
VISAPP 2018 - International Conference on Computer Vision Theory and Applications
576
and the next sample S
i+1
in the sorted list, and can be
calculated as seen in (9).
m
in,i
=
S
i+1
−S
i−1
2
(9)
Finally the output slop m
out,i
used for amplifying the
current input sample S
i
is determined as in (10)
m
out,i
=
(
1
n
, if F
i
≤ T
i
T
i
n·F
i
, otherwise
(10)
Where T
i
is the amplification limit of the current
sample S
i
and estimated as in (4-5).
4 EXPERIMENTAL EVALUATION
In this section, the effect of the proposed approach
on image-based 3D reconstruction methods will be
investigated. More specifically, the impact of noise
reduction and contrast enhancement on reconstructing
weakly-textured surfaces will be tested. Obviously,
an important aspect in this context would be
investigating the effect of the proposed approach on
feature detection and matching.
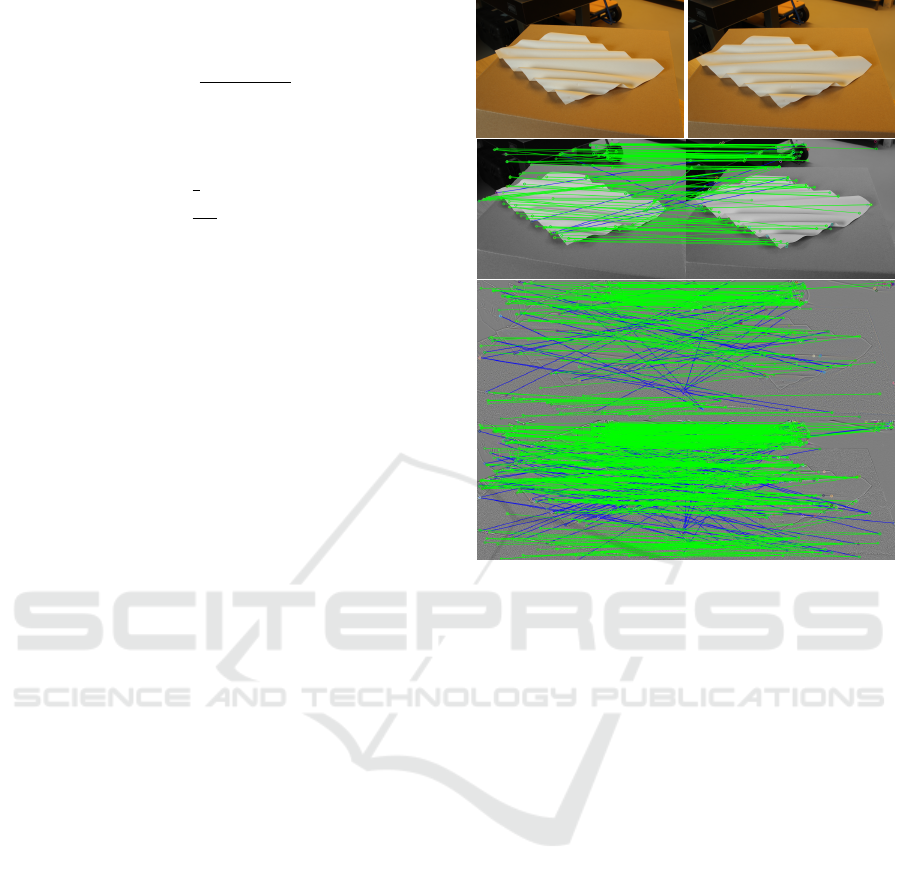
4.1 Impact on feature detection and
matching
Two images have been captured for one of the
problematic objects (see top of Fig. 3) and used
to compare the outcome of feature detection and
matching. It is worth mentioning that, some of the
detected features can be useless, as they might not be
correctly matched. Therefore, for accurate evaluation,
this section considers only inliers and discards
outliers. To this end, in each experiment, after
features have been detected using the SIFT algorithm,
5000 RANSAC iterations (using a threshold of 100
pixels) are used to find the best approximate of inliers
number. Fig. 3 depicts the results of matching the
detected features. The second row shows the results
after using no image enhancement. The third and the
fourth rows show the results after using (Ley et al.,
2016) approach on one hand and using our proposed
approach on the other hand. It is evident that such
kind of objects is one of the difficult objects. When
no image enhancement is used (second row of Fig.
3), 96 correct matches are found. However, there
is almost no feature point that has been detected
inside the object. Most of the detected points are
located near to the boundaries, where the contrast is
relatively strong. On the other hand, it is clear in the
third and fourth rows that feature detection has been
Figure 3: Impact of noise suppression and contrast
enhancement on feature detection and matching: First row:
Example image pair; second row shows matching of the
detected features when using neither noise suppression nor
contrast enhancement; third and fourth rows show matching
of the detected features after using (Ley et al., 2016) and our
approach respectively. Inliers (Green) and outliers (Blue).
improved after reducing the noise and enhancing the
contrast. However, more feature points have been
detected for images enhanced using our proposed
approach. Regarding feature matching, the number of
inliers has been increased by about 30% to become
125 inliers after processing the images using (Ley
et al., 2016) approach. But, when processing the
images using our approach, the number of inliers is
doubled by a percentage of 185% to become 274.
Which is 119% more than the number of inliers found
after processing the images using (Ley et al., 2016)
approach. This is one of the examples, where we can
see the benefit of using HE over Wallis filter. Most of
the newly added feature points are located in regions
where the pixels are non-uniformly distributed, and
mostly have a histogram of at least two peaks. The
Wallis-filter based approach of (Ley et al., 2016) will
produce a region having same kind of distribution of
pixels. That means, the contrast of many pixels is not
changed or damped. Therefore, the texture remains
weak and consequently features are not detected.
But using HE, pixels in those regions are adaptively
amplified such that the corresponding histogram is
Reconstructing Textureless Objects - Image Enhancement for 3D Reconstruction of Weakly-Textured Surfaces
577

uniform giving a chance for weak textures to be
enhanced, this leads to improving feature detection
and matching performance. Which in turn has a direct
effect on improving the completeness and accuracy of
the generated 3D models.
4.2 Wall Dataset
For fair comparisons and better evaluation of our
proposed approach, we use the same dataset that
is used for evaluating the approach of (Ley et al.,
2016). This dataset is for an indoor scene with
some furniture and a homogeneous, weakly-textured,
white wall in the background (see top row (left) of
Fig. 4). The scene has been captured from 7 different
viewpoints, where 30 images are taken for each
viewpoint. This subsection analysis the performance
of the proposed approach over the standard 3D
reconstruction approach. In mean while, it compares
the performance to that of (Ley et al., 2016) approach.
For the sake of explanation simplicity, we refer to
the standard approach (where a single image per
viewpoint is used) as S-1. For Wallis-based approach
of (Ley et al., 2016) and our HE-based approach we
use the notations W-N and H-N respectively, where N
is the number of the used images per viewpoint.
In this experiment, the pipeline SfM/PMVS2 is
used to generate the point clouds seen in Fig. 4.
The generated point cloud for the S-1 approach is
seen in the first row (right). Each of the rows from
two to seven shows the generated point clouds using
W-N (left) and H-N (right). Where, N increases for
each row as : 1, 2, 4, 8, 16, and 30. In addition,
to quantitatively evaluate the performance, Fig. 5
summarizes the total number of points in each point
cloud. As can be seen in Fig. 4 and Fig. 5, it is
clear that the more images provided per viewpoint,
the more complete the reconstructed models are.
This is because using more images leads to more
noise reduction. However, our proposed approach
outperforms the approach of (Ley et al., 2016) in the
sense that it needs smaller number of images to give
the same results. More precisely, our approach needs
half the number of images needed by the approach of
(Ley et al., 2016) to generate (at least) same number
of reconstructed points. Take for example H-8 gives
(474214) points compared to (453440) points for
W-16.
One more important advantage of our approach,
is its robustness to noise. This can be seen in
Fig. 4, second row corresponds to W-1 and H-1. In
these specific settings, it should be noted that images
are still suffering from random noise, because we
are using only one image per viewpoint. However,
our approach, H-1, was able to achieve more than
82% increase in the number of reconstructed points
(264251) compared to (142403) for S-1. At the same
time, the non-robustness to noise of the augmented
Wallis filter that is used in (Ley et al., 2016) leads
to 14% decrease in the number of the reconstructed
points (122627) using W-1 compared to (142403)
points using S-1.
Finally, it is worth mentioning that the maximum
number of 3D reconstructed points achieved by (Ley
et al., 2016) is (499321) using W-30. At that moment,
this maximum number was already exceeded by H-16
with (513481) points. Means, any further increase
in the number of points is exclusively recorded to
our approach giving a maximum number of 3D
reconstructed points of (580896) using H-30 (see the
last row of Fig. 4).
4.3 Sculpture Dataset
The Sculpture dataset contains images for a smooth
and weakly-textured sculpture of a girls head. The
top left of Fig. 6 shows an example image. This
sculpture has been acquired from 12 viewpoints with
30 images per viewpoint. In this experiment, we
generate dense point clouds of the sculpture using
S-1, W-N, and H-N for different numbers of images
N per viewpoint as: 1, 2, 4, 8, 16, and 30. Fig. 7
summarizes the number of reconstructed points for
each of the approaches. For better evaluation, points
are split into Sculpture (blue) and Background (red)
points. Considering the total number of reconstructed
points, it is evident that both our approach (H-N)
and (Ley et al., 2016) approach (W-N) outperform
the standard approach (S-1). However, our approach
outperforms that of (Ley et al., 2016). The number
of points (278612) reconstructed using S-1 has been
increased by approximately 63% using H-1 to become
455199), while W-1 increased the number of points
by nearly 8% to become (303436).
Considering the sculpture alone, W-1 does not
achieve the number of points achieved using S-1.
The number of reconstructed points using W-1 is
(211044), which is about 8% smaller than the number
that is achieved by S-1 (231430). This happens
because random noise is still there, and it seems to
be not as robust to noise as our proposed approach.
It is worth mentioning that, starting from 8 images,
the sculpture has been fully reconstructed. Therefore,
there is no significant difference in terms of number
of points between both approaches. Fig. 6, first row
(right) shows the point cloud using S-1, while the
second row shows the point clouds using W-30 (left)
and H-30 (right).
VISAPP 2018 - International Conference on Computer Vision Theory and Applications
578
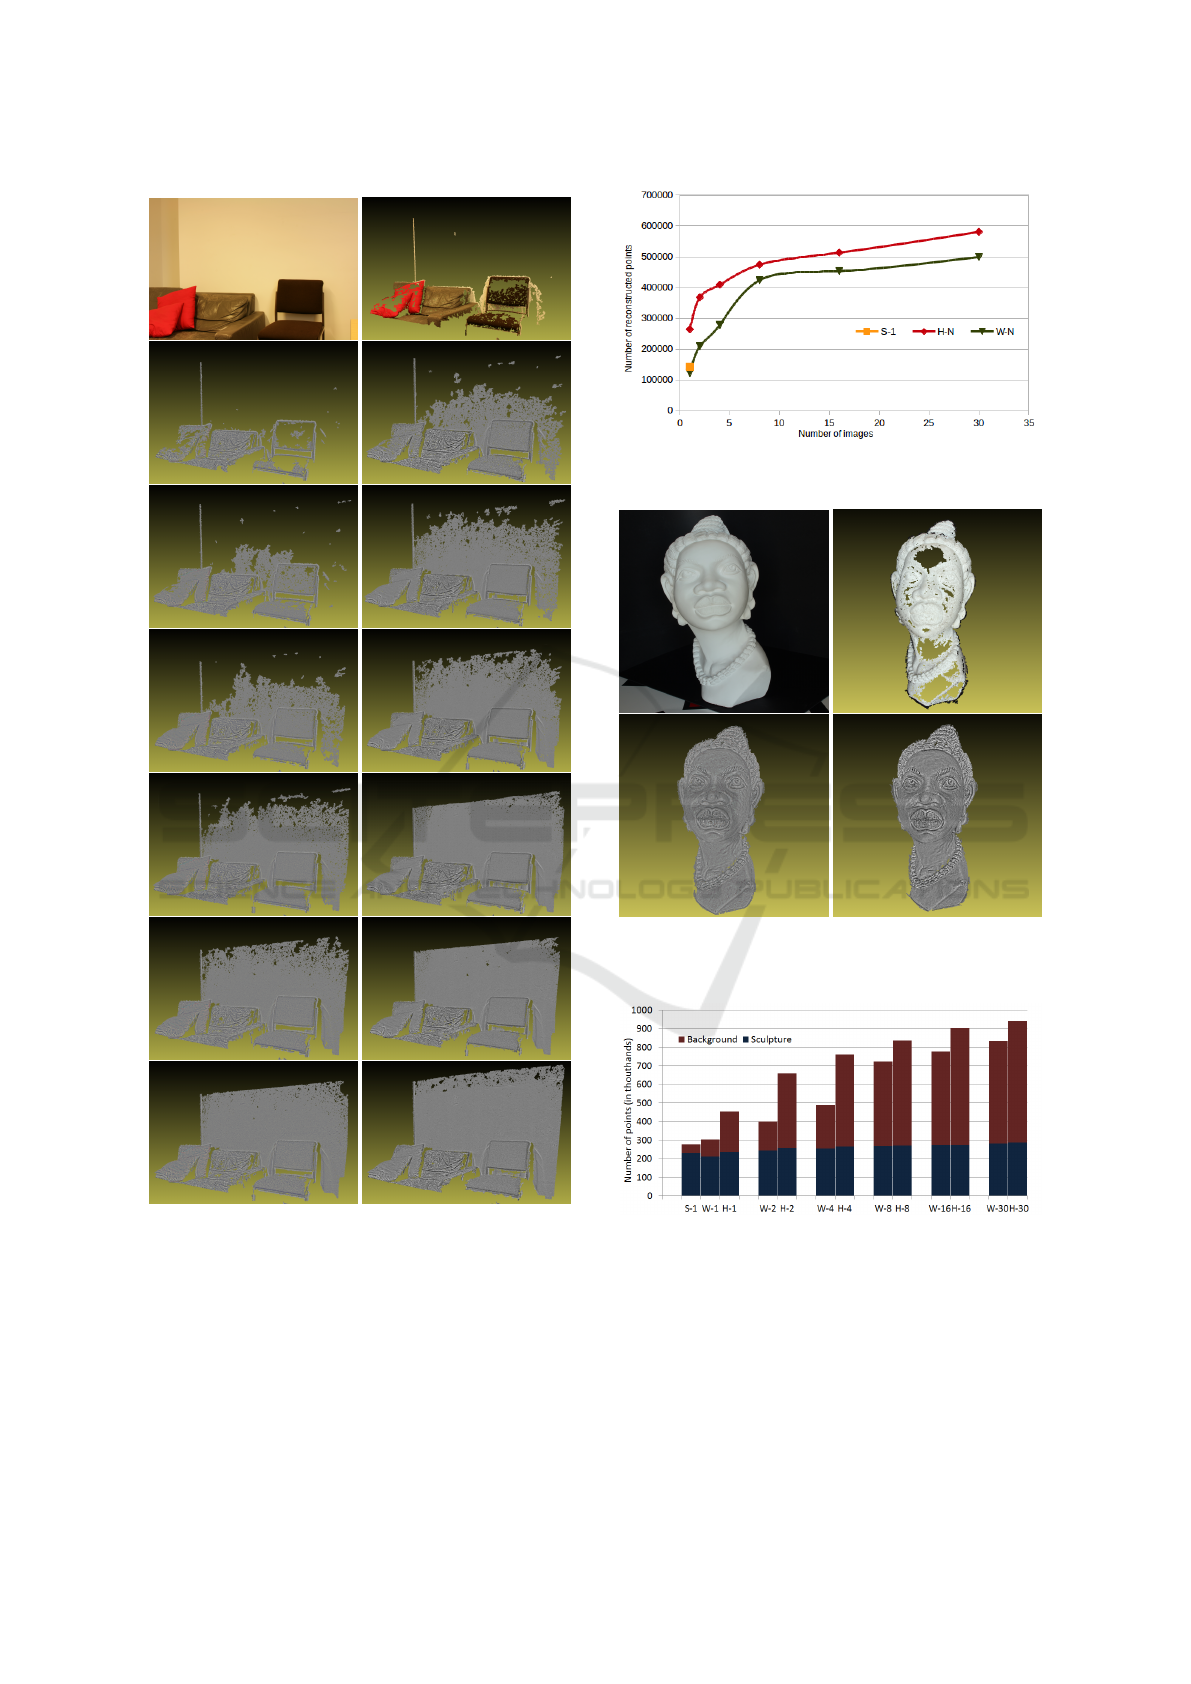
Figure 4: Wall dataset. Top row: one view of the scene,
S-1; Second to seventh row:W-1, H-1; W-2, H-2; W-4, H-4;
W-8, H-8; W-16, H-16; W-30, H-30.
Considering the background alone, as seen in
Fig. 6, the background is underexposed and the
texture is barely visible. In such difficult surfaces,
the power of noise reduction appears. As can be
seen in Fig. 7, both algorithms achieve larger number
of reconstructed points, as the number of images
Figure 5: Wall dataset. Points count in dense reconstruction
for different numbers of images per viewpoint.
Figure 6: Sculpture dataset. First row: Example image (left)
and point cloud using S-1 (right); Second row: point clouds
using W-30 (left) and using H-30 (right).
Figure 7: Sculpture dataset. Number of points of the dense
reconstruction for different methods and number of images
per viewpoint. Sculpture (blue) and Background (red).
increases. However, our proposed approach still
overcomes the approach of (Ley et al., 2016).
Reconstructing Textureless Objects - Image Enhancement for 3D Reconstruction of Weakly-Textured Surfaces
579

5 CONCLUSION AND FUTURE
WORK
Despite of the vast advances in feature
detection, extraction, and matching mechanisms,
weakly-textured regions are still a big challenge
for standard automatic 3D reconstruction pipelines.
This paper investigates image processing and noise
suppression techniques to boost the hidden details
in weakly-textured surfaces. To avoid possible loses
of the achieved gain after image enhancement, this
paper proposes to apply enhancements directly on
one gray channel, such that the Green channel of the
RGB or the L component of the Lab color space. This
paper proposes a CLAHE-based approach to squeeze
the dynamic range of the resulting denoised-images.
It amplifies the local contrast adaptively to effectively
use the limited 8-bit target range.
Experiments show that using the proposed
approach leads to a relatively huge improvement of
up to 400% in terms of precision and completeness.
In addition, it has been shown that the proposed
approach is outperforming a recently proposed
approach which tackles the same problem.
Future work may include using multi-camera rig
to acquire multiple images for different viewpoints
simultaneously. Also, more approaches for reducing
image noise can be investigated.
ACKNOWLEDGEMENTS
The authors would like to thank the German
Academic Exchange Service (DAAD) for supporting
this research. We are grateful to our colleagues who
provided help that greatly assisted this research work.
REFERENCES
Aldeeb, N. H. and Hellwich, O. (2017). Detection and
classification of holes in point clouds. In Conference
on Computer Vision, Imaging and Computer Graphics
Theory and Applications - Volume 6, pages 321–330.
Ballabeni, A., Apollonio, F. I., Gaiani, M., and Remondino,
F. (2015). Advances in image pre-processing to
improve automated 3d reconstruction. In 3D-Arch
- 3D Virtual Reconstruction and Visualization of
Complex Architectures, pages 315–323.
Ballabeni, A. and Gaiani, M. (2016). Intensity histogram
equalisation, a colour-to-grey conversion strategy
improving photogrammetric reconstruction of urban
architectural heritage. Journal of the International
Colour Association, 16:2–23.
Cai, H. (2013). High dynamic range photogrammetry
for light and geometry measurement. In AEI 2013:
Building Solutions for Architectural Engineering,
pages 544–553.
Debevec, P. E. and Malik, J. (1997). Recovering high
dynamic range radiance maps from photographs.
In Proceedings of the 24th Annual Conference
on Computer Graphics and Interactive Techniques,
SIGGRAPH 97, pages 369–378.
Furukawa, Y. and Ponce, J. (2010). Accurate, dense, and
robust multi-view stereopsis. IEEE Trans. on Pattern
Analysis and Machine Intelligence, 32(8):1362–1376.
Gomez-Gutierrez, A., de Sanjose-Blasco, J. J.,
Lozano-Parra, J., Berenguer-Sempere, F., and
de Matias-Bejarano, J. (2015). Does hdr
pre-processing improve the accuracy of 3d models
obtained by means of two conventional sfm-mvs
software packages? the case of the corral del veleta
rock glacier. Remote Sensing, 7(8):10269–10294.
Guidi, G., Gonizzi, S., and Micoli, L. L. (2014).
Image pre-processing for optimizing automated
photogrammetry performances. ISPRS Annals
of Photogrammetry, Remote Sensing and Spatial
Information Sciences, pages 145–152.
Kontogianni, G., Stathopoulou, E., Georgopoulos, A.,
and Doulamis, A. (2015). Hdr imaging for feature
detection on detailed architectural scenes. In 3D-Arch
- 3D Virtual Reconstruction and Visualization of
Complex Architectures, pages 325–330.
Lehtola, V. and Ronnholm, P. (2014). Image enhancement
for point feature detection in built environment. In
Systems and Informatics (ICSAI), 2nd International
Conference on, pages 774–779.
Ley, A., H
¨
ansch, R., and Hellwich, O. (2016).
Reconstructing white walls: Multi-view, multi-shot 3d
reconstruction of textureless surfaces. ISPRS Annals
of Photogrammetry, Remote Sensing and Spatial
Information Sciences, III-3:91–98.
Lu, G., Nie, L., and Kambhamettu, C. (2017). Large-scale
tracking for images with few textures. IEEE
Transactions on Multimedia.
Wallis, K. F. (1974). Seasonal adjustment and relations
between variables. Journal of the American Statistical
Association, 69(345):18–31.
Wu, C. (2013). Towards linear-time incremental structure
from motion. In International Conference on 3D
Vision - 3DV 2013, pages 127–134.
Wu, C., Agarwal, S., Curless, B., and Seitz, S. M. (2011).
Multicore bundle adjustment. In Computer Vision and
Pattern Recognition, pages 3057–3064.
Zuiderveld, K. (1994). Contrast limited adaptive histogram
equalization. In Graphics gems IV, pages 474–485.
Academic Press Professional, Inc.
VISAPP 2018 - International Conference on Computer Vision Theory and Applications
580
