
Traffic Monitoring System Development in Jelgava City, Latvia
Vitalijs Komasilovs
1
, Aleksejs Zacepins
1
, Armands Kviesis
1
, Eliecer Pe
˜
na
2
,
Felipe Tejada-Estay
2
and Claudio Estevez
2
1
Department of Computer Systems, Faculty of Information Technologies, Latvia University of Agriculture, Jelgava, Latvia
2
Department of Electrical Engineering, Universidad de Chile, Santiago, Chile
Keywords:
Traffic Monitoring, Video Processing, Multi-object Tracking, Motion Modeling.
Abstract:
Smart traffic management and monitoring is one of the key aspects of the modern smart city. Traffic flow
estimation is crucial for sustainable traffic planning in the city. A requirement for successful planning and
optimization of traffic is vehicle counting on the streets. Surveillance video is a suitable data source for
precise vehicle counting. A solution for real-time vehicle traffic monitoring, tracking and counting is proposed
in Jelgava city, Latvia. It is based on motion detection using background modeling, which is enhanced by
statistical analysis. Two-phase assessment is utilized: motion blobs are detected and tracked using custom
state machine implementation, then tracking results are passed through number of statistical filters to eliminate
false positive detections. The system demonstrates good performance and acceptable accuracy on given test
cases (about 97% accuracy for regular traffic conditions).
1 INTRODUCTION
Smart city has no one absolute definition (Anthopou-
los and Reddick, 2016). In general, the smart city is
identified by the following characteristics: smart eco-
nomy, smart people, smart governance, smart mobi-
lity, smart traffic, smart environment, and smart li-
ving (Mahizhnan, 1999). Smart traffic consists of
several topics, which are smart traffic light mana-
gement, smart accident management, smart public
transportation systems, vehicle identification, vehicle
tracking and counting.
Precise and reliable information about traffic con-
ditions can be used to synchronize traffic lights, assist
drivers in the selection of routes, assist governments
in planning the traffic system expansion, building new
roads, and data for designing better solutions for the
urban and road traffic (Barcellos et al., 2015).
Number of researches has been reported on traf-
fic monitoring and congestion analysis in urban areas.
Advanced communication technologies and Internet
of Vehicles concept are used for data acquisition and
transfer to analytical systems (Ahmed et al., 2016;
Wan et al., 2016). Indirect data sources such as GPS
tracks from probe vehicles (e.g. public transport)
are analyzed offline and traffic characteristics are ex-
tracted for strategical planning purposes (Carli et al.,
2015). Multiple data sources (such as GPS tracks, in-
road and vision sensors) are fused to provide accurate
information about traffic conditions to citizens (Ba-
con et al., 2011). Social media and other public infor-
mation (e.g. events, feedbacks) is applied as comple-
mentary information for traffic modeling and analysis
(Wang et al., 2017).
To this moment, in Jelgava city
1
traffic statistics
are collected manually by two approaches: a) opera-
tor manually observes the road segment or crossing
and writes down the number of vehicles; b) camera
is located near the monitored place and a video file is
recorded. Afterwards, the operator watches the video
and manually counts the vehicles. Theoretically, bus
GPS tracks could be applied for traffic analysis, but
bus routes are covering very limited set of roads.
The authors propose approach to improve this pro-
cess by using IT solutions for real-time video analy-
sis without attracting the operator for manual vehi-
cle counting. The use of image-based sensors and
computer vision techniques for data acquisition on the
traffic of vehicles have been intensely investigated in
the recent years (Tian et al., 2011). While intrusive
traffic sensing technologies (e.g. inductive loops, so-
nar or microwave detectors on roads, GPS sensors
on vehicles) are considered more precise they have
1
Jelgava is the fourth largest city in Latvia, is historical cen-
ter of Zemgales region, distance from Latvia capital Riga
is 42 km.
Komasilovs, V., Zacepins, A., Kviesis, A., Peña, E., Tejada-Estay, F. and Estevez, C.
Traffic Monitoring System Development in Jelgava City, Latvia.
DOI: 10.5220/0006629606590665
In Proceedings of the 4th International Conference on Vehicle Technology and Intelligent Transport Systems (VEHITS 2018), pages 659-665
ISBN: 978-989-758-293-6
Copyright
c
2019 by SCITEPRESS – Science and Technology Publications, Lda. All rights reserved
659
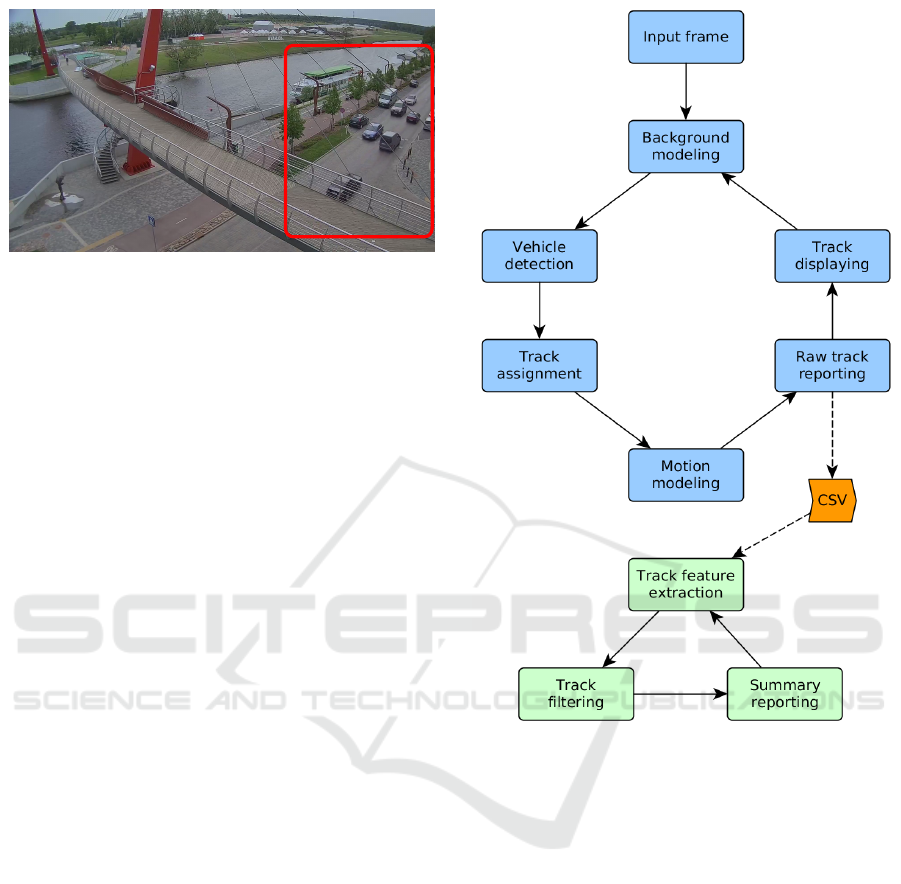
Figure 1: An example of video frame with marked area of
interest.
major disadvantages: installation cost, traffic disrup-
tion during installation or maintenance, and usually
these methods are unable to detect slow or static vehi-
cles (Mandellos et al., 2011). Contrary, surveillance
and/or security cameras are very common in urban
areas (e.g. Jelgava municipality serve more then 200
surveillance cameras in the city covering almost all
streets of the city) and are subject of access granting
negotiation rather than infrastructure installations.
Nevertheless, there are plenty of algorithms and
systems for image processing (Zhu et al., 1996; Wu
et al., 2001; Rad and Jamzad, 2005; Iwasaki and
Itoyama, 2007; Lim et al., 2009), image counting in
real situations from real-time video stream is not a
trivial task and there are challenges to solve. Unfortu-
nately, there is no one ultimate system, which can be
applied in all cases. As well price of the commercial
system can be a factor, which limits its application by
government.
Authors address underestimated availability of
video information on urban roads, which can be uti-
lized for traffic condition recognition using modern
image processing technologies. This paper describes
a software solution for vehicle tracking and counting
using image processing technologies. The live video
is obtained from Jelgava municipality web page
(http://www.jelgava.lv/lv/pilseta/tiessaistes-kamera/)
from stationary camera positioned aside the road on
the building wall by the address 5 J. Cakstes Blvd.,
Jelgava, Latvia (see Figure 1).
Vehicle traffic occurs in the diagonal direction,
from top right (farthest from the camera) to bottom
left (closest to the camera), and vice versa. Video has
FullHD resolution of 1920 ×1080 px at 30 frames per
second. Apart from other objects (e.g. wires, bridge,
pedestrians, buildings, etc.) video stream contains re-
gular two-way (one lane in each direction) road of Jel-
gava city.
Complexity of vehicle counting task is increased
by several aspects: vehicle occlusions occur due to
Figure 2: Principal process flow chart.
camera position, area of interest includes parking lots
on both sides of street, speed bumps on a street, bridge
cables appear on foreground, semi-hidden turning un-
der the bridge.
2 MATERIAL AND METHODS
Figure 2 shows basic workflow of solution for vehi-
cle traffic counting on live stream video. Input frames
are extracted directly from YouTube FullHD stream
(1920×1080), cropped to area of interest (576 × 648)
and pushed to further processing, described in sub-
sections below. Solution is implemented and tested
using Python 3.5.2 environment. OpenCV 3.2.0 li-
brary (Bradski, 2000) is used for low level image ma-
nipulations and processing.
RESIST 2018 - Special Session on Resilient Smart city Transportation
660
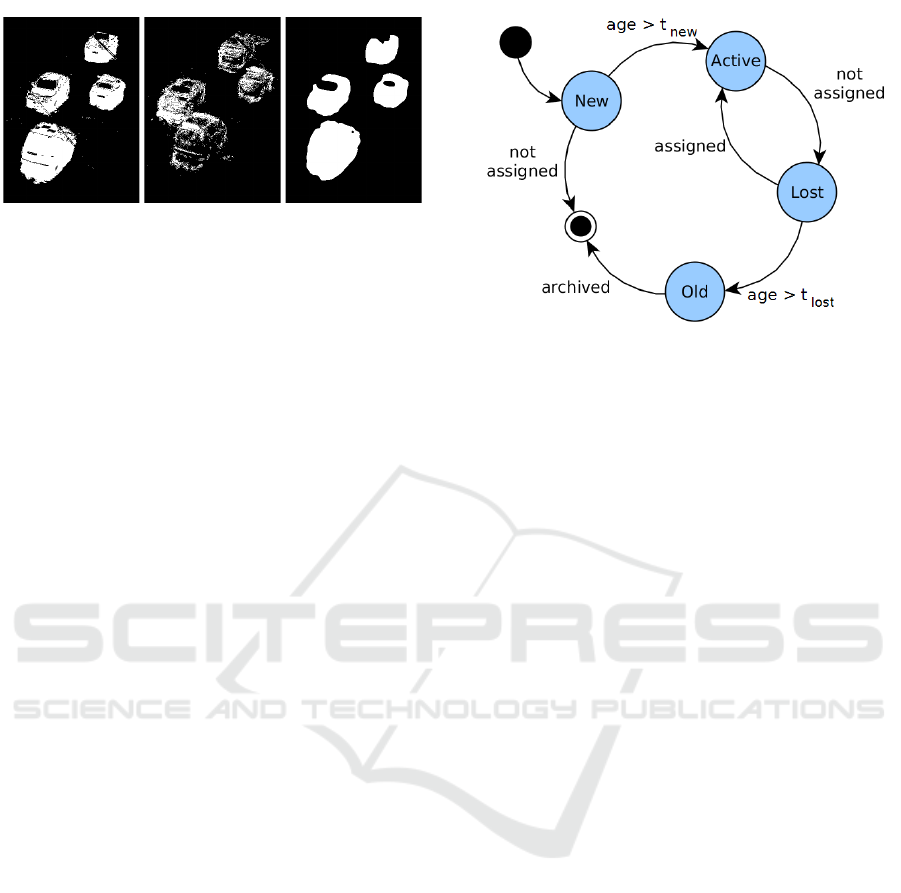
(a) MOG (b) MOG2 (c) final mask
Figure 3: Moving vehicle masks.
2.1 Vehicle Detection
This stage includes background modeling and vehicle
detection. Proposed solution uses background sub-
traction method for motion detection on subsequent
frames. Authors used (KaewTraKulPong and Bo-
wden, 2002) algorithm implementation available in
OpenCV (BackgroundSubtractorMOG), which gave
better results on test cases comparing with (Zivko-
vic, 2004) implementation (BackgroundSubtractor-
MOG2) as shown on Figure 3(a) and (b) respecti-
vely. The parameters used are as follows: history=50,
nmixtures=3, backgroundRatio=0.1, noiseSigma=10.
For better moving blob segmentation additional
mask operations are applied:
• Gaussian blur with kernel size 25 × 25 px and
standard deviation 0;
• binary threshold on level 100;
• single erosion iteration with elliptical kernel
3 × 3 px.
The resulting final mask after all manipulations is
shown on Figure 3(c).
At the next stage contour search is performed on
mask. The list of contours is filtered by area thres-
hold t
area
= 2000: contours with area less then 2000
px
2
(number obtained empirically for given frame and
vehicle size) are considered as no-interest detections
(e.g. birds, tree leaves moving by the wind, walking
people, bicycles, scooters) and excluded from further
processing. Then center coordinates of each contour
is calculated and together with contour area and boun-
ding box coordinates is packed into tracking point
data structure and pushed to further processing.
2.2 Vehicle Tracking
Vehicle tracking stage stands for the problem of fol-
lowing same vehicle across multiple subsequent fra-
mes and includes track assignment, motion modeling
and raw track reporting steps. As an input this mo-
dule uses list of moving vehicles (contours) detected
Figure 4: Track status transitions.
on current frame and it maintains its internal state of
tracked vehicles from previous frames.
First of all detected vehicles are assigned to tracks
- the trajectory of the moving vehicle from previous
frames. Authors use modification of Hungarian al-
gorithm for linear sum assignment problem and mi-
nimize the sum of distances between detections from
current and previous frames (1):
min
∑
i
∑
j
D
i, j
X
i, j
(1)
where D is distance matrix between last tracked points
and current detected points, X is binary assignment
matrix which indicates pairs of detection point and
tracked point.
There are cases when between two subsequent fra-
mes some tracked vehicles left the current frame and
new (yet untracked) vehicles appeared on the frame.
For proper handling of such cases authors use dis-
tance threshold t
dist
= 300 px and area change ratio
threshold t
areaRatio
= 0.3, which in taken into account
during assignment step: detection is not assigned to
track if distance between those two is more than 300
px or if area has changed by more than ±30%. As
a result new vehicles are properly assigned to new
tracks, while old vehicles are left unassigned.
In addition to increase stability of tracking and
reduce false positive vehicle tracking cases authors
use status modeling with several time thresholds (see
Figure 4) expressed in number of processed frames.
Frames are not explicit measure of time, but because
video frame rate is considered as constant, it can serve
this purpose.
• t
new
= 15: time delay (frames) until newly trac-
ked object becomes active, helps to eliminate
shortly appearing detection blobs (e.g. shadows,
car occlusions, clouds);
Traffic Monitoring System Development in Jelgava City, Latvia
661
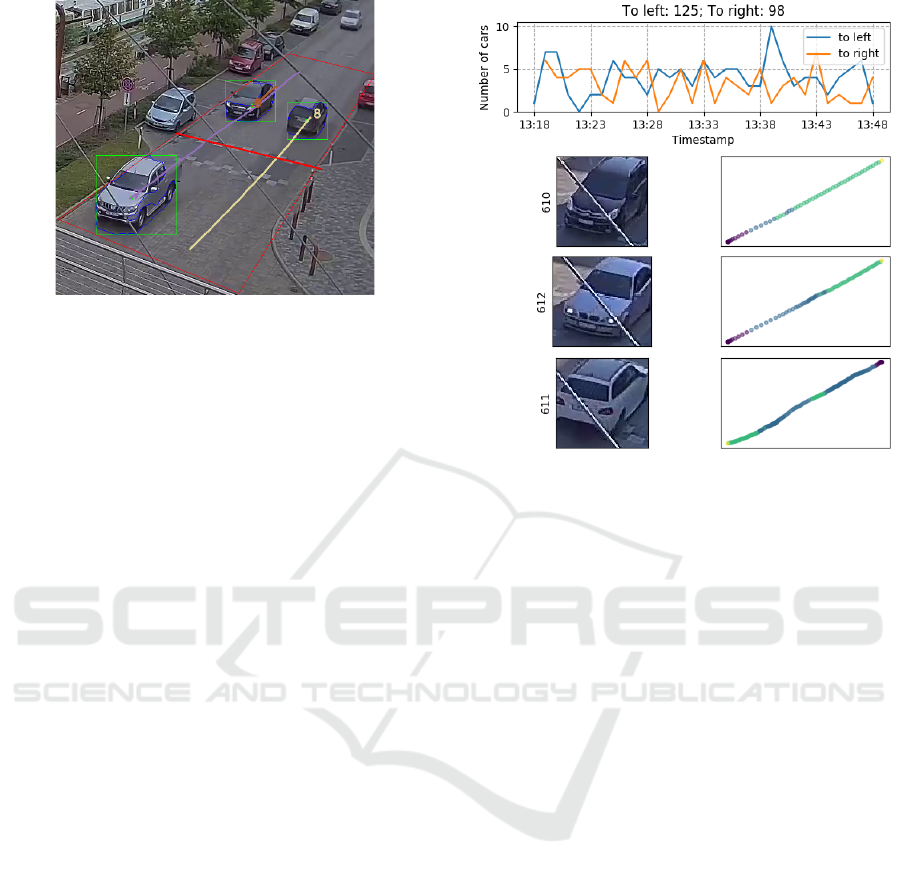
Figure 5: Real time monitor screenshot.
• t
lost
= 30: grace period (frames) while lost track
is kept among assignment candidates, helps to eli-
minate short gaps in detection (mostly car occlu-
sions);
In order to smooth tracked vehicle trajectory and
improve detection gap handling authors apply Kal-
man’s filter for vehicle motion modeling and pre-
diction. Internal state of the tracked vehicle is mo-
deled using 6 dynamic parameters:
• x, y: object center coordinates on picture;
• v
x
, v
y
: object moving speed;
• s, v
s
: object contour area and its changing speed,
respectively.
As input for filter corrections x , y and s are provi-
ded from detection results, while speeds are maintai-
ned internally.
Finally, active tracks are displayed on real-time
monitor (see Figure 5) and eventually Old tracks are
archived to external database ”as-is” (authors use se-
parate CSV file for every 10 minutes of monitoring
for easier handling).
2.3 Post-processing and Filtering
For better accuracy post-processing on reported raw
tracking data is performed by separate process. This
stage contains feature extraction, track filtering and
reporting. First of all for each track following features
are created:
• coordinates of tracking starting point;
• vehicle moving direction (to left or to right);
• number of recorded points in track and its length;
• imaginary mid-line crossing;
• linear motion trajectory interpolation (coefficients
for line y = ax + b and R
2
).
Figure 6: Summary monitor screenshot.
Then statistical analysis is performed on resulting
dataset and criteria are derived for filtering ineligible
cases. Statistical analysis is described in details in
next section.
Finally obtained statistics are periodically (every
5 seconds) displayed on summary monitor (see Fi-
gure 6).
3 RESULTS AND DISCUSSION
This section describes results and their evaluation for
the proposed solution.
3.1 Experiments Setup
For testing and evaluation purposes eight 10 minu-
tes long video clips were recorded from live stream
at different time of the day, every 2 hours from 7:00
till 21:00 (see table 1 for details). On each clip vehi-
cles are manually counted for ground truth reference.
Then each clip is processed via the proposed solution
and results are collected.
For better statistical analysis another raw tracking
dataset is gathered during several afternoons when
most of traffic happens on the given street. In total
it has about 10 000 recorded tracks.
3.2 Statistical Analysis
Raw vehicle tracking reports obtained from first stage
of processing demonstrate poor accuracy: the system
RESIST 2018 - Special Session on Resilient Smart city Transportation
662
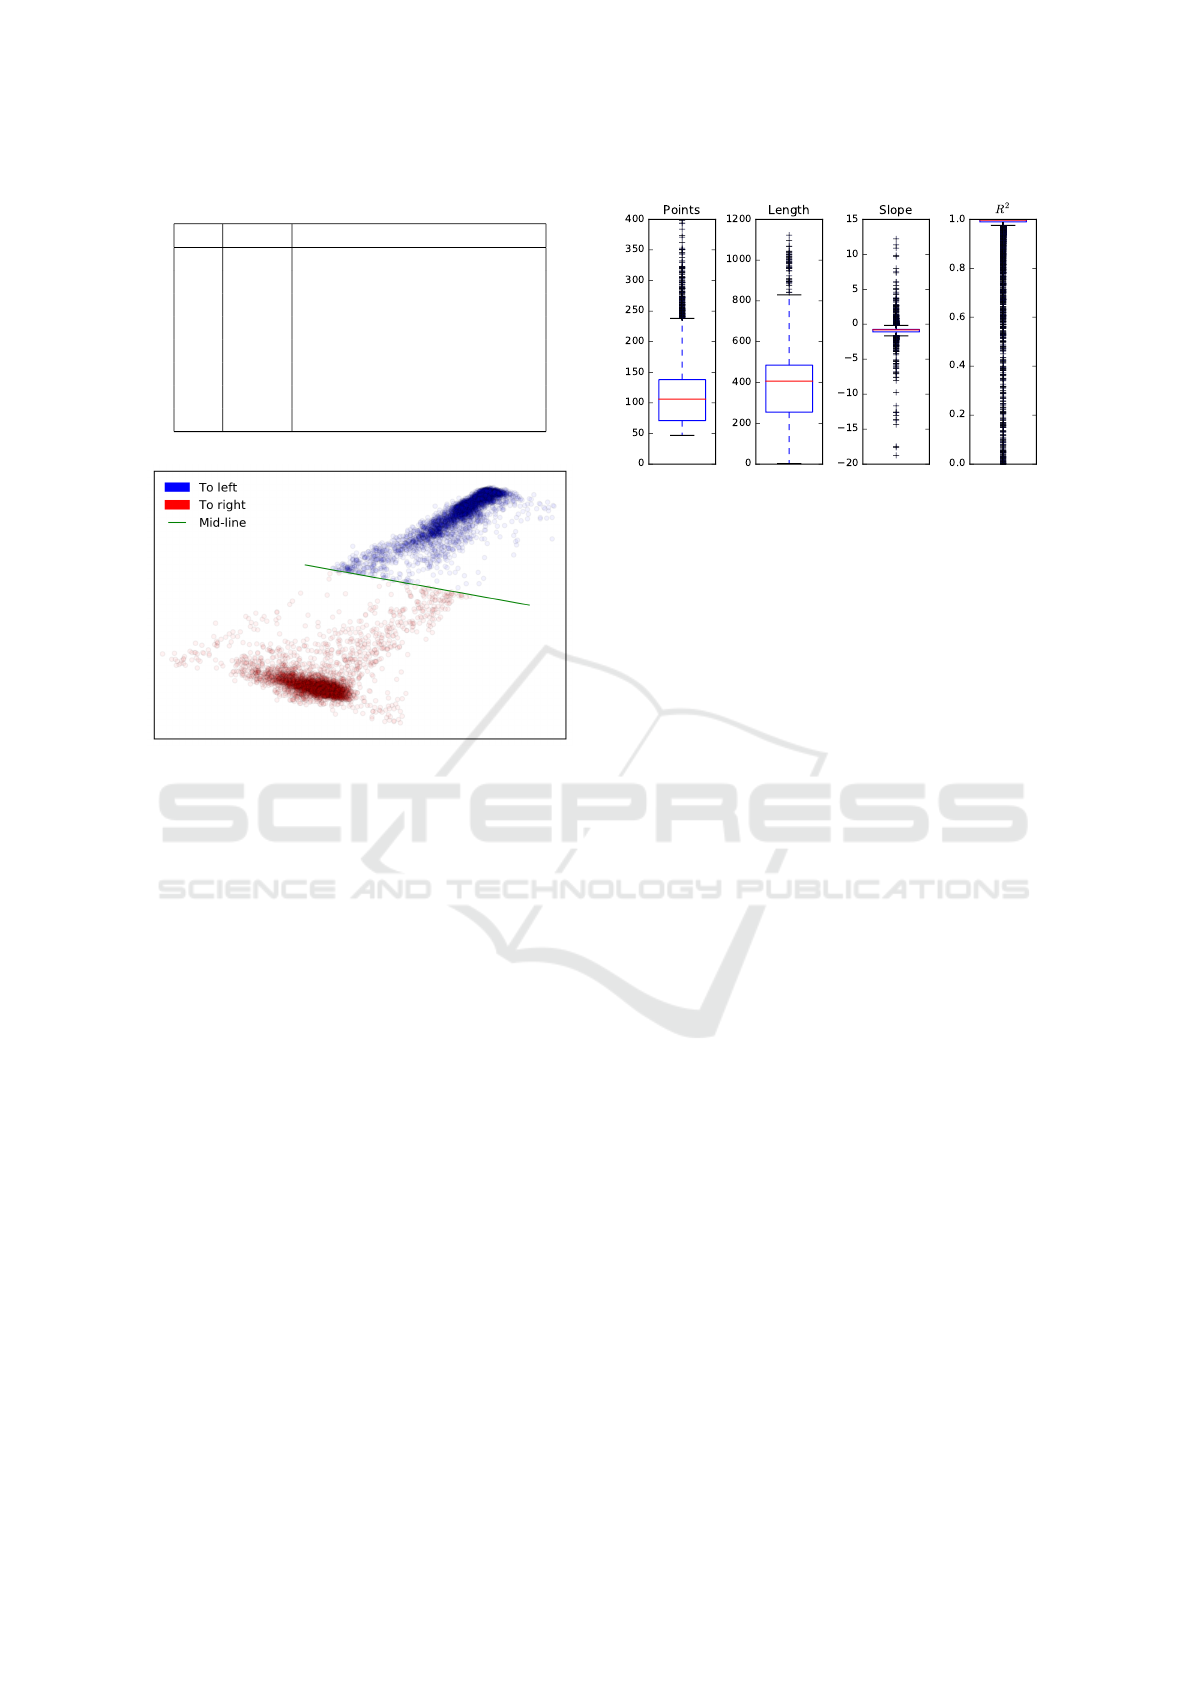
Table 1: Recorded video clips.
Nr. Time Description
1 07:00 dawn
2 09:00 partly cloudy, sun reflections
3 11:00 cloudy
4 13:00 sunny
5 15:00 sunny, windy
6 17:00 rainy, congestion
7 19:00 partly cloudy
8 21:00 dusk, headlamp reflections
Figure 7: Track starting points and imaginary mid-line.
detects many false positives. Statistical analysis on
recorded dataset were performed to develop suitable
filtering conditions.
First of all, tracks are filtered by moving direction
and starting point coordinates in a way that tracks po-
tentially cross imaginary mid-line. Observations con-
firm that the majority of tracks started after mid-line
by moving direction are either detection errors or du-
plicates of already tracked vehicles. Figure 7 shows
spatial scatter plot of track starting points colored by
moving direction.
Next track variation is analyzed by number of de-
veloped features (see Figure 8). Number of recorded
points in track is not correlating with track quality:
there are correct tracks with small number of recor-
ded points (fast moving vehicles) as well as with large
number of recorded points (slow vehicles / conges-
tion).
Track length in pixels is good candidate for filte-
ring condition. Whole class of false positives have
short trajectories (vehicle occlusions, foreground wi-
res, etc). Observation shows that very long tracks are,
in essence, tracks of two vehicles merged into one
(track jumps between lines and goes in opposite di-
rection). Such cases can be separated into two in-
dependent tracks, but in practice these are very rare
cases. Therefore, authors count long tracks as single
track.
Figure 8: Track variation by selected features.
Another set of features used for raw data filtering
is trajectory linear interpolation results (a, b coeffi-
cients and R
2
value for line y = ax + b). Coefficient
of determination R
2
shows how much given track is
close to straight line. Despite the fact that R
2
varia-
tion is notably close to 1.0 there are a lot of outliners
among acceptable tracks, and vice versa, wrong tracks
with close to linear trajectory.
Coefficient b affects track pitch on the picture,
which in traffic context relates to vehicle position on
the street (left or right side of street). Due to presence
of speed bumps in the middle of each line drivers tend
to drive in-between of bums when there is no onco-
ming traffic. Therefore this coefficient is not suitable
for any track selection.
In contrast, a coefficient shows linear slope of the
trajectory, which in turn should correspond to street
direction for all vehicles. Figure 8 shows relatively
low variation in a coefficient values, and selected out-
liner cases are clearly incorrect.
Figure 9 demonstrates samples of tracks selected
by different criteria. After statistical analysis follo-
wing criteria is used for selecting acceptable tracks
out of raw tracking results:
• track starting point is before mid-line by vehicle
moving direction;
• track length L > 100 px;
• slope of linear interpolation is in range −2 < a < 1
3.3 Accuracy Evaluation
Table 2 shows summarized accuracy evaluation re-
sults on all test cases. For each test case ground
truth numbers are manually counted and considered
as accuracy reference. Total number of raw tracks
obtained from the first stage of processing are shown
in the table (at this stage they are not divided by di-
rection). Next numbers correspond to tracks left after
Traffic Monitoring System Development in Jelgava City, Latvia
663
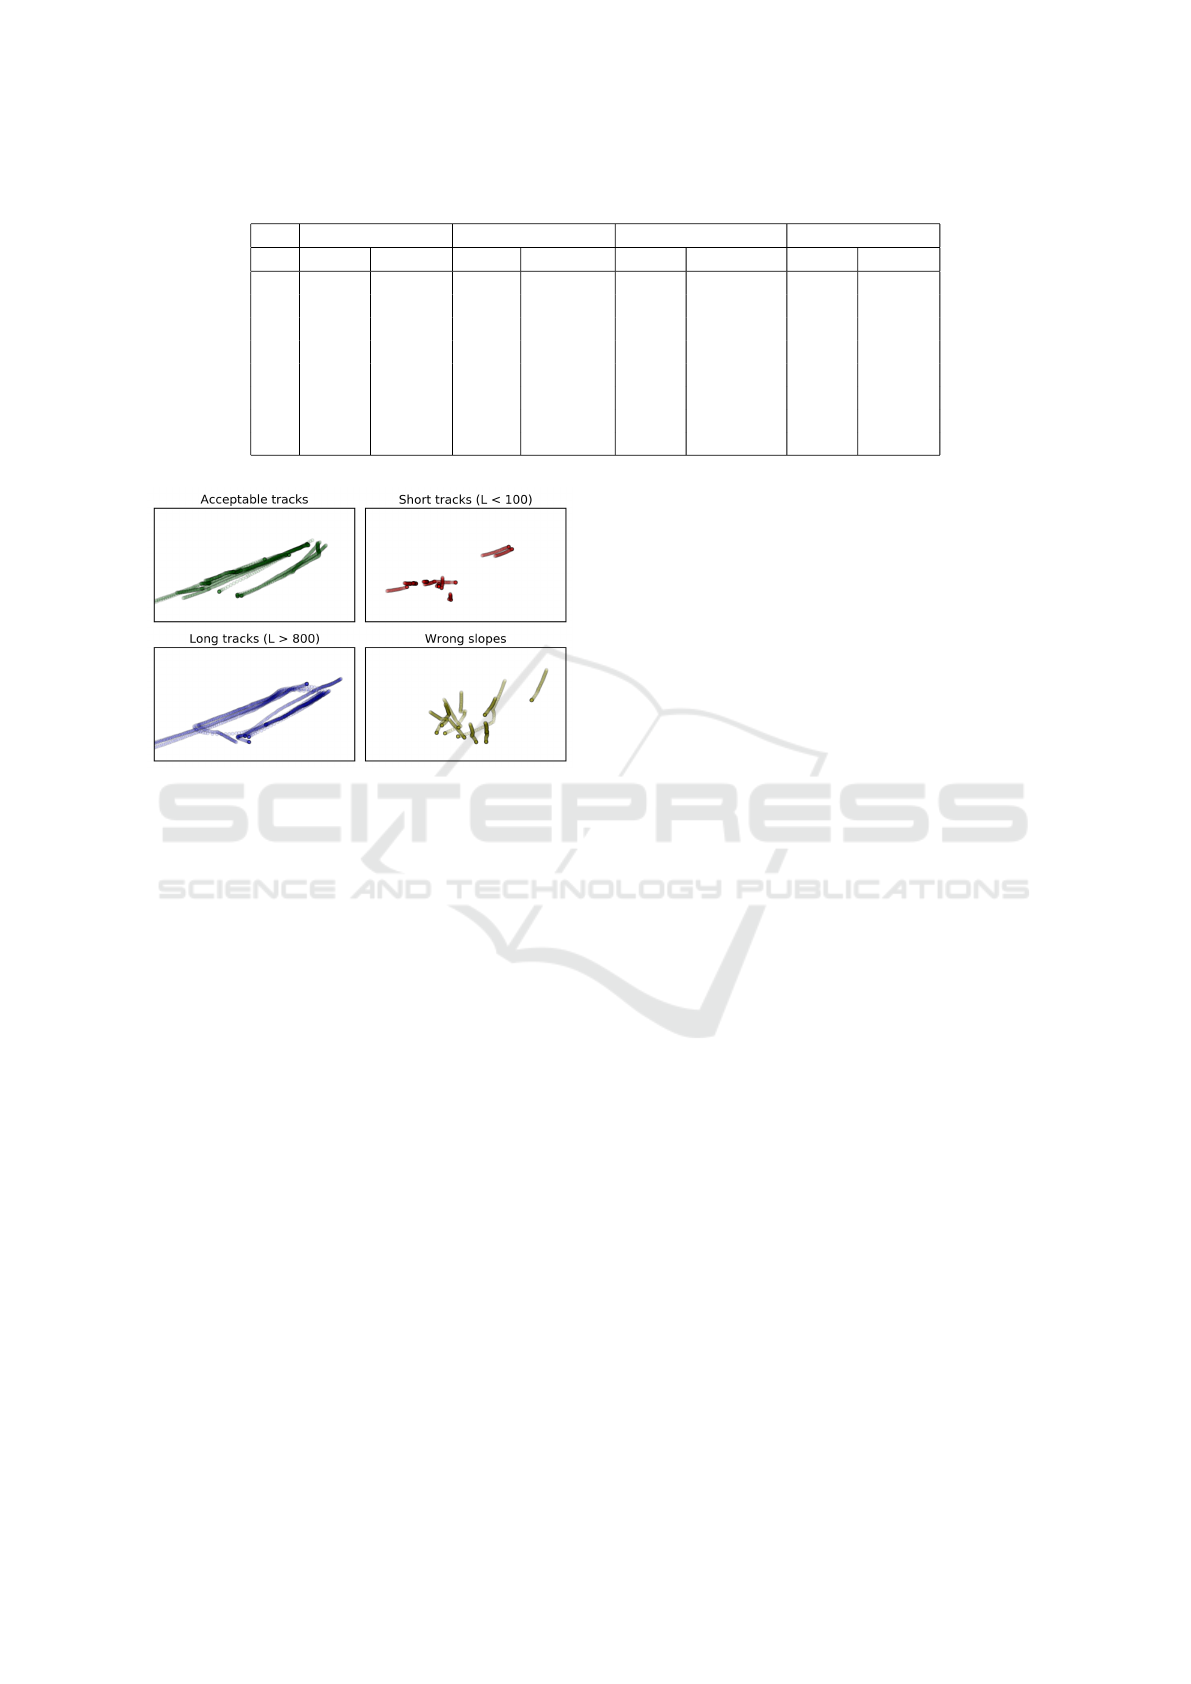
Table 2: Accuracy evaluation summary.
Ground truth Raw tracks Statistical analysis Final accuracy
Nr. to left to right count accuracy to left to right to left to right
1 25 13 39 97% 25 13 100% 100%
2 63 25 96 91% 61 24 97% 96%
3 55 23 82 95% 54 23 98% 100%
4 50 54 107 97% 50 55 100% 98%
5 52 30 85 96% 51 32 98% 93%
6 80 71 188 75% 61 73 76% 97%
7 49 29 82 95% 47 31 96% 93%
8 37 18 78 58% 39 19 95% 94%
Figure 9: Track types selected by statistical analysis.
analysis and filtering. Last two columns show evalua-
tion of final accuracy of the system. Overall solution
has acceptable accuracy for given task and conditions
(about 97% accuracy for regular traffic conditions).
There are two notable cases worth to highlight.
Test case 6 is recorded at 17:00 when traffic con-
gestion happened on the given street. Proposed so-
lution relies on motion detection via background mo-
deling and due to congestion and slow vehicle mo-
vement it was not able to properly track separate
vehicles (stopped vehicles were considered as back-
ground and movement phase was too short for star-
ting tracking). As results show, statistical analysis
does not help to resolve these cases. An impro-
vement option would be to keep tracking even stop-
ped vehicles by implementing difference measure be-
tween last seen motion blob and current still frame
(e.g. keypoint matching or feature histograms) which
is out of scope of current research.
Another notable test case 8, which was recorded
at 21:00 shortly after rain. Vehicle headlamps are re-
flecting from wet street surface, which leads to very
high number of false positives in raw tracking results
(almost all vehicles going left are counted twice: he-
adlamp reflection and vehicle itself). However statis-
tical analysis and raw result filtering helps to signifi-
cantly improve results: from 58% to 94%.
In current system implementation the only pro-
cessing outcome is number of vehicles moving each
direction. Given that detailed vehicle tracking infor-
mation is archived, it is possible to develop and ex-
tract more useful traffic features. Vehicle spatial posi-
tion on camera image could be mapped to geographi-
cal position, which gives potential to estimate vehi-
cle speed. Vehicle snapshots could be used for furt-
her classification task (e.g. cars, vans, buses, tucks).
In case of outputs of multiple cameras are fused into
common database there is potential to estimate traf-
fic density and even track distinct vehicles across the
city.
4 CONCLUSIONS
Traffic flow monitoring solution for real-time vehi-
cle counting on live stream is proposed, developed
and tested for Jelgava city in Latvia. It is based on
background modeling, multi-vehicle tracking and sta-
tistical analysis. The experimental results show that
proposed solution is suitable for variety of traffic and
weather conditions, except congestions.
The proposed method detected the number of cars
with an accuracy ranging between 93 − 100% for re-
gular traffic conditions and 76% for congestion.
To extend system functionality it is planned to im-
plement vehicle classification module (e.g. car, van,
bus, truck, motorcycle, etc). Also for better conge-
stion handling it is planned to improve vehicle de-
tection approach in addition to background modeling.
Camera positioning is crucial factor for precise
traffic monitoring and it should be mounted in more
elaborate location without any interfering objects
(e.g. wires, pillars, bridges, etc).
Visual image processing and analyzing techniques
are improved during recent years. Outdoor surveil-
lance cameras have underestimated potential for non-
intrusive traffic monitoring and feature extraction in
urban areas.
RESIST 2018 - Special Session on Resilient Smart city Transportation
664

ACKNOWLEDGMENTS
Scientific research, publication and presentation are
supported by the ERANet-LAC Project ”Enabling re-
silient urban transportation systems in smart cities”
(RETRACT, ELAC2015/T10-0761).
REFERENCES
Ahmed, S. H., Bouk, S. H., Yaqub, M. A., Kim, D., Song,
H., and Lloret, J. (2016). Codie: Controlled data
and interest evaluation in vehicular named data net-
works. IEEE Transactions on Vehicular Technology,
65(6):3954–3963.
Anthopoulos, L. G. and Reddick, C. G. (2016). Understan-
ding electronic government research and smart city: A
framework and empirical evidence. Information Po-
lity, 21(1):99–117.
Bacon, J., Bejan, A., Beresford, A., Evans, D., Gibbens, R.,
and Moody, K. (2011). Using real-time road traffic
data to evaluate congestion. Dependable and Historic
Computing, pages 93–117.
Barcellos, P., Bouvi
´
e, C., Escouto, F. L., and Scharcanski, J.
(2015). A novel video based system for detecting and
counting vehicles at user-defined virtual loops. Expert
Systems with Applications, 42(4):1845–1856.
Bradski, G. (2000). The OpenCV Library. Dr. Dobb’s Jour-
nal of Software Tools.
Carli, R., Dotoli, M., Epicoco, N., Angelico, B., and Vinci-
ullo, A. (2015). Automated evaluation of urban traf-
fic congestion using bus as a probe. In Automation
Science and Engineering (CASE), 2015 IEEE Inter-
national Conference on, pages 967–972. IEEE.
Iwasaki, Y. and Itoyama, H. (2007). Real-time vehicle de-
tection using information of shadows underneath vehi-
cles. In Advances in Computer, Information, and Sys-
tems Sciences, and Engineering, pages 94–98. Sprin-
ger.
KaewTraKulPong, P. and Bowden, R. (2002). An impro-
ved adaptive background mixture model for real-time
tracking with shadow detection. Video-based surveil-
lance systems, 1:135–144.
Lim, K. H., Ang, L., Seng, K. P., and Chin, S. W. (2009).
Lane-vehicle detection and tracking. In Proceedings
of the international multiconference of engineers and
computer scientists 2009 Vol II IMECS 2009, Hong
Kong.
Mahizhnan, A. (1999). Smart cities: the singapore case.
Cities, 16(1):13–18.
Mandellos, N. A., Keramitsoglou, I., and Kiranoudis, C. T.
(2011). A background subtraction algorithm for de-
tecting and tracking vehicles. Expert Systems with Ap-
plications, 38(3):1619–1631.
Rad, R. and Jamzad, M. (2005). Real time classification
and tracking of multiple vehicles in highways. Pattern
Recognition Letters, 26(10):1597–1607.
Tian, B., Yao, Q., Gu, Y., Wang, K., and Li, Y. (2011).
Video processing techniques for traffic flow monito-
ring: A survey. In Intelligent Transportation Systems
(ITSC), 2011 14th International IEEE Conference on,
pages 1103–1108. IEEE.
Wan, J., Liu, J., Shao, Z., Vasilakos, A. V., Imran, M., and
Zhou, K. (2016). Mobile crowd sensing for traffic pre-
diction in internet of vehicles. Sensors, 16(1):88.
Wang, S., Zhang, X., Cao, J., He, L., Stenneth, L., Yu, P. S.,
Li, Z., and Huang, Z. (2017). Computing urban traf-
fic congestions by incorporating sparse gps probe data
and social media data. ACM Transactions on Informa-
tion Systems (TOIS), 35(4):40.
Wu, W., QiSen, Z., and Mingjun, W. (2001). A method
of vehicle classification using models and neural net-
works. In Vehicular Technology Conference, 2001.
VTC 2001 Spring. IEEE VTS 53rd, volume 4, pages
3022–3026. IEEE.
Zhu, Z., Yang, B., Xu, G., and Shi, D. (1996). A real-time
vision system for automatic traffic monitoring based
on 2d spatio-temporal images. In Applications of
Computer Vision, 1996. WACV’96., Proceedings 3rd
IEEE Workshop on, pages 162–167. IEEE.
Zivkovic, Z. (2004). Improved adaptive gaussian mixture
model for background subtraction. In Pattern Recog-
nition, 2004. ICPR 2004. Proceedings of the 17th In-
ternational Conference on, volume 2, pages 28–31.
IEEE.
Traffic Monitoring System Development in Jelgava City, Latvia
665
