
Real-Time Approach to HRV Analysis
Guilherme Ramos
1,2
, Miquel Alfaras
1
and Hugo Gamboa
2,3
1
Plux Wireless Biosignals S.A, Avenida 5 Outubro 70, 1050-59, Lisboa, Portugal
2
Department of Physics, Faculdade de Ci
ˆ
encias e Tecnologia da Universidade Nova de Lisboa, Monte da Caparica,
2892-516, Caparica, Portugal
3
Laborat
´
orio de Instrumentac¸
˜
ao, Engenharia Biom
´
edica e F
´
ısica da Radiac¸
˜
ao (LIBPhys-UNL), Faculdade de Ci
ˆ
encias e
Tecnologia da Universidade Nova de Lisboa, Monte da Caparica, 2892-516, Caparica, Portugal
Keywords:
HRV Analysis, Real-Time Processing, Sliding Window, Biomedical Signal Processing.
Abstract:
In this paper, we present the assessment of heart rate variability (HRV) applied to real-time processing of
electrocardiographic (ECG) signals. A general approach for R-peak detection is described based on the com-
putational implementation of Pan and Tompkins algorithm, used in the offline version. Besides feature extrac-
tion (from temporal and frequency domain), the paper presents the development steps taken towards online
real-time biosignal processing. The functional basis of the online approach consists in the implementation
of a simple adaptive double-threshold algorithm for peak detection and a sliding window mechanism along
acquisition that provides a dynamically generated tachogram for the features to be successively extracted,
highlighting the new application opportunities for continuous observation of HRV parameters.
1 INTRODUCTION AND
MOTIVATION
Technology has become, specially in recent years, an
essential part of life in western societies. With the aim
of answering individual and collective needs, digital
technologies play nowadays an indisputable role.
Traditionally, humankind has tried to understand
human physiology in order to work towards the ap-
propriate corrections when medical conditions arise.
Experts are trained for years to access pathologies and
prescribe treatment when needed.
In recent times, though, the way society ap-
proaches medical conditions has completely changed.
While corrective medical attention has always been at
the base of the medical practice, preventive healthcare
and technology applications boast nowadays a huge
interest worldwide.
The fast developments in biosensing and the un-
stoppable increase of data availability have fostered
research in biomedical engineering, which is cur-
rently counting on a wide range of tools that enable
the acquisition and processing of information from
the human body.
In this position paper, we describe a module for a
signal processing platform, OpenSignals. In line with
our data-driven society needs and the ease to access
processing capabilities through mobile phone devices,
we present OpenSignals extension towards a real-time
Heart Rate Variability (HRV) processing approach.
OpenSignals software platform allows the study
and development of data post-processing tools. This
platform is integrated with signal acquisition sys-
tems from Plux, such as Biosignalsplux (Plux, 2012;
Chor
˜
ao et al., 2012) and BITalino (Plux, 2013; Alves
et al., 2013), which enable various sensor combina-
tions and easy acquisition of biosignals, like Electro-
cardiogram (ECG) and Electromyogram (EMG).
The assessment of HRV through ECG signals is
at the core of Plux goals, both for the potential im-
pact and for cost reduction in early diagnose of heart
conditions. Having a reliable and working HRV plat-
form has allowed the exploration of changes that en-
able real-time HRV assessment.
While offline analyses have proved to be an effi-
cient tool to assess HRV-related conditions, we be-
lieve that our approach could constitute one of the
first steps towards a better exploitation of the com-
putational resources and device capabilities present
nowadays in our society.
Moreover, the real-time monitoring of HRV may
play a crucial role in disciplines such as high-
performance sports that could benefit from real-time
detection of threatening heart conditions.
208
Ramos, G., Alfaras, M. and Gamboa, H.
Real-Time Approach to HRV Analysis.
DOI: 10.5220/0006641402080215
In Proceedings of the 11th International Joint Conference on Biomedical Engineering Systems and Technologies (BIOSTEC 2018) - Volume 4: BIOSIGNALS, pages 208-215
ISBN: 978-989-758-279-0
Copyright © 2018 by SCITEPRESS – Science and Technology Publications, Lda. All rights reserved
2 MATERIALS AND METHODS
In this section the ECG data signals, features ex-
tracted and processing steps are described.
Biosignalsplux platform is used as the device for
easy ECG acquisitions. This device allows a high
sampling rate in signal acquisition, which is fixed to
F
s
= 1000 Hz in the case of our study.
The user can specify the processing filters applied
to the ECG signals. The predefined filter is basically a
band-pass filter (F
low
= 0.5 Hz, F
high
= 40.0 Hz). This
procedure allows for the removal of the baseline and
the avoidance of high frequency noise and artefacts.
Electrocardiographic and electromyographic sig-
nals share frequency bands. EMG signals can vary
from F = 5 Hz to F = 400 Hz. The applied filters
help in reducing the cross-talk caused by undesired
muscular activity that could appear during ECG ac-
quisition.
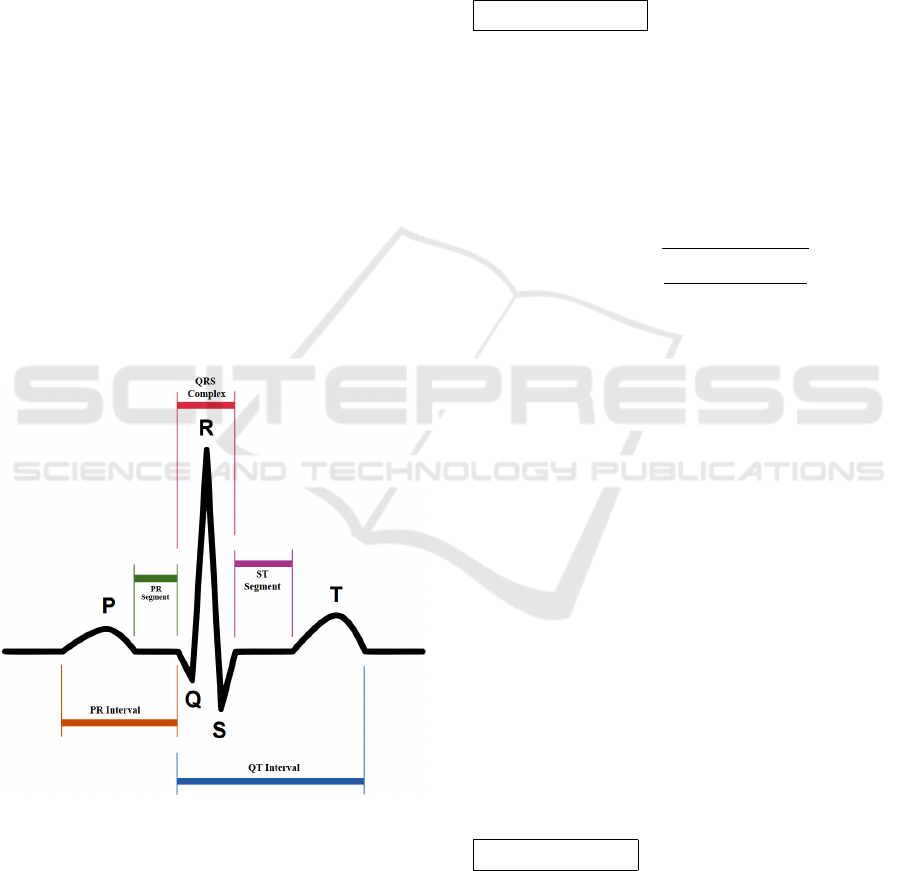
The voltage signals are segmented and annotated
to the P, Q, R, S, T points widely used in electro-
cardiography (see fig.1). These points correspond
to different stages of atrial/ventricular depolarisa-
tion/repolarisation and are used to identify waves and
intervals that are relevant for ECG analysis.
Figure 1: ECG PQRST points.
HRV assessment has traditionally relied on the
analysis of the tachogram, giving potential informa-
tion captured by the time series. The tachogram is the
temporal series of RR heartbeat intervals, which con-
tains the most relevant structural information of the
HRV.
The first step for HRV assessment consists in R-
peak detection. When using the offline analysis, our
algorithm is based on the widely used QRS complex
detection algorithm (Pan and Tompkins, 1985).
Once the R peaks are located, the tachogram is
built in order to proceed to feature extraction. An ec-
topic heartbeat removal criterion can also be speci-
fied. By using two limit values, e.g. R
min
= 0.4 s and
R
max
= 2.0 s, heartbeats from abnormal origin can be
easily discarded.
Our implementation contains the following fea-
tures:
Statistical Analysis
minRR (s). Minimum RR interval duration.
maxRR (s). Maximum RR interval duration.
avgRR (s). Average RR interval duration.
SDNN (s). Standard Deviation of RR intervals. Null
variance would indicate identical consecutive RR in-
tervals (Acharya et al., 2006).
rmsSD (s). Root mean square of the successive
tachDiff differences, an approximation to the disper-
sion on the tachogram’s derivative.
rmsSD =
s
∑
K
i=0
tachDi f f
2
[i]
K
(1)
K represents the number of points in the differential
tachogram.
NN20 (# intervals). Number of RR intervals between
non-ectopic beats where the difference of duration
with respect to the previous RR interval is greater than
20 ms.
pNN20 (dimensionless). Ratio between NN20 and
the total number of RR intervals on the processing
window. This represents the fraction of RR intervals
that verifies the condition of difference of duration
greater than 20 ms with respect to the adjacent RR
interval.
NN50 (# intervals) and pNN50 (dimensionless).
Number of RR intervals and ratio between non-
ectopic beats where the difference of duration with
respect to the previous RR interval is greater than 50
ms.
avg IHR (bpm). Average of the instantaneous heart
rate (IHR). Instantaneous heart rates are computed via
the inverse of every single Tachogram interval, which
indicates the number of beats per minute (bpm).
STD IHR (bpm). Standard Deviation of the instanta-
neous heart rate.
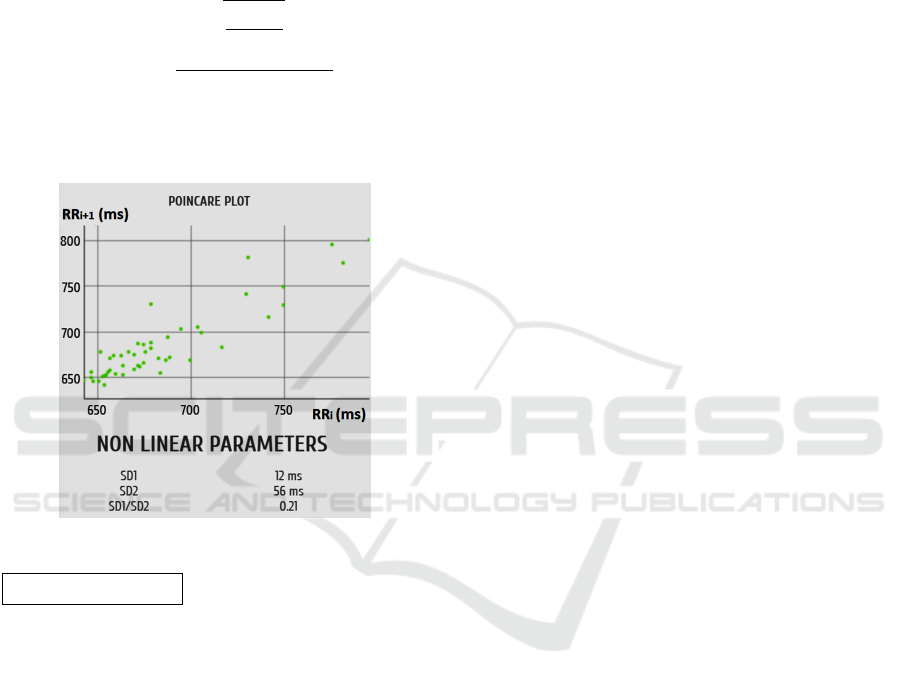
Poincar
´
e Analysis
SD1 (s) e SD2 (s) ellipse sub-axes estimators: Non-
linear features derived from the Poincar
´
e plot. In the
Poincar
´
e plot, each point is formed by the coordinates
(RR
i
and RR
i+1
). In other words, the nonlinear trajec-
tory is represented by consecutive RR intervals (two
consecutive RR values constitute a point in the plot,
fig.2).
Real-Time Approach to HRV Analysis
209
SD1 and SD2 are estimators for the axes’ size of
the ellipse that covers all Poincar
´
e samples, directly
linked to long-term HRV (SD2) and short-term HRV
(SD1).
A greater value of these indices indicates a wider
heart rate variability. These are measures of the stan-
dard deviation with respect to reference lines RR
i+1
=
RR
i
and RR
i+1
= −RR
i
+ 2avgRR (Goli
´
nska, 2013):
SD1 =
r
SDSD
2
2
(2)
SD2 =
p
2 × SDNN
2
− SD1
2
(3)
where SDSD is the standard deviation of tachDiff
(equivalent to rmsSD) and SDNN is the standard de-
viation of the tachogram, as defined previously.
Figure 2: HRV Poincar
´
e plot.
Frequency Analysis
To take HRV signals to the frequency domain some
care is needed, because we deal with time series with
irregular sampling period (i.e. the time between two
heart rate samples is dependent of the RR interval
duration). Under these conditions it is strongly rec-
ommended to use the Lomb-Scargle Method, which
generates a “Fourier-like power spectrum estimator”
(VanderPlas, 2017), based on Least Squares Method
where for each elementary frequency component (in-
dependent variable of Periodogram) the sinusoid that
best fits the data is determined, based on chi-squared
testing (Chou et al., 2011). To achieve an efficient
analysis with Lomb-Scargle Methodology, Python as-
tropy’s library is used. The frequency scales are au-
tomatically defined by the autopower property, based
on a heuristic approach.
Power of Components in HRV Informative Bands.
They provide access to information related to the ef-
fect of sympathetic and parasympathetic components
in the heart rate variability control, which are difficult
to analyse in the temporal domain. The elementary
components inside the Low-Frequency (LF - 0.04 to
0.15 Hz) and High-Frequency (HF - 0.15 to 0.40 Hz)
bands refer to autonomic segments of heart rate vari-
ability. In bands containing Ultra-Low-Frequencies
(ULF - 0 to 0.003 Hz) and Very-Low-Frequencies
(VLF - 0.003 to 0.04 Hz) data is in most cases in-
conclusive and is frequently associated with harmonic
and incoherent signal components.
The information of HF Band Power is correlated
with SDNN, rmsSD and SDSD features. It is ex-
pected that when the heart rate variability increases
the power value of this component is also increased
(Task Force of The European Society of Cardiology
and The North American Society of Pacing and Elec-
trophysiology, 1996).
The information that SDNN feature provides is
equivalent to the Total Power of the Frequency Spec-
trum and rmsSD is linked with the power of HF band
of tachogram spectrum.
This correspondence has the advantage of present-
ing a reduced computational cost with respect to fre-
quency domain analysis methods.
One disadvantage, though, is related to the fact
that SDNN values depend on the window size. There-
fore, the comparison between trials is only possible
when similar acquisition conditions are guaranteed.
2.1 OpenSignals Platform Plugins
OpenSignals is a software compatible with multiple
platforms and operating systems. It provides a so-
lution to the fast-growing research community using
Plux devices. Its design targets the representation of
the biosignals captured and transmitted through Blue-
tooth in real-time allowing the subsequent storage on
the computer. Devices are easily paired to the soft-
ware via the MAC address.
OpenSignals can be described as a framework
that uses the web-based architecture (Pimentel et al.,
2015), based on three programming languages
(HTML, JavaScript and Python). With this triad it is
possible to “combine high-performance data manage-
ment and computational capacity with an intuitive and
user-friendly interface” (Plux, 2016).
The modular structure of OpenSignals allows the
simple implementation of new functionalities through
plugins or add-ons. The developer needs to gener-
ate the interface structure in HTML, set the events
triggered by the interaction between the user and in-
terface objects with JavaScript programming, and fi-
nally construct the Python processing algorithm.
The development logic is applied in the extension
of the HRV plugin towards real-time implementation.
BIOSIGNALS 2018 - 11th International Conference on Bio-inspired Systems and Signal Processing
210

3 ONLINE HRV MONITORING
IMPLEMENTATION
The implementation of Online HRV plugin comes
from the native offline processing steps described be-
low.
3.1 Offline Processing Steps
The majority of the HRV features can be directly im-
plemented into the online version. However, some
key features of the offline processing algorithm were
not implemented in the first version of the Online
HRV plugin, namely the Pan-Tompkins R-Peak De-
tection Method. This algorithm proves to be robust
and efficient, with correct detection rates higher than
90% (Pan and Tompkins, 1985). For simplicity, an
R-peak detection algorithm has been developed using
a two-threshold system that yields an acceptable level
of detection with simplicity of implementation.
A description of the Offline HRV plugin process-
ing steps, upon which future developments are based,
is provided below:
In a first phase, the system reads the file contain-
ing the acquisition. The loaded array enters the Pan-
Tompkins R-peak detection function.
Once the peaks are detected, the ECG signal pro-
ceeds to the steps of filtering, differentiation, integra-
tion and erroneous R-peak exclusion.
In the filtering step the signal is applied to the
input of a second order Butterworth band-pass filter
(bandwidth F
BW
= [5, 15] Hz). The differentiation of
the filtered signal is a simple sequential subtraction of
consecutive inputs. Differentiated values are squared
to avoid negative elements in the series (rectified dif-
ferences).
At this point, the integration of the signal takes
place using a sliding window of dimension N =
0.080 × sampleFrequency (s) and adding up the val-
ues. This value is chosen in order to approximate the
integration window size to the maximum duration (in
physiological terms) that QRS complex can present,
e.g. t ∼ 0.080s, half of the suggested value in the Pan
and Tompkins work.
As an alternative to an iterative sliding window ap-
proach, a cumulative signal is determined by simple
iterations:
s
cum
[i] =
i
∑
j=0
s
rect
[ j] (4)
Subsequently, an array with the dimension of the
rectified signal (M) is filled with the integrated values.
For i > N:
s
int
[i] = s
cum
[i] − s
cum
[i − N]
⇔ s
int
[i] =
i
∑
j=0
s
rect
[ j] −
i−N
∑
j=0
s
rect
[ j]
(5)
At the end of the previous steps, the initialisation
of the R-peak detection threshold occurs, according to
the characteristics of the integrated signal, selecting a
segment of 1 second of s
int
(typically this duration is
sufficient to guarantee that the segment contains a R
peak).
The threshold is initialised using the maximum
value of the integrated signal (s
peak
int
) in this segment
and a noise peak (n
peak
) is set to a null value, using
the reference formula:
threshold = n
peak
+ 0.25(s
peak
int
− n
peak
) (6)
Once the initialisation phase of the thresholds is
completed, the integrated signal scan is triggered with
the detection of all possible peaks (array Possible-
Peaks). A peak (maximum) is placed at any point
s
int
[i] where s
int
[i − 1] < s
int
[i] and s
int
[i] > s
int
[i + 1].
In this scan, a maximum is considered a candidate to
be a R peak if its amplitude is higher than the active
candidate peak (ActCandPeak).
ActCandPeak is updated whenever a maximum
with higher amplitude is detected. When a value
found in PossiblePeaks is separated from ActCand-
Peak by at least 200 ms, the present peak will be
stored in the array containing the probable R peaks
(ProbPeaks), becoming the new ActCandPeak.
The procedure takes place until the end of the list
of PossiblePeaks is reached. Finally, peaks stored in
ProbPeaks are compared against the threshold in or-
der to be included into the definitive list of R peaks
(RpeaksList).
For each peak in ProbPeaks where this criterion is
true the noise peak n
peak
update is triggered, chang-
ing the threshold value accordingly (adaptive logic of
algorithm).
The noise peak is determined with the expression
n
peak
= 0.125Voltage
peak
+0.875n
peak
, using the dig-
ital value/voltage associated with the probable peak
analysed and the old value of n
peak
.
Having the definitive list of R peaks, the algorithm
can proceed to the generation of the tachogram (RR
intervals).
However, prior to this step, the tachogram must
pass through ectopic beat removal process. This re-
moval is performed based on the user’s specifica-
tions. If the tachogram contains RR intervals last-
ing less/more time than the user-defined lower/greater
threshold, they are excluded.
Real-Time Approach to HRV Analysis
211

In addition to this, the user can also include an
additional level of filtering using an average sliding
window, that is, each sample of the tachogram is
scanned and the mean value of the tachogram sam-
ples contained in the user-defined window is deter-
mined. If the sample of present iteration has a dura-
tion exceeding the defined interval [avgValue + x% ×
avgValue; avgValue − x% × avgValue] it is excluded
from tachogram.
Finally, with the tachogram ready to be explored,
the HRV extraction begins.
3.2 Online Processing
In this subsection, we present several algorithm modi-
fications towards the real-time HRV assessment. One
of our main concerns when thinking of HRV monitor-
ing in real-time is the change of the physical activity
regime of the subject of study (e.g. walking, supine
resting, standing, etc.).
Along these lines, one of the key modifications
consists in an adaptive threshold for R-peak detection.
As opposed to the offline study, a threshold is used
and computed iteratively as the data is collected. In
order to set the initial values, the first few seconds of
the signal are taken and only used to compute the first
thresholds to apply in R-peak detection before being
discarded.
Consequently, a lag on the adaptation of the afore-
mentioned threshold is always present. By taking
five-seconds segments of the signal, the thresholds
for heartbeat (R-peak) detection are adapted from it-
eration to iteration. At the acquisition of every seg-
ment, ECG signal maximum and minimum values
(V
max
,V
min
) are computed to update the thresholds.
The triangular index, a geometric feature of the
tachogram, has also been included. This is described
here:
Geometrical Analysis
Triangular Index. A geometrical feature (not sub-
ject to outliers) taken from the RR intervals histogram
analysis. It is defined as the ratio between the total
number of samples (RR intervals) in the histogram
and the number of RR intervals on dominant bin. The
size of each temporal bin needs to be t
s
= 1/128s
(Vanderlei et al., 2010).
tIndex =
#TotalRRIntervals
#RRIntervalinModalBin
(7)
A greater triangular index indicates that a greater
proportion of RR intervals is concentrated inside a
single bin. Consequently, the heart rate variability is
low. Following reference guidelines, we know that
in order to obtain reliable results the time window
lengths of the ECG should be at least equal to 20 min-
utes (Task Force of The European Society of Cardiol-
ogy and The North American Society of Pacing and
Electrophysiology, 1996).
3.3 Online HRV Plugin Presentation
Methods
Implementing existing HRV Offline plugin algorithms
into the Online variant is not a straightforward pro-
cedure, since the user’s access to understandable and
reliable information in real-time must be taken into
consideration.
In the offline version, regardless of acquisition du-
ration, the user only has access to one value for each
HRV index. This approach is not adequate in real-
time analysis, since a value, even if updated periodi-
cally, is difficult to interpret when separately viewed.
Thus, the chosen methodology aims to provide the
user with the possibility of monitoring the evolution
of the different HRV indices throughout the acquisi-
tion, highlighting the trends and variations.
This dynamic approach is possible using a sliding
window mechanism, as presented in fig. 5. For each
window, a value is extracted for the multiple features
in the segment of the ECG signal contained within its
boundaries.
The windows should overlap, which becomes
more practical for the user since the existence of com-
mon information between windows makes the index
variation more gradual and, at the same time, allows
the sampling rate of new values for the indices to be
higher as compared to a non-overlapping sliding win-
dow.
The above specifications are important in a sys-
tem/interface interactivity perspective. We emphasise
the online algorithm characteristics to guarantee the
rigour and the statistical or physical meaning of the
extracted indices.
To ensure that the measurements are reliable, the
sliding window size is the key factor. In the biblio-
graphical research, it is noticed that feature extraction
in the temporal domain uses windows that should con-
tain a segment with at least 30 seconds of the ECG
signal (Acharya et al., 2006), although longer dura-
tion windows provide increased statistical relevance,
since more RR intervals are used.
However, it is necessary to understand that ex-
tremely large windows translate into a lower temporal
resolution. Hence, a compromise must be reached be-
tween the statistical perspective and temporal uncer-
tainty.
As for the features extracted from the frequency
domain, the time window should have a minimum du-
BIOSIGNALS 2018 - 11th International Conference on Bio-inspired Systems and Signal Processing
212
ration of 2 minutes, enabling the computation of the
power values of the VLF, LF and HF bands. Shorter
windows translate into insufficient frequency resolu-
tions to distinguish the elementary components of the
spectrum in the different bands.
With a window of 2 minutes, however, informa-
tion about the ULF band is lost, which denotes some
importance in clinical terms. The user should increase
the duration of the window if the extraction of infor-
mation from this band is desired.
A simple presentation of the real-time HRV as-
sessment plugin interface is provided in this sec-
tion (HTML and JavaScript functionalities), from the
user’s point of view. The graphical interface is intro-
duced in order to facilitate the access to the different
functionalities of the platform.
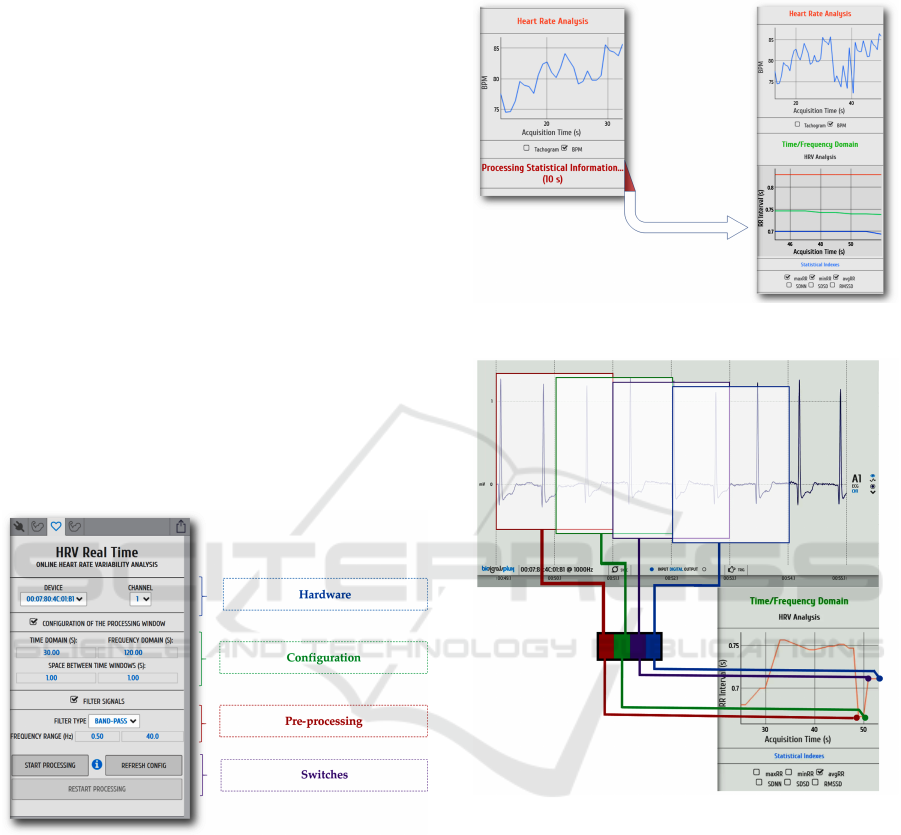
In the case of HRV monitoring, parameter con-
figuration for the algorithm is enabled through
OpenSignals. One of the key parameters is the filter
choice and configuration (high-pass, band-pass, cut-
off frequencies, etc.) (see fig. 3).
Furthermore, time domain characteristics such as
sliding window length and window overlapping can
also be set.
Figure 3: OpenSignals HRV configuration.
In order to start the processing of the signal, sev-
eral samples are required. Hence, some warm-up time
is necessary before presenting the first visualisation
plots (fig. 4).
Right after the obtention of the first plots, the user
can choose which are the features of interest for the
HRV study. The real-time HRV analysis plugin is
based on a sliding window approach. Every consec-
utive window is responsible for the computation of
single values that make up the temporal series of fea-
tures.
The sliding window concept is illustrated in fig. 5
example. Window duration values in the example are
merely illustrative. When processing HRV data, the
window duration is always set to values greater than
t = 30s.
Figure 4: OpenSignals HRV warm-up.
Figure 5: OpenSignals HRV sliding window.
The signal acquisition and analysis can be inter-
rupted or reset at any time, changing the configuration
when needed. The software allows the generation of
report files that summarise the signal features of in-
terest.
4 DISCUSSION
The online access to features allows to set further de-
tection mechanisms and thresholding to detect prede-
fined conditions directly during acquisition. Track-
ing of the features and their evolution is possible, as
plots are built and shown dynamically through the in-
terface.
Real-Time Approach to HRV Analysis
213

Regarding features obtained in real-time, some re-
marks are needed. On the one hand, there is an im-
portant limitation on the window sizes. Frequency
related features pose the question of the need for a
minimal warm-up phase (so that spectral representa-
tion is relevant). Features such as nonlinear Poincar
´
e
measures can be remarkably affected when values be-
low 5 minutes are used as window lengths. Further
research is needed to support the idea that low values
do not compromise nonlinear features. There is no
reason to think that feasibility of the online procedure
is further compromised once these requirements are
met.
On the other hand, our preliminary tests on ac-
quired data show relevant differences between the
tachograms generated by the two methods (on-
line/offline). This is solely a consequence of working
with a simpler peak detection algorithm. Our priority
for further development is, hence, the implementation
of the robust R-peak detection algorithm (J. Pan and
W. Tompkins) providing not only a more precise de-
tection but also fewer false R peaks.
In order to guarantee that the online approach
provides meaningful information, a validation step
against offline treatment is needed. Once peak de-
tection is updated, the procedure consists in the ap-
plication of both processing methods (online and of-
fline) to the same collected data samples. Each of
the two methods provides a set of peaks and features
that are to be compared. Taking offline peak detection
as a reference, comparison of the two algorithms is
achieved by computing the amount of wrongly placed
peaks. Once tachograms are generated, an align-
ing process takes place by the use of standard cross-
correlation procedures. Tools such as Bland-Altman
plots, which are frequently used in new ECG acqui-
sition approaches against well-established reference
procedures, provide statistical insight to analyse our
implementation.
Into this regard, frequencies (F
s
≥ 1000 Hz) guar-
antee the best peak detection. The need for valida-
tion with sufficiently large ECG databases has already
been identified. Widely used Physionet databases
with healthy ECG recordings such as the MIT-BIH
Normal Sinus Rhythm (Goldberger et al., 2000) are
possible candidates for this task. In accordance with
frequency requirements, interpolation preprocessing
of signals may be necessary.
In the first line of implementation, measures of
cardiac variability studied were essentially linear,
with the exception of Poincar
´
e Analysis. This is done
considering that some non-linear parameters could be
incompatible with a real-time analysis methodology
due to their greater computational complexity.
Further developments could include the explo-
ration of more complex and robust parameters,
namely the determination of the approximate entropy
of the HRV signal, provided it can be realised in
an online system. This would allow to identify ob-
jectively which is the degree of complexity of the
tachogram through a quantitative result (higher val-
ues denote a greater complexity and irregularity of
the time series, that is, a greater cardiac variability).
The interest of this measure lies on the capability to
overcome the limitations of the linear measurements.
Considering that the heart rate modulation is the re-
sult of the interaction of several physiological sys-
tems and mechanisms, there is an intrinsic underlying
non-linear behaviour, only accessible by these means
(Singh and Kaur, 2016).
5 CONCLUSION
HRV continues to trigger the interest of the scientific
community nowadays. This is particularly relevant
in the context of sports research, considering the cen-
tral role of the cardiovascular system in athlete perfor-
mance and establishing cardiac variability as an indi-
cator of the adaptive capabilities of the organism.
Recent studies, such as (Paliwal et al., 2016;
Schmitt et al., 2015; Schmitt et al., 2016), illus-
trate the potential of HRV assessment. Real-time
analysis research, e.g. (Lv et al., 2015) and (Tsun-
oda et al., 2016), present sliding window based ap-
proaches more in line with our contribution. The
works of Lv and Tsunoda are two examples of the
informative potential of the HRV, leading to the iden-
tification of cardiac pathologies and the measurement
of the cognitive efficiency.
The processing functionalities described in our
work provide a quick and adjustable real-time anal-
ysis of HRV. This allows the information contained in
the acquired signals to become meaningful. Our test
implementation shows that feedback during the acqui-
sition can be achieved with real-time processing, of-
fering additional information that complements HRV
monitoring towards a prognosis focused view.
The HRV online plugin is an initial approach on
translating information processed by an offline plu-
gin into real-time logic. Despite the limitations arisen
throughout our study and the further developments
needed, the structure of the presented approach is al-
ready well established, namely the system of user-
defined sliding windows.
Due to the fact that this is an ongoing research,
many future modifications are envisioned, as dis-
cussed in the previous section. A following direc-
BIOSIGNALS 2018 - 11th International Conference on Bio-inspired Systems and Signal Processing
214

tion could be the application of the same develop-
ment guidelines to other types of signals, such as
the implementation of the EMG plugin for real-time
processing. As discussed before, this opens a wide
range of application development in areas like high-
performance sports and the detection of threatening
heart conditions.
ACKNOWLEDGEMENTS
The authors acknowledge the support received from
ITN AffecTech under the Marie Skłodowska Curie
Actions (ERC H2020 Project ID: 722022).
REFERENCES
Acharya, U. R., Joseph, K. P., Kannathal, N., Lim, C. M.,
and Suri, J. S. (2006). Heart rate variability: a re-
view. Medical & Biological Engineering & Comput-
ing, 44(12):1031–1051.
Alves, A. P., Silva, H., Lourenc¸o, A., and Fred, A. (2013).
BITtalino: A biosignal acquisition system based on
the arduino. In Proceedings of the International
Conference on Biomedical Electronics and Devices.
SciTePress - Science and and Technology Publica-
tions.
Chor
˜
ao, R., Sousa, J., Ara
´
ujo, T., and Gamboa, H. (2012).
A new tool for the analysis of heart rate variability of
long duration records. In Proceedings of the Interna-
tional Conference on Signal Processing and Multime-
dia Applications and Wireless Information Networks
and Systems. SciTePress - Science and and Technol-
ogy Publications.
Chou, C. C., Tseng, S. Y., Chua, E., Lee, Y. C., Fang, W. C.,
and Huang, H. C. (2011). Advanced ECG proces-
sor with HRV analysis for real-time portable health
monitoring. Digest of Technical Papers - IEEE Inter-
national Conference on Consumer Electronics, pages
172–175.
Goldberger, A. L., Amaral, L. A. N., Glass, L., Hausdorff,
J. M., Ivanov, P. C., Mark, R. G., Mietus, J. E., Moody,
G. B., Peng, C.-K., and Stanley, H. E. (2000). Phys-
ioBank, PhysioToolkit, and PhysioNet : Components
of a New Research Resource for Complex Physiologic
Signals. Circulation, 101(23):e215–e220.
Goli
´
nska, A. K. (2013). Poincar
´
e plots in analysis of se-
lected biomedical signals. Studies in Logic, Grammar
and Rhetoric, 35(1).
Lv, T., Ko, M., Stark, B., and Chen, Y. (2015). An On-
line Heart Rate Variability Analysis Method Based on
Sliding Window Hurst Series . Journal of Fiber Bio-
engineering and Informatics, 8(2):391–400.
Paliwal, S., Lakshmi, C. V., and Patvardhan, C. (2016). Real
time heart rate detection and heart rate variability cal-
culation. In 2016 IEEE Region 10 Humanitarian Tech-
nology Conference (R10-HTC), pages 1–4. IEEE.
Pan, J. and Tompkins, W. J. (1985). A real-time QRS de-
tection algorithm. IEEE Transactions on Biomedical
Engineering, BME-32(3):230–236.
Pimentel, A., Gomes, R., Olstad, B. H., and Gamboa, H.
(2015). A new tool for the automatic detection of mus-
cular voluntary contractions in the analysis of elec-
tromyographic signals. Interacting with Computers,
27(5):492–499.
Plux (2012). Biosignalsplux. http://biosignalsplux.com/en/.
Plux (2013). Bitalino. http://www.bitalino.com/en/.
Plux (2016). Opensignals datasheet.
http://bitalino.com/datasheets/OpenSignals Datasheet.pdf.
Schmitt, L., Regnard, J., Auguin, D., and Millet, G. P.
(2016). Monitoring training and fatigue status with
heart rate variability: case study in a swimming
Olympic champion. Journal of Fitness Research,
5(3):38–45.
Schmitt, L., Regnard, J., Parmentier, A. L., Mauny, F.,
Mourot, L., Coulmy, N., and Millet, G. P. (2015). Ty-
pology of Fatigue by Heart Rate Variability Analysis
in Elite Nordic-skiers. International Journal of Sports
Medicine, 36(12):999–1007.
Singh, A. and Kaur, J. (2016). Approximate Entropy
(ApEn) based Heart Rate Variability Analysis. Indian
Journal of Science and Technology ISSN, 9(947):974–
6846.
Task Force of The European Society of Cardiology and The
North American Society of Pacing and Electrophys-
iology (1996). Heart rate variability : Standards of
measurement, physiological interpretation, and clini-
cal use. Circulation, 93(5):1043–1065.
Tsunoda, K., Chiba, A., Chigira, H., Yoshida, K., Watan-
abe, T., and Mizuno, O. (2016). Online Estimation of
a Cognitive Performance using Heart Rate Variability.
IEEE 38th Annual International Conference of the En-
gineering in Medicine and Biology Society (EMBC),
2016, pages 761–765.
Vanderlei, L. C. M., Pastre, C. M., J
´
unior, I. F. F., and
de Godoy, M. F. (2010).
´
Indices geom
´
etricos de vari-
abilidade da frequ
ˆ
encia card
´
ıaca em crianc¸as obesas
e eutr
´
oficas. Arquivos Brasileiros de Cardiologia,
95(1):35–40.
VanderPlas, J. T. (2017). Understanding the Lomb-Scargle
Periodogram.
Real-Time Approach to HRV Analysis
215
