
Applying and Managing PBL
An Experience in Information Systems Education
Gustavo H. S. Alexandre
1,2
, Simone C. Santos
1
, Ariane N. Rodrigues
1
and Priscila B. Souza
1
1
Institute Informatics Center - Federal University of Pernambuco, Recife, Brazil
2
CESAR School, Brum Street, Recife, Brazil
Keywords: Student-centered Learning, Information Systems Education, PBL Framework, Experience Report.
Abstract: The dynamism of the global economy and its growing dependence on Information Technology, more
complex and integrated, has required a transformation in the education of software professionals with the
focus on the development of skills such as teamwork, real practice of problem-solving, managerial profile
and analysis of solutions. In this context, the Problem-Based Learning (PBL) approach falls as a glove for
the training of professionals in these competencies. From this motivation, this paper describes the
application of the PBL approach in an Information Systems course. Aiming the effectiveness of this
approach, the Framework described in (Santos and Rodrigues, 2016) was applied, which proposes tools for
the planning, execution, monitoring, and improvements of PBL. The results showed the suitability of the
Framework for this purpose, describing how it was applied and how the PBL can be managed, besides
emphasizing main benefits and improvement points from this application.
1 INTRODUCTION
The education of the professionals in Computing
area has undergone several transformations to adapt
to the demands of the labor market, in the face of
continuous technological changes and increasingly
complex and integrated applications. One of the
main changes concerns to need of holistic view of
different subjects, prioritizing educational objectives
based on the development of skills and abilities,
rather than knowledge about isolated content
disconnected from practices. This change is reflected
in the most recent versions of the main curricula in
the Computing area ACM/IEEE Computing Science
(Draft, 2013) and ACM/IEEE Software Engineering
(ACM/IEEE, 2015), which stand out as principles
the real problem-solving ability, project
management experience and the ability to critically
analyse solutions. All of these principles are
multidisciplinary and developed from the work in
group and real labour experiences.
From this motivation, this paper describes a case
study of an Enterprise Management Systems (EMS)
course, part of an undergraduate course in
Information Systems (IS). In order to align the
purpose of this course to labour market demands, we
chose to adopt the Problem-Based Learning
approach (PBL), considering its increasing
popularity in this area (Martin, 2005), (Tuohi, 2007),
(Peng, 2010), (Zaharias, 2012), (Oliveira, Santos and
Garcia, 2013), (Panwong, 2014), (Santos, Figueiredo
and Wanderley, 2013), (Santos, Furtado and Lins,
2014), (Santos, Alexandre and Rodrigues, 2015).
PBL is defined in (Savery, 2006) as an
instructional method of teaching and learning, which
is able to develop the ability to apply diverse
knowledge to solve problems, through teamwork
and individual attitudes as self-initiative, critical
vision and reflection of the learning process,
conforming its principles. Its dynamics are very
different from traditional learning, where students
usually work on projects far from the reality of the
market, under conditions and restrictions imposed by
the teacher (teacher-centered approach), which aims
to explain a large amount of content and consequent
low practical application. In PBL, students are the
center of the learning process, and if the problem
being solved and the learning environment are
authentic, more prepared for the professional reality
the students will be. In addition, the skills and
abilities developed in PBL are consequences of
intense collaborative and investigative work. In
traditional teaching, students tend to work
individually, often with little interaction and
knowledge sharing. This process does not favor the
Alexandre, G., Santos, S., Rodrigues, A. and Souza, P.
Applying and Managing PBL.
DOI: 10.5220/0006644100570067
In Proceedings of the 10th International Conference on Computer Supported Education (CSEDU 2018), pages 57-67
ISBN: 978-989-758-291-2
Copyright
c
2019 by SCITEPRESS – Science and Technology Publications, Lda. All rights reserved
57

development of interpersonal skills such as
communication, leadership, planning, but focusing
almost always in technical knowledge. Computer
students acquire knowledge in technologies,
processes and development methods, while the
interpersonal skills, important to solve problems, are
little explored.
The authors of this paper also understand that for
an effective PBL approach it is necessary to preserve
its principles and manage its processes throughout
learning cycles, within an essentially practical
environment. Despite the benefits of PBL, evidences
identified in (Oliveira, Santos and Garcia, 2013)
indicate that there are difficulties regarding the
application of PBL and verification of its results.
The lack of knowledge about the methodological
fundamentals of PBL, aligned with disjointed ideas
about the operationalization of the method, common
in innovations, are aspects that contribute to low
interest and incoherence in its application.
In order to provide support to PBL
implementation, the few available proposals have
been focus on different aspects of the "problem
element”. For (Hung, 2006) problem-building needs
to gain more attention because aligning the quality
of problems with learning objectives is a challenge
that has an effect on learning. The author presents
the 3C3R model as a conceptual framework for the
conception of problem ideas. The model name
highlights central components related to C's
(content, context, connection); and R's (researching,
reasoning, reflecting) as processing components.
The central components have the function of
establishing a basis for the definition of the
problems, and the processing components aim to
facilitate the students' involvement in the resolution
process. Even if this artifact can contribute to the
planning stage, there are no considerations regarding
the management of the application of the problem
and follow-up of the learning. Having effective
problems by component descriptions does not make
the teaching and learning process effective, even if it
is one of the factors that contributes to the results. In
(Hung, 2009), the author proposes a process for
designing problems in nine steps. This process is
indicated to assist in the application of the 3C3R
model. Another solution to be highlighted is the VU-
PBL framework used by Victoria University in
Australia for computing science and engineering
courses. The VU-PBL framework consists of four
main components: key elements, PBL principles,
PBL cycle and PBL levels. The key elements are
four (problem design, facilitation, engagement and
evaluation). They make up the central part of the
strategically defined cycle for the effective
implementation of PBL. In order for each element to
be effectively considered in the implementation, ten
principles are distributed among them. The cycle is
intended for the student, who can lead learning
process through seven steps. The cycle and its steps
are similar to the PBL process defined by Barrows
(2002). In fact, these solutions highlight isolated
parts of the implementation process of the PBL, with
few operational and managerial supporting to this
approach, considering the entire management cycle.
In order to ensure a manageable implementation
of the PBL approach, this case study uses a PBL
framework for computer teaching published in
(Santos and Rodrigues, 2016). This framework
proposes the management of PBL in learning cycles
based on the Management Cycle of Deming (Plan-
Do-Check-Act), supported by processes and artifacts
that facilitate the planning, execution, monitoring
and realization of continuous improvements along
the teaching and learning process. From this study it
was possible to understand the importance of a
management process that allows: to plan PBL based
on essential elements; to execute the learning
process supported by continuous evaluations and
feedbacks; and to improve the learning process
along the course.
2 THE FRAMEWORK
BY-CYCLES
In (Santos and Rodrigues, 2016), the authors defined
a framework to apply PBL in teaching of
Computing. This framework aims to facilitate the
management of teaching processes in the PBL
approach through techniques and management
models. Intended for the pedagogical team, this
instrument indicates a set of actions that need to be
considered at each step of the Plan-Do-Check-Act
cycle of Deming (as shown in Figure 1), relating
roles and responsibilities to the actors for an
effective application of the PBL approach.
The components of this framework are: 1) xPBL
(Santos, Furtado and Lins, 2014), as a methodology
specific to the framework that considers techniques
and management tools; 2) PBL-Process, as a PBL
process consists of steps that help conduct the
methodology, as well as steps to encourage the
student to the learning process; 3) PBL-SEE (Santos,
2016) as an authentic assessment model to verify the
student's performance, PBL and teaching process; 4)
CSEDU 2018 - 10th International Conference on Computer Supported Education
58
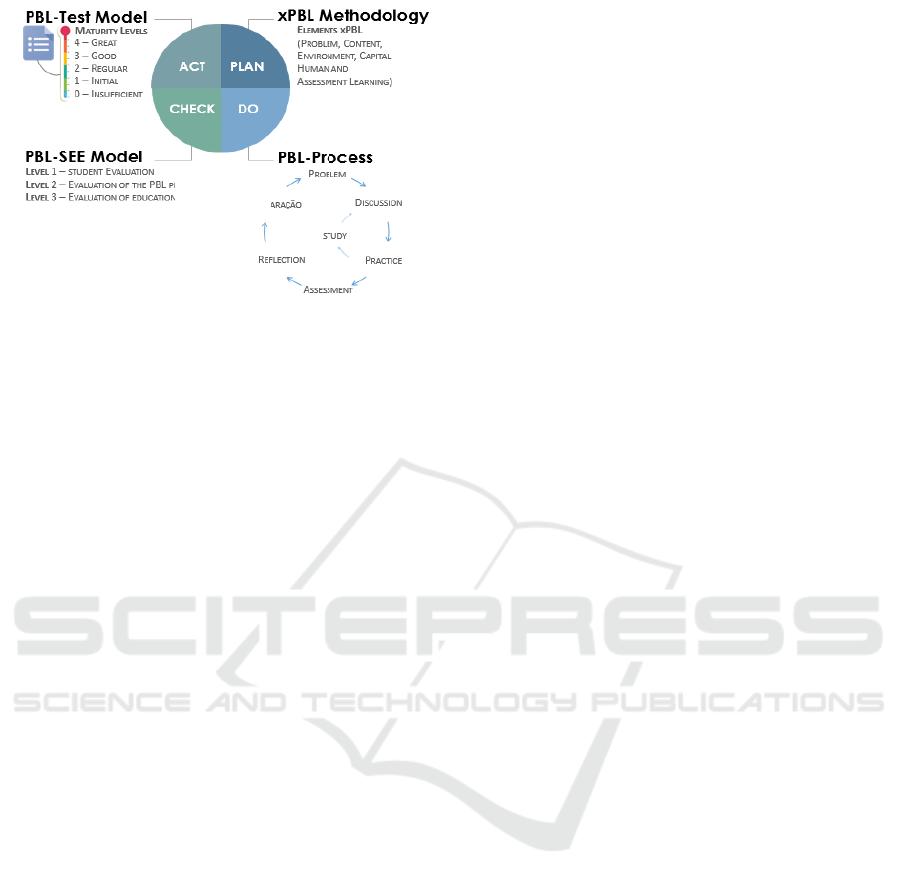
Figure 1: Steps of PBL Framework.
PBL-Test, process maturity model in PBL. The
following sections highlight component details and
their relationship to the framework steps.
2.1 Plan: xPBL Methodology
Based on the principles of the PBL approach, xPBL
considers management techniques to facilitate the
implementation of the teaching process (Santos,
Furtado and Lins, 2014). Purposely, the five
elements that make up the xPBL defined to ensure
adherence to the principles process, envision
characteristics necessary for the PBL process. The
elements refer to: 1) Problem, an essential aspect in
learning in this approach, reflects realism and
complexity similar to real contexts; 2) Environment,
related to the definition of an authentic learning
environment that reflects the actual context of the
professional market; 3) Human Capital, with
evidence to the roles and responsibilities of the
pedagogical team in the planning, execution and
follow-up of the process; 4) Content, as an essential
part to support the theoretical basis of the problem
solving process, consistent with the context of the
problem; And 5) Processes, for the adequacy of
evaluation processes inherent to the learning format
in PBL. Thus exposed, consider the planning process
xPBL requires consider and define aspects of the
five elements.
According to the authors, a plan of action guided by
the 5W2H technique sees to it that the five elements
are defined in a clear and organized way because
they obtain answers to questions such as: "What?",
"Who?", "Where?", "When?", "Why?", "How?" and
"How much?". As an effective management
technique, 5W2H sees to it that activities associated
with each xPBL element are broken down, analysed
and summarized during the planning stage. The
authors objectively considered information about
what should be done and when, or who will conduct
a certain activity and when, while they were defining
each element.
2.2 Do: PBL-Process
The PBL-process was set to meet the dynamics of
learning in PBL. With immersive learning
characteristics in problem solving practices, have a
process to run consistently the learning cycle
becomes essential. The PBL-process is a seven step
process for an iterative execution of learning cycles:
1) Preparation, the pedagogical team defines
specifications of the methodological context and
learning environment; 2) Problem, step for
presentation of real problems by real clients; 3)
Discussion, when student groups can identify
solution possibilities supported by the Delisle
resolution process (Delisle 1997) And raise learning
needs; 4) Practice, possibility for application of
methods, models, theories to the problem context; 5)
Study, moment to meet the learning needs identified
by the group; 6) Assessment, opportunity for
verification of learning and skills development; And
7) Reflection, in-depth analysis of different aspects
of the learning process. During a learning cycle, it is
important to note that steps 3, 4 and 5 do not
necessarily take this order. A team can, for example,
identify the need for the study before the practice or,
if they already have conditions, practice
immediately.
2.3 Check: the PBL-SEE Model
As a model aligned with PBL, its use is indicated for
software engineering since it is based on valuation
models processes used by software industry
professionals (Santos, Figueiredo and Wanderley,
2013). In this case, the Check step of the framework
is supported by this component in order to verify if
the learning objectives were completely achieved,
but also the process faithfully adheres to the PBL
principles. In summary, the model is composed of
three levels: student evaluation (level 1), evaluation
of the PBL process (level 2) and evaluation of
education (level 3).
For level 1, five perspectives are considered: 1)
Content, for the possibility of verifying the
appropriation of knowledge acquired by the students
throughout the resolution process; 2) Process, as
indicative to verify the ability to apply knowledge in
the resolution process defined by the team; 3)
Result, from the delivery of solutions (products)
created to address the context of the problem; 4)
Applying and Managing PBL
59

Performance, through the subjective analysis of
interpersonal characteristics by the students (self
assessment) and their team (peer review); And 5)
Customer satisfaction, when considering an
evaluation from the perspective of the client, with
criteria for the defined solution and aspects directed
to the performance of the team.
Level 2 of the model uses the PBL-Test as
described in the following subsection.
Finally, level 3 focuses on getting information
about the planning and teaching program, from the
perspective of the students. At this level, the teacher
is also evaluated under criteria that refer to skills
inherent in teaching practice, as well as ethical
aspects.
2.4 Act: PBL-Test Model
In the Framework, the act step maintains focus on
the continuous improvement of the PBL process
from the application of a test called “PBL-Test”
(Santos, Figueiredo and Wanderley, 2013), in order
to identify possible methodological deviations that
may render the fidelity of the approach unfeasible.
This model is based on the need to evaluate the
maturity of the PBL process regarding the execution
of its principles, aligned to level 2 of the PBL-Test
model.
In this case, a test with ten questions of multiple
choices, referring to the principles, must be filled
under the optics, perception and experience of
human capital. For each evaluation, a score of 0 to
10 points can be obtained. All the answers are
computed from an arithmetic average of the scores
to generate the test result and thus identify the level
of maturity of the process: 1) level 0 or insufficient
(average <7); 2) level 1 or initial (7≤ general average
<8); 3) level 2 or regular (8 ≤ general average <9);
4) level 3 or good (9 ≤ general average <10); and 5)
level 4 or excellent (general average = 10). Once the
level is identified, it is up to the PBL tutor, along
with the pedagogical team, to identify strategies that
can be implemented considering the principles that
have had the most impact in the execution of the
PBL process.
This assessment becomes effective when at least
more than two verifications are performed in the
running learning cycle so that improvements can be
implemented in a timely manner. By the
recommendation of the model, all the human capital
defined by the pedagogical team, students and
coordinators, needs to be involved in this evaluation.
3 METHOD
The guidelines for the scientific method which
shapes the different stages of this research study, can
be found in Design Science Research (DSR), a
research method which involves analyzing the use
and performance of artifacts that are designed to
understand, explain and improve the behavior of
specific factors in the domain of Information
Systems (Vaishnavi, 1999). The basic principle of
DSR is that the knowledge, understanding and
problem solving are acquired in the construction and
application of an artifact within the context of a
specific problem. In this context, the DSR method
was adopted in five steps:
1) Understanding the Problem to obtain a clearer
understanding of PBL, its principles and
characteristics that, in the view of several authors,
govern the PBL method. It was possible to identify
the challenges and any particular obstacles that
might face the PBL method. As a result, a list of
problems regarding the management of PBL was
highlighting, such as the following: how to apply a
PBL approach, the difficulty of setting out a
procedure to assist the students with problem-
solving, the complexity of assessment, among other
factors.
2) Suggestions step was to make conjectures
about how processes and management models can
be used to facilitate the application of PBL
approach. After this, it was possible to design a
model for PBL planning (Santos, Furtado and Lins,
2014) and an assessment model aligned to this
planning (Santos, 2016). As a result, a conceptual
model of the Framework was originated (Figure 1).
3) Development step was to define the PBL
Framework, considering all steps of the PDCA
cycle. This led to the design of a maturity model of
PBL based on its principles (Santos, Figueiredo and
Wanderley, 2013) and propose a PBL process to
support the solving-process by students.
4) Assessment step was to understand the
preparation, application and analysis of the artifacts,
together with the end users, with the aim of
determining, in the first moment, the applicability of
the Framework. This resulted in the setting out of
improvement in Framework components along
several experiences of use (Monte, Rodrigues and
Santos, 2013), (Santos, Furtado and Lins, 2014),
(Santos, Alexandre and Rodrigues, 2015), (Santos
and Rodrigues, 2016).
5) Conclusion stage was to understand what we
learn. It should be mentioned that the assessment
procedure foresees future cases.
CSEDU 2018 - 10th International Conference on Computer Supported Education
60

4 EXPERIENCE REPORT
The Framework PBL was applied in an Enterprise
Management Systems (EMS) course, part of an
undergraduate course in Information Systems (IS).
This course has a total of 60 hours distributed in 4
months. The objective of the course was to enable
students to design and implement management
information systems, considering their requirements
for business success. The course had 29 students
with a mean age of 20, 3 were female and 26 were
male.
The following subsections describe the
application of the Framework in each PDCA steps,
emphasizing the main interventions related to PBL
managing in this course.
4.1 Planning
Regarding the PBL planning, the five elements of
xPBL were considered.
With respect to the learning environment, 29
students were divided into 7 teams: 3 teams with 5
students; 2 teams with 4 students and 2 teams with 3
students. Of the 29 students with a mean age of 20, 3
were female and 26 were male. The criteria for team
formation were: professional experience,
professional interest (manage, model solutions or
program) and the identification of the profile of the
student (artisan, guardian, idealist and rational),
being identified by the application of the simplified
version of the MBTI - Myers-Briggs Type Indicator
(Myers 1980). To support the communication
process and facilitate the distribution of course
educational materials, the following tools have been
adopted: Google Drive and WhatsApp group. Each
team was able to freely choose the process of
planning and managing their project. The only
request of the pedagogical team to the students was
to make possible the monitoring and follow-up via
WEB of the planning and development of the
projects. For planning, six teams adopted the Trello
tool and one team adopted the Pivotal tracker tool.
For development teams used Google Drive as a
repository of documents. As for the classroom, it
consisted of a blackboard, besides to individual
chairs, which could be grouped together to facilitate
group work. Although the ideal environment needs
to have the same configuration of work
environments in the industry, it was not an obstacle
to running the course. The students still had five
laboratories inside the Computer Center with
computers to carry out their activities.
About the problem definition, the pedagogical
team tried to identify real projects with business
partners of the respective university, seeking
possible clients to bring their real problems to the
teams. As a way to meet the educational goals and
competencies associated with the course, the
teaching team oriented potential clients that the
problems to be presented should be concern to the
Enterprise Management Systems context. During the
second week of class, three invited clients came to
the classroom and presented a set of real problems
which the teams could freely choose the one that
interested them the most. All clients were managers
in the implementation of business management
systems, one of them SAP partner.
Considering the human capital involved, the
teaching staff of the course called the pedagogical
team consisted of one teacher and two tutors (one
PBL tutor, and one technical tutor). In general, tutors
aimed to continuously support the teaching-learning
process of students. Specifically, the role of the PBL
tutors was to support the execution of the xPBL
methodology (Santos, Furtado and Lins, 2014) used
in the course. And the technical tutors had the
function of supporting the students in the specific
subjects of the course. During class, there was
always the presence of at least one PBL tutor and a
technical tutor attending the project follow-up
meetings. Complementing the human capital of the
course, there was the role of the project manager
who was a student belonging to his respective team
and elected by the team itself. The other members of
the team worked in the role of developers of
management systems. Finally, the real client was an
IT professional with real and specific demands on
business management systems.
The content that was worked on in the discipline
served as support for students throughout the
problem solving process. The main reference of the
content was the book Management Information
Systems (Laudon and Laudon, 2004). Moreover, in
order to present the concepts of the PBL approach, a
lecture on PBL and its principles was given to the
students. Then a lecture and a dynamic on the
problem solving process according to the Delisle
model (Delisle 1997), another lecture on critical
success factors in the implementation of
management systems and finally a lecture on
stakeholder management.
Finally, the evaluation process was applied in all
dimensions of the PBL-SEE (Santos, 2016). Here,
only two dimensions are presented: the first one
related to students assessment (Content, Process,
Results, Performance and Customer Satisfaction);
Applying and Managing PBL
61

and the second dimension with focus on degree of
maturity of the PBL approach, from the perspective
of students, and the use of PBL-Test model. The
results of these evaluations will be further detailed in
section 3.3.
4.2 Doing
In order to help students to better understand the
problem chosen and propose a more adequate
solution to it, was developed a dynamic that made
use of Delisle problem-solving model (Delisle
1997). The model is composed of four aspects that
must be observed: 1) Ideas: possible solutions to the
problem; 2) Facts: information about the problem; 3)
Hypotheses, identification of learning problems to
solve the problem and; 4) Plan of Action: strategies,
information resources and other information that
lead to the resolution of the problem.
Once the understanding of the chosen problem
was clearer, each team had to formalize the problem
describing it in some ways such as the context of the
problem, its causes and complexity, the target
audience, customer needs, and so on. To help in
describing the problem, were given to the teams a
questionnaire model that reflected these aspects.
Teams were also asked to describe their initial
proposals for solutions through questions that guided
students about the criteria for evaluating possible
solutions, problem solving strategies, needed
resources, and benefits for the client.
The Enterprise Management Systems (EMS)
course was conducted over four learning cycles,
with the respective goals:
▪ 1st. Cycle (Understanding the problem): the
objective of this cycle was to evaluate if the
teams identified a viable problem, considering
the time and effort constraints imposed by the
course schedule and team formation; If the
students understood the causes and impacts of
the problem in question; If the teams defined
the roles and responsibilities of each member
in the problem solving process; If they
planned and scheduled the necessary actions
to initiate a EMS project. This cycle marked
the beginning of the project, so its main focus
was "planning".
▪ 2nd. Cycle (Proposal of solutions): this cycle
had as main focus to evaluate the maturity of
the students in the understanding of the
problem from interactions with the real clients
and teamwork, describing specifically one
solution within a defined project scope. This
cycle was responsible for the delimitation of
one solution, therefore, focused on the "scope"
of the product to be delivered.
▪ 3rd. Cycle (Prototyping a solution): The
purpose of this cycle was to evaluate the
ability of teams to prototype a solution, in
accordance with the requirements of the real
client and users. This cycle focused on the
design of an IS solution, therefore, focused on
the "system design".
▪ 4th. Cycle (Delivery a solution): finally, this
last cycle had the objective of evaluating
students' understanding of the problem solving
process as a whole, as well as the proposed
solution and the necessary requirements for its
implementation and effective adoption. The
aim of this cycle was to understand the
"solution" as a whole.
It is important to emphasize that the definition of
these cycles had as reference the problem solving
process of managerial information systems defined
in (Laudon and Laudon, 2004). From the objective
of each cycle, it was possible to define the necessary
evaluations, having as main reference the PBL-SEE
assessment model (Santos, 2016), an integral part of
the PBL framework. For this case, only the results of
levels 1 and 2 of the PBL-SEE will be presented in
this paper.
4.3 Checking
To develop the essentials skills the student
assessment, recommended by PBL-SEE model was
applied in accordance with the five perspectives
(Content, Process, Output, Performance and Client
Satisfaction). Table 1 shows the types of assessment
conducted within each module, and highlights the
instrument used for the assessment: subjective test,
one with focus on process resolution concepts and
other with focus on knowledge about the project
decisions; the Meeting to start the Project (Kick-off);
the Project monitoring meeting or remote
monitoring (status report); the final presentation, to
delivery the solution.
Table 1: Types of Assessment per Learning Cycle.
Individual Assessment (Summative)
# Cycle
Content
Performance
1
-
-
2
1st subjective
test
questions form
3
2st subjective
test
questions form
4
-
-
Group Assessment (Formative)
CSEDU 2018 - 10th International Conference on Computer Supported Education
62
# Cycle
Process
Output
Client
1
Kick-off
Kick-off
Kick-off
2
1st status
report
1st status
report
1st status
report
3
2nd status
report
2nd status
report
2nd status
report
4
Final
presentation
Final
presentation
Final
presentation
The 1st. Cycle and the 4th. Cycle were related to
the initial and the end of the project steps,
respectively. Thus, only the evaluations from the
group perspective (Process, Output and client
satisfaction) were applied. The individual
evaluations of Performance and Content aspects are
not adequate in these situations, when much
information is missing or the project is already
finalizing. As for the 2nd. and 3rd. cycles, all five
perspectives (process, output, client satisfaction,
performance and content) were applied. The results
are presented and discussed in the following
subsections. For the calculation of the students'
overall performance in the course, it was used the
following formula:
20% * AA(Content) + 20% * AA(Process) + 20% *
AA (Output) + 20% * AA(Performance) + 20% *
AA(Client satisfaction),
where “AA” corresponds to the arithmetic mean of
the scores related to each perspective, when there is
more than one score.
Regarding the Content perspective of the student
assessment model, two subjective tests were applied
in the 2nd. and 3rd. learning cycles.
The first test had the objective of the students'
understanding of the problem solving process,
regarding the implementation of a EMS for the
respective real client. As a result, the general
average of the class was 3.19, considering an
interval of 1 to 5, with 57% of students with a
performance equal to or greater than the desired
average (equal to or greater than 3.5).
It is worth to emphasize that, on the 2nd.
learning cycle, the teams had already structured the
problem and delimited with greater clarity the scope
of the solution. However, the results of this test
showed that there was a difficulty in the teams to
plan their projects, to define tasks and schedules
compatible with their resources. This was happened
because the students didn’t define a consistent
resolution process, which is a responsibility assumed
by teacher in the traditional approach. For this, the
content related to project management was
reinforced.
The second test, held at the end of the 3rd.
Cycle, had the objective of verifying the
participation and contribution of each member in
his/her team. The questions were also asked
according to the resolution process, but the answers
should be instantiated within the reality of each
project. This test had a very interesting result, as it
proved the students' maturity in conducting their
projects and the different but consistent point of
view that each one had on what his team was
solving. From this context, it was also identified that
the majority of students was active participant in
their projects, all of them were engaged in their
projects. The general average of the class reached
4.22, with 90% of the students with marks above the
desired average. Table 2 shows the overall average
of the teams from the perspective of Content in each
test, with better performance for the teams T1, T3
and T6.
Table 2: Evaluations in the Perspective of Content.
Criteria
T1
T2
T3
T4
1
o
. Exam
4
3.375
3.1
3.17
2
o
. Exam
4
4
4.75
3.8
General averages:
4
3.68
3.9
3.5
Criteria
T5
T6
T7
-
1
o
. Exam
1.92
3.56
2.94
-
2
o
. Exam
3.25
4.62
4.6
-
General averages:
2.58
4
3.77
-
In the perspective of Performance, two exams
were applied on the middle of second and third
learning cycles. Eight competences were assessed:
self-initiative, commitment, collaboration,
innovation, communication, learning, planning and
analysis, as shown in Table 3. Due to the
subjectivity of this analysis, this perspective used a
scale of five values, with the following meanings:
(1) "did not meet expectations"; (2) "partially met
them"; (3) "met them"; (4) "met them very well"; (5)
"exceeded expectations". This review was conducted
by the PBL/Technical tutor and applied in the self-
assessment format and evaluation in pairs (known as
the 180 degree evaluation), where each member of a
team was rated by his/her colleagues, anonymously.
Since this was undertaken by means of an online
research tool, sophisticated individual reports could
be obtained for each student, which showed the
results of the assessment of colleagues in his/her
team and his/her own assessment in a consolidated
and graphic way, for each assessment criterion,
including subjective comments. From their
individual report, the students can have a sense of
their performance in teamwork in the view of their
team members, highlighting their strengths and
points of improvement.
Applying and Managing PBL
63
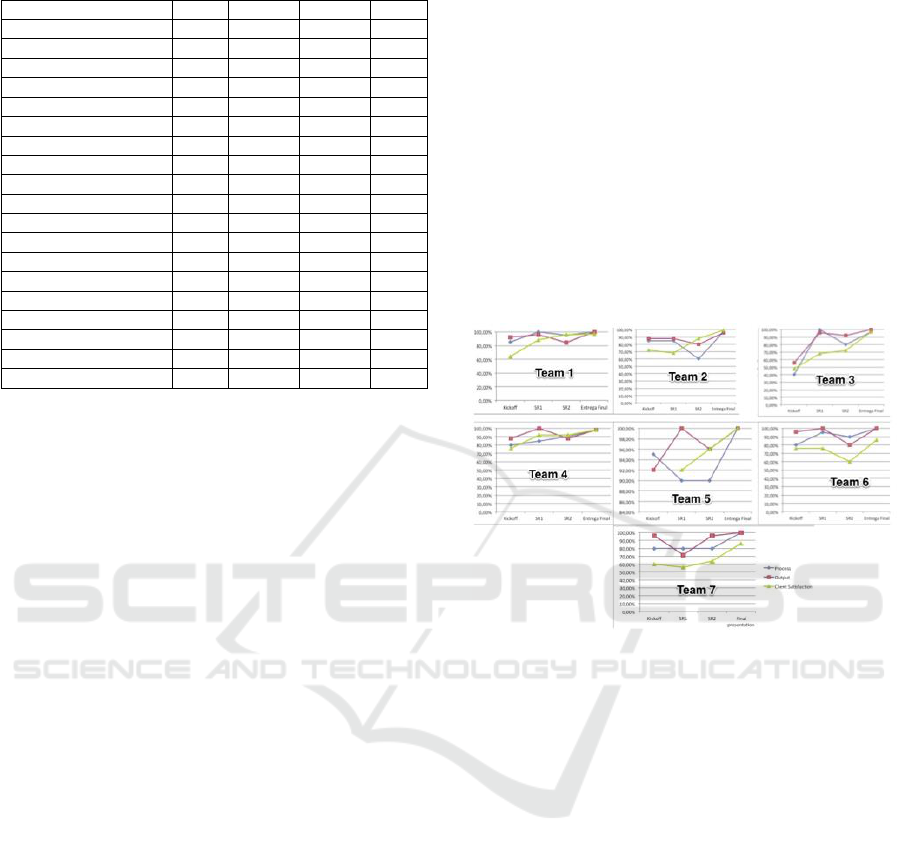
Table 3: Evaluations in the Perspective of Performance.
Criteria
T1
T2
T3
T4
SELF-INITIATIVE
3.58
3.59
3.94
2.84
COMMITMENT
3.62
3.89
3.89
2.93
COLLABORATION
3.58
3.81
4.11
3.18
INNOVATION
3.32
3.27
3.78
2.84
COMMUNICATION
3.40
3.76
3.83
3.07
LEARNING
3.68
3.72
3.83
3.00
PLANNING
3.42
3.56
3.39
2.63
ANALYSIS
3.52
3.60
3.89
2.99
General averages:
3.52
3.65
3.83
2.94
Criteria
T5
T6
T7
SELF-INITIATIVE
3.72
3.75
3.76
COMMITMENT
3.84
3.88
3.50
COLLABORATION
3.84
4.06
3,54
INNOVATION
4.06
4.06
3.38
COMMUNICATION
3.39
3.72
3.44
LEARNING
3.89
4.06
3.48
PLANNING
3.83
3.81
3.32
ANALYSIS
3.78
4.13
3.52
General averages:
3.79
3.93
3.49
On analysing Table 3, it can be seen that teams
T3 and T6 stand out with respect to the performance
of their members, in the eight perspectives mapped.
On comparing with the perspectives of Content, we
see that there is a direct relationship between the
best results of Performance especially in criteria
Learning, Planning and Analysis, considered on the
content exams.
The evaluations focused on group performance
(Process, Output and Client Satisfaction) were
applied in all learning cycles, conducted in the
Status Report meetings, with the presence of the
teacher (as a specialist in MIS), Technical tutors (as
specialist in project management), PBL tutors and
real clients.
In the perspective of “Process”, the teams were
evaluated by a technical tutor, who monitored the
projects during four meetings: one Kick-off, two
Status Report (SR) meetings and the final
presentation. At the SR meetings, each team always
answered five questions: "What is the objective of
your project?"; "What's the plan?"; "What has been
done?"; "What are the strengths?"; and "What are
the points of improvement?". As criteria for
evaluation in this perspective, the following were
defined: (1) Clarity in presentation; (2) mastery of
the presentation; (3) Completeness when considering
the five questions; (4) understanding of Planning.
Each indicator could take on one value from a
simple scale of five values: "1 - Insufficient; 2 -
Regular; 3 - Good; 4 - Very Good; 5 - Excellent".
As to the perspective of Output, this was focused
on analysis of the content of the presentations of the
projects in the monitoring meetings. These analyses
were conducted under the following criteria: (1)
Context of the project; (2) Problem description; (3)
Planned solution; (4) Value proposal; (5) Validation
of the proposal. Once again, the same simple scale
of five values was used. These evaluations were
conducted by teacher.
The evaluation of client satisfaction was based
on the following criteria: projection of confidence in
interviews; understanding of the problems; clarity of
presentation; quality of the solutions proposed; level
of planning. This assessment used the same value
scale as the perspectives of Process and Output, and
was conducted by the client of the respective
solution present in the Status Report meetings.
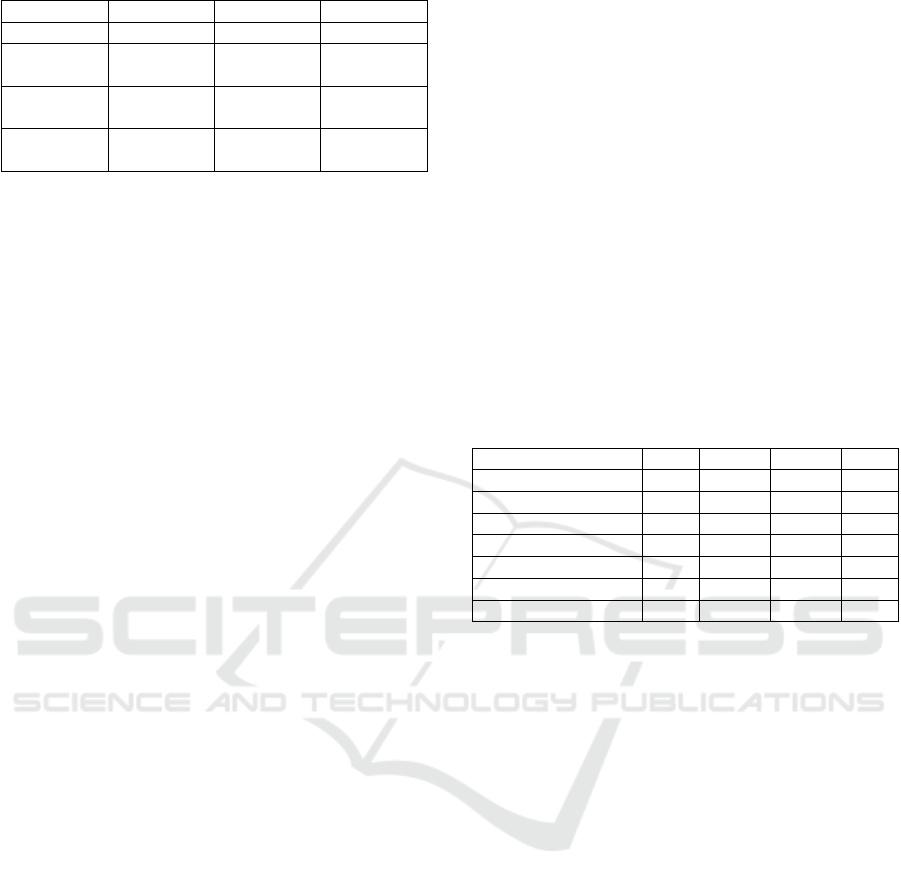
Figure 2 summarizes the results of the teams in these
three perspectives.
Figure 2: Evaluations in the Perspective of Process,
Output and Client satisfaction.
Below is a brief description of each project
developed by the teams:
Team 1 Project: Tool for corporate training.
Team 2 Project: Organization's maturity
diagnostic tool for deploying management systems.
Team 3 Project: Tool for mapping departments
and teams to create an interactive organization chart.
Time 4 Project: Knowledge management process
and workshops on how to do knowledge
management.
Team 5 Project: A game for corporate training.
Team 6 Project: Information system design to
combat waste and loss of food products due to
management and logistics issues related to products.
Team 7 Project: Software Development for
Demand Management (Acquisition of Software / IT
Services).
On analysing the graph in Figure 2, we see that
the performance of most of the teams improved
throughout the stages of the life cycle of the project.
Turning to the performance of teams T2, T3 and T5,
we moreover see a significant improvement between
CSEDU 2018 - 10th International Conference on Computer Supported Education
64
the 1st monitoring (Kick-off) meeting and the final
delivery. We can also see the difficulty of the teams
concern to Process aspect, as verified in content
exams. Another interesting behaviour observed in
this chart was the natural "relaxation" of the teams
that obtain excellent performances, when we
compare the results of SR 1 and SR 2 for both
Process and Output aspect. It is common for teams
to concentrate on other priorities when they see that
the challenges were met in full at that moment, and
thus this has an impact on future activities and hence
their performances in the following reviews.
Finally, the results of the teams in Client
perspective show us a strong alignment between
teams and their respective client. It is worth
mentioning, that the involvement of the real
customer in the evaluation process is crucial to the
PBL approach, given that the stakeholder who will
benefit from the solution cannot be left aside. This
was one of the points that the teacher most worked
on after the kick-off of the project: namely, the need
to bring the customer to the center of the project,
keeping him/her continuously close to the processes
and validating each stage of the project with him.
This reinforcement led to greater performances
throughout the project in this perspective as shown
in Figure 2.
From the five perspectives of student evaluation
(individual and group), radar-type graphics were
generated, which summarized, in a visual way, the
performance of each team. Figure 3 shows the four-
team radars for illustration purposes. These graphics
were generated twice, for 2nd and 3trd cycles.
These graphs represent well the profile of each
team, highlighting their strengths and weaknesses.
Each respective graph can be used by the team to
identify points that need to be better managed within
the learning process, such as the process of problem
solving and validation of solutions; And by the
Figure 3: Student assessment by radar graphics.
student groups themselves, which, based on these
results, can seek improvements related to teamwork,
better distribution of internal tasks and individual
needs for further study, among other initiatives.
4.4 Acting
The PBL-Test applications were carried out in two
strategically defined milestones during the planning:
1) during the second cycle, after the kick-off of the
projects; 2) the third cycle, after the first status
report on the solutions. It was defined that, in these
milestones, the students would already be able to
present their perceptions before what they had
already experienced with the process. Tests were
applied by two PBL tutors (“guardian of the
method”), verifying if the execution of the PBL
process was in accordance with the PBL principles.
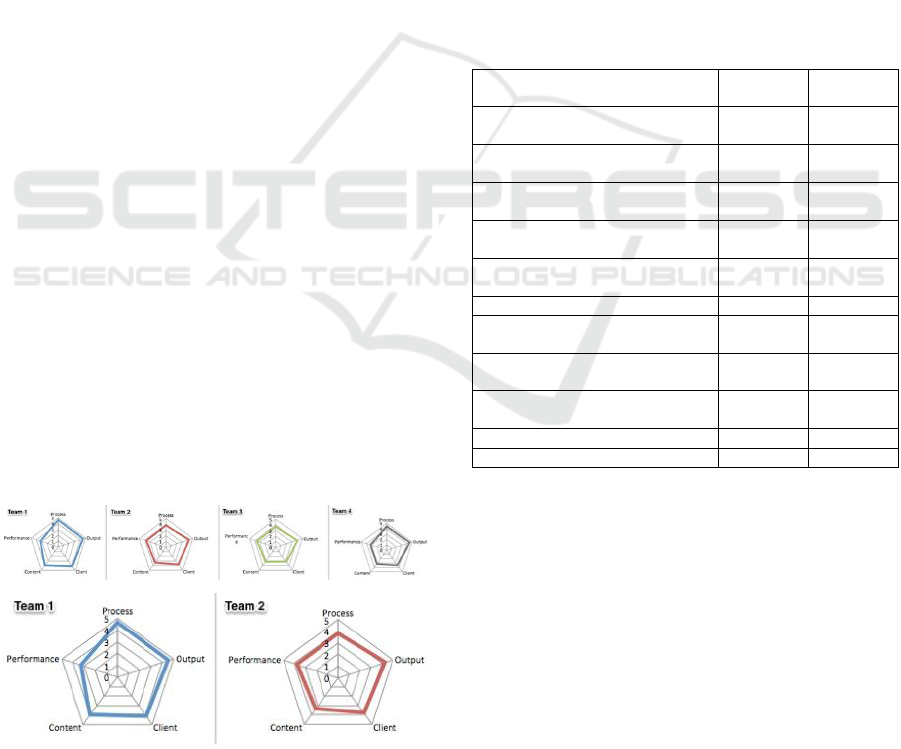
Table 4 summarizes these results.
Table 4: PBL-Test results.
Principles of PBL
1
st
Evaluation
2
nd
Evaluation
1. Problem(s) at the core of the
educational proposal.
0.82
0.88
2. Learner as the owner of the
problem.
0.82
0.85
3. Authenticity of the problem or
task.
0.94
1.00
4. Authenticity of the learning
environment.
0.58
0.56
5. Learner drives the problem-solving
process.
0.78
0.85
6. Complexity of the problem or task.
0.90
0.83
7. Assessment of how the problem
was solved.
0.80
0.75
8. Reflection on the content learned
and the learning process.
0.88
0.88
9.Collaborative and multidirectional
learning.
0.90
0.90
10. Continuous Assessment.
0.90
0.90
Overall average:
8.22
8.40
For both assessments, an average percentage of
84.8% of class responses was maintained. As the
purpose of the model, the PBL-Test considers that
methodological deviations can be identified.
In summary, the results show that the level of
maturity of the process was 2 (regular) for both
applications, with a mean of 8.22 and 8.40. This
score indicates that the teaching process evaluated is
significantly adherent to the PBL principles. Given
the results by principle, the PBL tutors, together
with the pedagogical team, defined strategies that
could improve the adherence of these principles to
the process. For this, the results were presented and
discussed with the tutors-mediated group in order to
Applying and Managing PBL
65

identify information that could substantiate the
result.
Principles 4 and 5 were those that presented a
lower score in the first application, compared to the
others.
The main strategies established considered the
promotion of reflection among the students so that
they could perceive that the defined learning
environment reflects real situations. The learning
environment could not be characterized as a
simulation, a situation assumed by the professor in
face of their professional experiences, because the
students deal directly with the clients that approved
the demands, besides experiencing aspects inherent
to the practice of project management (deadlines for
delivering artifacts, costs, solution quality, process
risks, among others). It is believed that the lack of
adequate infrastructure to promote a collaborative
learning environment is the factor that contributed to
the result of the second application of the test, being
less than the first one. This was due to the structure
of the classroom for expository class (chairs lined
up, professor's slate and digital projector), almost
always requiring improvisation for group work.
For Principle 5, as a strategy to encourage self-
directed learning, that is necessary to conduct the
resolution process, it was decided that all teams
would need to adopt a collaborative tool to manage
activities and thus facilitate the conduct of the
resolution process by the teams and monitoring by
the technical tutor. One can see that the implemented
strategies contributed to the adherence of the
principles since the result was increased in the
second application.
After the application of the second evaluation of
the PBL-Test, students' impressions regarding the
execution of the discipline were collected through a
form. They were able to comment anonymously on
what were the strengths and weaknesses. Listed
below are some of these comments:
Strengths:
● Exit the comfort zone and stimulate the
search for information.
● Feedback from clients and the teacher.
● Well-defined follow-up.
● Interaction with real clients.
● Consistency with the practical world
Weaknesses:
● Encourage more student participation with
bonuses.
● Greater focus on theoretical knowledge,
making it clearer how each theory interacts
with projects.
● Increased number of clients to choose from
students.
● Greater clarity in the definition of
evaluation criteria.
● It improves the way the PBL methodology
is presented.
5 CONCLUSIONS
While adopting the PBL approach has great potential
for practice of professional learning, to manage this
approach is not an easy task. With this challenge as a
motivation, this paper describes the application of
PBL in an Information Systems course, from a PBL
Framework described in (Santos and Rodrigues,
2016) that allows to plan, execute, monitoring and
improve the process of teaching and learning
throughout its application.
Considering the planning stage, the elements of
xPBL support the definition of a learning
environment conducive to the PBL approach,
considering its principles that highlight the need for
authentic (relevant and complexity compatible with
educational objectives) problems and a learning
environment that reflects the labour market, with its
resources such as specific human capital and follow-
up processes.
In the execution step, one of the key points
highlighted in the Framework is the need to define
learning cycles, within a process that allows problem
solving in a constructive and iterative way,
promoting research activities and reflection on
learning. These cycles should be aligned with
specific educational objectives to be evaluated at the
Check step.
The PBL-SEE model proposed for the Check
step is responsible for the link between the
objectives planned in the learning cycles,
continuously evaluating each evolution of the teams
from the perspective of the individual and the group,
under different aspects that complement each other.
This evaluation process, although it represents a
great effort of time for the pedagogical team, has
presented quite positive results. When assessing the
student from different perspectives, his performance
is shown in a transparent and fairer way.
Finally, the evaluation of the PBL approach
throughout the course, using the PBL-Test model,
has pointed out the main deviations of the approach,
allowing improvements, either by reinforcing
principles through practices, by promoting
discussions with teams or by providing content
recommendation.
CSEDU 2018 - 10th International Conference on Computer Supported Education
66

As points of improvement for the Framework,
we highlight the need to use information technology
to support their models, as well as a more procedural
view of their implementation. These initiatives are
being developed by the authors of this work, from
the proposal of a PBL planning tool based on canvas
and instructional cards (Alexandre and Santos,
2018); a Learning Management System (LMS) to
conduct the evaluations of the PBL-Test model
(Oliveira and Santos, 2016) and; a website as a
guide to support the application of the Framework,
allowing the access to its artifacts and systems.
REFERENCES
Acm/Ieee (2015) Software Engineering 2014 - Curriculum
Guidelines for Undergraduate Degree Programs in
Software Engineering. ACM, New York, NY, USA,
URL https://www.acm.org/education/SE2014-
20150223_draft.pdf,https://www.acm.org/education/c
urricula-recommendations
Alexandre, G. H. S., Santos, S. C. “PBL Planner Toolkit:
A Canvas-Based Tool for Planning PBL in Software
Engineering Education” CSEDU, Funchal, 2018.
Delisle, R. How to use problem-based learning in the
classroom, 1997.
Draft, Strawman. Computer Science Curricula 2013. 2013.
Hung, W. The 3C3R Model: A Conceptual Framework for
Designing Problems in PBL. Interdisciplinary Journal
of Problem-Based Learning, 2006.
Hung, W. The 9-step problem design process for problem-
based learning: Application of the 3C3R model.
Educational Research Review 4, 2009.
Laudon, K. C.; LAUDON, J. P. "Sistemas de informação
gerenciais: administrando a empresa digital."
Tradução Arlete Simille Marques. 2004.
Martin, K. and CHINN, D. “Collaborative, Problem-Based
Learning in Computer Science” . 2005.
Monte, A. C.; Rodrigues, A.; Santos, S. C. A PBL
Approach to Process Management Applied to
Software Engineering Education. In: Frontiers in
Education, 2013, Oklahoma. IEEE Education Society..
Myers, I. B. "Gifts Differing: Understanding Personality
Type”. Mountain View, CA: Davies-Black Publishing,
1980.
Oliveira, A. M. C. A., Sanstos, S. C. dos, and Garcia, V.
C. “PBL in Teaching Computing: An overview of the
Last 15 Years”In: Frontiers in Education 2013,
Oklahoma. IEEE Education Society.
Oliveira, F. S. and Santos, S. C. "PBLMaestro: A Virtual
Learning Environment for the Implementation of
Problem Based Learning Approach in Computer
Education”, FIE, Erie, Pennsylvania, 2016.
Panwong, P. & Kenemavuthanon, K., “Problem-Based
Learning Framework for Junior Software Developer:
Empirical Study for Computer Programming
Students”. Springer, Wireless Pers Commun (2014)
76: 603.
Peng, W. “Practice and Experience in the Application of
Problem-based Learning in Computer Programming
Course”. International Conference on Educational and
Information Technology. 2010.
Santos S. C., Figuerêdo, C. O., Wanderley, F. (2013),
“PBL-Test: a Model to Evaluate the Maturity of
Teaching Processes in a PBL Approach”, FIE,
Oklahoma, EUA.
Santos S. C., Furtado F., Lins W. “xPBL: a Methodology
for Managing PBL when Teaching Computing”, FIE,
Madrid, Spain, 2014.
Santos, S. C. “PBL-SEE: An Authentic Assessment Model
for PBL-Based Software Engineering Education”.
Transaction on Education. IEEE, 2016.
Santos, S. C. and Rodrigues, A. “A Framework to Apply
PBL in Computing Education”, FIE, Erie,
Pennsylvania, 2016.
Santos, S. C.; Alexandre, G. H. S. ; Rodrigues, A. .
Applying PBL in Project Management Education: a
Case Study of an Undergraduate Course. In: The 45th
Annual Frontiers in Education (FIE), 2015, El Paso -
Texas. Frontiers in Education: Launching a New
Vision in Engineering Education, 2015.
Savery, J. R. “Overview of Problem-based Learning:
Definitions and Distinctions”. Interdisciplinary Journal
of Problem-based Learning: Vol. 1: Iss. 1, 2006,
Article 3.
Tuohi, R. “Assessment in Problem Based Learning
connected with IT Engineering Education,” presented
at the International Conference on Engineering
Education & Research, Melbourne, Australia, Dec. 2-
7, 2007.
Vaishnavi, V.; Kuechler, W. Design research in
information systems. 2004.Britain, S. and Liber, O.
1999. A Framework for Pedagogical Evaluation of
Virtual Learning Environments.
Zaharias, P., Belk, M. and Samaras, G.” Employing
Virtual Worlds for HCI Education: A Problem-based
Learning Approach”, 2012. Proceeding CHI EA’12.
Extended Abstracts on Human Factors in Computing
Systems. Pages 317-326.
Applying and Managing PBL
67
