
An Action Research Study towards the Use of Cloud Computing
Scenarios in Undergraduate Computer Science Courses
Heleno Cardoso da Silva Filho and Glauco de Figueiredo Carneiro
Universidade Salvador (UNIFACS), Salvador-BA, Brazil
Keywords:
Cloud Computing, Active Learning, Action Research.
Abstract:
Cloud computing has been a successful paradigm in its goal to provide remote computing resources in a com-
petitive and scalable way when compared to traditional computing scenarios. Companies have a growing
interest in migrating and using cloud services. However, the literature has reported difficulties and challen-
ges faced by companies while migrating their assets to the cloud. One of the possible reasons for this is the
difficulty in the identification of qualified professionals to support companies to plan, perform and monitor
the migration of their legacy systems to the cloud. This paper presents an action-research study analyzing
the inclusion of cloud computing scenarios in the System Analysis and Design and Operating Systems under-
graduate courses at Salvador University (UNIFACS). The results of the action-research study provided initial
evidence that cloud computing resources integrated to the contents of the aforementioned courses can contri-
bute to motivate and engage students in activities. In addition, the knowledge and experience gained by these
students can improve their qualification to facilitate access to the labor market.
1 INTRODUCTION
Cloud computing paradigm has the goal to provide
services and scalable resources at an accessible cost
with acceptable levels of elasticity and reliability
(Armbrust et al., 2010; Zhang et al., 2010). It is an
evolutionary step towards the effective use of com-
putational resources (Oliveira et al., 2014). Moreo-
ver, it can be a solution for companies to deal with
issues such as cost reduction as well as the possibi-
lity to change the configuration and the allocation of
computational resources, including software and har-
dware, on demand (Armbrust et al., 2010; Oliveira
et al., 2014).
Researchers have identified key advantages and
challenges faced by practitioners. In terms of advan-
tages, we highlight elasticity (Armbrust et al., 2010),
scalability (Marston et al., 2011), storage capacity
(Bond, 2015), cost reduction (Marston et al., 2011),
and mobility (Fernando et al., 2013). In terms of po-
tential challenges that are bound to concerns faced du-
ring Cloud Computing adoption, we mention the fol-
lowing (de Paula et al., 2017; Sultan, 2010): security
1
, reliability (Sultan, 2010), privacy and confidentia-
lity (Ryan, 2011), portability (Jones et al., 2017), and
1
www.cloudsecurityalliance.org
interoperability (Petcu and Vasilakos, 2014).
There is a tendency towards the use of cloud com-
puting in several areas and this is not an exception
for education (Lin et al., 2014; Smith et al., 2014).
The demand for professionals to configure and ma-
nage cloud computing resources is an opportunity for
new practitioners in cloud computing related activi-
ties. Despite this opportunity, there is still an open
question on how undergraduate students can be pre-
pared to deal with the cloud computing paradigm.
Studies have reported the need to engage Computer
Science undergraduate students in hands-on activities
(Hanna et al., 2015; Vaquero, 2011). The lack of mo-
tivation affects the learning process and therefore can
interfere in the execution of activities. For this rea-
son, it is advisable to include in the courses activities
that resemble real situations related to cloud issues in
an attempt to engage students (Lin et al., 2014). For
example, activities dealing with the identification of
which cloud provider to choose, as well as a feasi-
bility analysis related to the migration of the assets
and potential services of an organization to the cloud
can be interesting scenarios to grasp students atten-
tion. The challenges faced by newcomers while exe-
cuting cloud activities may include the identification
of which cloud provider to hire and the respective re-
sources to allocate to a new service (Oliveira et al.,
Filho, H. and Carneiro, G.
An Action Research Study towards the Use of Cloud Computing Scenarios in Undergraduate Computer Science Courses.
DOI: 10.5220/0006644800150025
In Proceedings of the 13th International Conference on Evaluation of Novel Approaches to Software Engineering (ENASE 2018), pages 15-25
ISBN: 978-989-758-300-1
Copyright
c
2019 by SCITEPRESS – Science and Technology Publications, Lda. All rights reserved
15

2014; Sadiku et al., 2014).
Empirical instruments are an effective option to
analyze the effectiveness of the aforementioned acti-
vities. In fact, studies have reported the use of these
instruments in Computer Science undergraduate cour-
ses where students can experience real-life problems
that can motivate them towards positive learning out-
comes (Smith et al., 2014; Vaquero, 2011; Sultan,
2010).
Considering the scenario described above, we de-
fined the following Research Question (RQ): ”Ana-
lyze the use of cloud computing scenarios for the pur-
pose of understanding its effectiveness with respect to
the adoption of these scenarios in ”Software Analysis
and Design” and ”Operating Systems” courses from
the viewpoint of students in the context of Compu-
ter Science undergraduate courses at Salvador Uni-
versity (UNIFACS)”. We intend to draw conclusions
from the results of this study on how to engage stu-
dents to be prepared and aware of the challenges and
opportunities of cloud computing in the market.
The rest of this paper is organized as follows. Next
section presents the context of this work. Section
3 describes the action research study and in Section
4 we analyze the data collected during the study.
Section 5 presents the conclusion, threats to validity
and scope for future research.
2 CONTEXT OF THIS WORK
Many researchers have argued that the traditional
classroom setting has key shortcomings and alterna-
tives such as the flipped classroom have been used
with interesting results (Bishop and Verleger, 2013;
Williams et al., 2017).
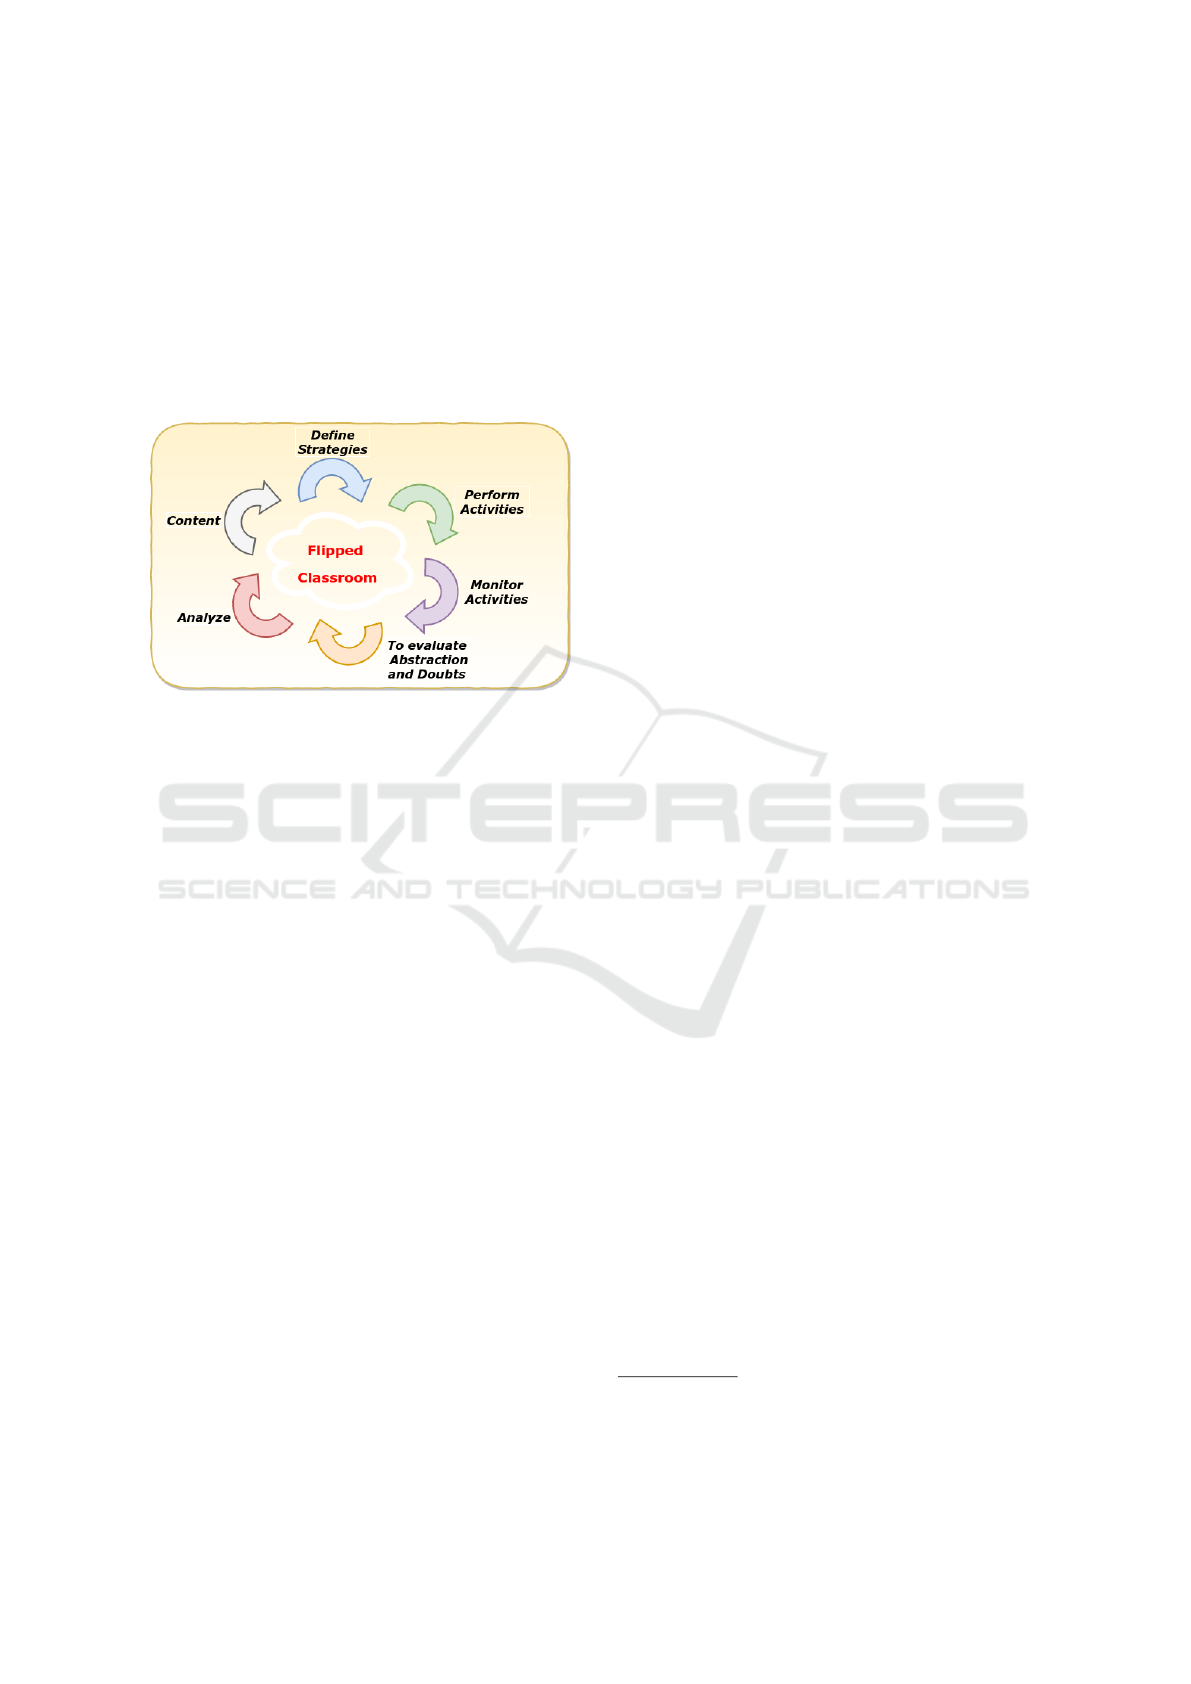
The core idea of the flipped classroom approach
is to flip the lecture-based classroom instruction and
utilize interactive activities and reading assignments
in advance of class (Tucker, 2012). Class time is then
used to engage learners in problem-based, collabora-
tive learning and advancing concepts. After class, stu-
dents can check understanding and extend learning to
more complex tasks. Most importantly, the learner
has control of the pace and time it takes to learn the
material (Green et al., 2017). The Figure 1, adapted
from the Faculty Innovation Center
2
, illustrates this
scenario.
Flipping a class can be a worthwhile approach, es-
pecially in courses where the material or processes are
traditionally difficult for students to grasp (Williams
et al., 2017). And this can be the case of Computer
2
https://facultyinnovate.utexas.edu/flipped-classroom
Figure 1: Flipped Classroom (Faculty Innovation Center -
Univ. of Texas).
Science Undergraduate courses. Moreover, student-
centered, technology-based, and active learning ap-
proaches such as flipped classroom relies on students
wanting to take control of their learning. This appro-
ach enables students to set their own goals, monitor
their own progress, facilitating their own and others
critical thinking and problem solving skills (Newman
et al., 2015).
Today with the advent of DevOps and Cloud Com-
puting, solid knowledge in operating systems is re-
quired (Bond, 2015). This reinforces the need for an
active learning approach in these courses. On the ot-
her hand, the quality of the software product depends
directly on the quality of the artifacts produced du-
ring the software development life cycle. For this rea-
son, the course of System Analysis and Design plays
an important role to consolidate the knowledge regar-
ding the construction of artifacts that describe the pro-
blem and register the solution proposed to this pro-
blem. Students usually have reported the challenge
to understand and register the problem accordingly in
artifacts such as use cases or user stories and to derive
this information in other artifacts throughout the soft-
ware life cycle such as class and sequence diagrams
(Bahill and Madni, 2017).
3 THE STUDY
In the action research term, action refers to impro-
ving practice and research refers to creating know-
ledge from the practice experience (McNiff, 2016).
When conducting an action research study, the rese-
archer is immersed in the target situation under in-
vestigation. The work unfolds in response to the si-
tuation and not only to the researchers requirements.
Descriptions and theories are built up as a result of
the iteration within the context in close collaboration
between researchers and participants (Holwell, 2004).
The action research steps are iterative and incremen-
tal (Hendricks, 2012). Figure 2 shows these steps in-
tegrated to the flipped classroom approach.
We used the Goal Question Metric (GQM) appro-
ach to plan the action research study. From the re-
search question (RQ) presented before, we defined
ENASE 2018 - 13th International Conference on Evaluation of Novel Approaches to Software Engineering
16
the goals of this study. The goal was then refined
into questions that break down the issue into its ma-
jor components. Each question was in the sequence
refined into metrics. The same metric can be used to
answer different questions under the same goal. In
Figure 3 we show diagrammatically the relationship
among goals, questions and metrics of this study. The
action research was conducted during the first semes-
ter of the academic year of 2017.
Figure 2: Action Research Iterative Steps. Adapted from
(McNiff, 2016).
3.1 Action-Research Planning Phase
The planning phase has two key moments as descri-
bed below. In the first moment, the course syllabus is
the input for the identification of the course characte-
ristics. In the sequence, the set of key cloud resources
are indicated as requirements to decide which cloud
computing scenarios should be included in the acti-
vities. In the second moment, we plan the activities
based on the topics/components of the syllabus and
contextualized in the selected scenario. We then con-
figure the environment for the execution of the activi-
ties in the context of the selected scenarios. An im-
portant issue in this phase is the diagnosis of the cha-
racteristics of each course, especially the components
of the syllabus to promote an effective alignment of
the proposed activities with the course goals. It is im-
portant to mention that, following the characteristics
of an action-research study, the activities created to
each course can be adjusted based on feedback pro-
vided by the students, researcher or teacher. In these
cases, we should return to the Phase 2 of the planning
to promote the activities adjustments.
Figure 4 shows the spiral meta-model of the the
action-research approach we envisioned to be instan-
tiated in each course. This meta-model is compo-
sed of the following phases: planning (green rectang-
les), execution (yellow rectangle), monitoring, ana-
lysis and feedback phases (blue, gray and white rec-
tangles). When conducting the action research study,
we repeatedly passe through these phases in iterations
(called Spirals). This was needed particularly for the
execution of all topics of the course syllabus until the
end.
3.2 The Targeted Courses
We decided to conduct the action research study fo-
cusing on two courses: Operating Systems (OS) and
System Analysis and Design (SAD) for the following
two reasons. The first is the potential to explore the
use of cloud resources (Mokhtar et al., 2013) in both
courses. The second is the opportunity to illustrate
how to perform real activities in the context of to-
pics from the syllabus of the two courses. An ope-
rating system is a program that manages a compu-
ters hardware. It also provides a basis for applica-
tion programs and acts as an intermediary between
the computer user and the computer hardware (Sil-
berschatz et al., 2014). The Ubuntu Linux distribu-
tion was adopted as the operating system to perform
the planned activities. This distribution is available in
several cloud providers such as Google Cloud
3
and
Amazon AWS
4
. Moreover, this distribution is well-
known and popular in the open source community
5
.
The topics related to process management, memory
management, input/output system, and file manage-
ment are related to operating systems concepts and
also enable the use of virtual machines and containers
in the cloud.
System Analysis and Design (SAD) deals with
planning the development of software systems based
on the understanding and specification in detail of
what a system should do and how the components of
the system should be implemented and work together.
The discipline also focuses on identifying characteris-
tics of the software architecture and its components
and addresses the concepts of deploy and orchestra-
tion of applications in the IaaS layer (infrastructure
as a service). Both courses deal with contents that
for some extent can require the use of cloud compu-
ting capabilities. Therefore, the two courses can be
integrated with activities related to cloud computing
activities, such as those required for the migration of
legacy systems to the cloud.
3.3 Selecting Projects from Github
We used the following criteria to select software pro-
jects from Github: Stars, Forks, Contributors, Recent
3
https://cloud.google.com/compute/docs/images
4
https://aws.amazon.com/marketplace/pp/B01JBL2I8U
5
https://distrowatch.com/dwres.php?resource=popularity
An Action Research Study towards the Use of Cloud Computing Scenarios in Undergraduate Computer Science Courses
17
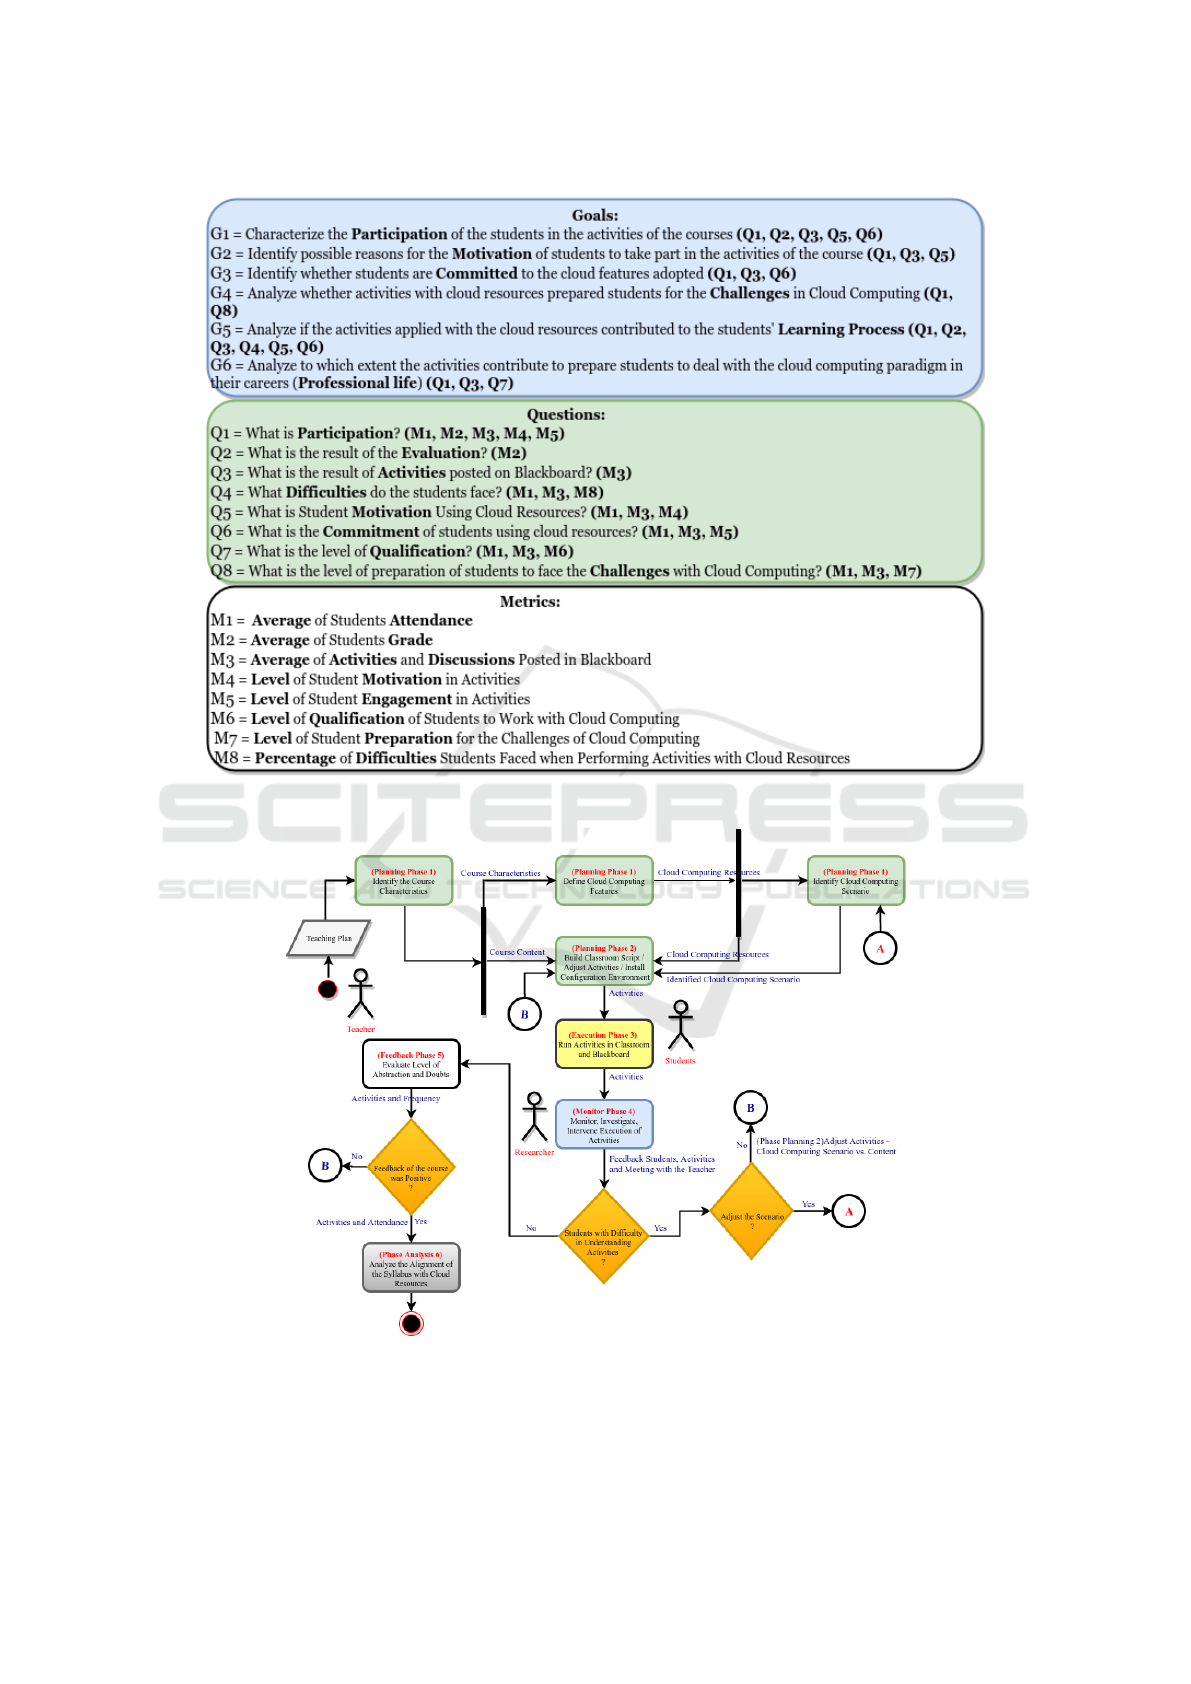
Figure 3: Action Research Goals, Questions and Metrics.
Figure 4: Action Research Meta-model.
Updates, and Open Source Version. These criteria are
the same as adopted by (Borges et al., 2016). These
projects are used as scenarios for the activities in each
course. The selection also considered that they have
ENASE 2018 - 13th International Conference on Evaluation of Novel Approaches to Software Engineering
18
an installation script and can be accessed/installed in
Ubuntu. Table 1 lists the selected projects (Web appli-
cations) based on the highest scores in each domain.
3.4 Cloud Scenarios and Activities
We used the virtualization and containers features in
the cloud computing scenarios. The virtualization ai-
med at simulating a remote server that provided cloud
services according to the Infrastructure as a Service
(IaaS) model.
Table 1: Projects Selected from Github.
Domain
Stars Forks Contributors Updates Version
Health- Ope-
nEmr
352 490 85 Yes GNU GPL
Conference
Talk- OpenCFP
313 130 50 Sim MIT
Wine- Nodecel-
lar
14 44 26 Yes APACHE
2.0
Taxi- App 2 8 5 No No
Network Moni-
toring - Zabbix
141 66 1 Yes GPL-2.0
Scenario 1 - Nodecellar Wine Store (virtual ma-
chine and container versions): For the execution of
this cloud computing scenario, we used the Cloudify
Gigaspaces platform to simulate an application run-
ning in the cloud through virtualization (Virtual Box
6
), according to an Infrastucture as a Service (IaaS)
model. The Nodecellar
7
is based on Node.js, a Ja-
vaScript runtime, to manage (retrieve, create, update,
delete) the wines in a wine cellar database
8
. This ap-
plication has been used by the open source commu-
nity to demonstrate the steps required to migrate, de-
ploy and orchestrate a legacy application to the cloud.
Scenario 2: OpenEMR (virtual machine and con-
tainer versions). OpenEMR
9
is an open source elec-
tronic health record and medical practice manage-
ment solution. It can run on Windows, Linux, Mac
OS X and several other platforms. Its source code has
PHP5+ as programming language, MySQL or Mari-
aDB as database, as well as Apache or other PHP re-
lated webserver.
Scenario 3: OpenCFP (virtual machine and con-
tainer versions). OpenCFP
10
is a PHP-based con-
ference talk submission system that enables the dis-
cussion of concepts related to the analysis (problem)
and project (solution) in a software system. It also
enables the discussion of process management, me-
mory management and input/output management in
the context of the operating system course.
6
https://www.virtualbox.org/
7
http://nodecellar.coenraets.org/
8
https://github.com/cloudify-cosmo/cloudify-
nodecellar-example
9
http://www.open-emr.org/
10
https://github.com/opencfp/opencfp
Scenario 4: Zabbix (virtual machine and contai-
ner versions). It is an open source enterprise-level
software designed for real-time monitoring of metrics
collected from remote servers, virtual machines and
network devices. This scenario was analyzed in the
Amazon Web Services Cloud Service (AWS) through
the use of containers (Docker) and Virtual Machines
(VM).
Scenario 5: Mobile Taxi Application (virtual ma-
chine and container versions). For use of this cloud
computing scenario, the artifacts of the mobile taxi-
app application are available in the GitHub
11
to dis-
cuss the concepts of reverse engineering and UML di-
agrams.
Scenario 6: Portal Amazon. It is a worldwide on-
line shopping of books, magazines, music, DVDs, vi-
deos and many other items.
As showed in Figure 2, the activities to be per-
formed by the students were posted and available in
the Blackboard portal of the university. It is a virtual
learning environment adopted at Salvador University
(UNIFACS) for both face-to-face and distance lear-
ning courses. The activities can be reached at the url
indicated in this footnote
12
.
3.5 Data Sources for the Analysis
We considered data provided by the following sour-
ces in this study: (a) Activities registered in Black-
board; (b) Questionnaire on Student profile; (c) Que-
stionnaire for feedback about the adherence of cloud
computing scenarios; (d) Midterm and Final Assign-
ment; (e) Student Attendance; (f) Feedback from stu-
dents during classes and activities; (g) Research and
teacher perceptions.
The questionnaires used the Likert scale of 5. No
identification was required to answer the questionnai-
res. Prior to the questionnaires application, we high-
lighted the importance of the answers to the study and
the benefits that the results and findings from these
study would bring to better prepare students to the
cloud computing market. A total of 13 students in
the discipline of Operating systems and 11 students
in the discipline of System Analysis and Design com-
pleted the questionnaires. The questionnaire for the
System Analysis and Design (SAD) students had 35
questions (33 closed and 2 open). The questionnaire
for the Operating Systems students had 34 issues (32
closed and 2 open). The closed questions aimed at
obtaining the degree of knowledge in the Computer
Science field. The open questions aimed at obtaining
11
https://github.com/mistryrn/taxi-app
12
https://cloudeduc.github.io/cloudeduc/
An Action Research Study towards the Use of Cloud Computing Scenarios in Undergraduate Computer Science Courses
19
Table 2: Goals, Questions and Metrics for SAD Discipline.
Research issues
Q1
Partici-
pation
Q2
Evalu-
ation
Q3
Activities
Q4
Diffi-
culties
Q5
Motivated
Q6
Commi-
tted
Q7
Qualifi-
cation
Q8
Chall-
enges
Results
G1
Partici-
pation
(64.32%)
(64.80%)
(47%)
Low Pro-
ductivity
–
Motivated
(61.73%)
Compro-
mised
(61.73%)
– — (59.92%)
G2
Partici-
pation
(64.32%)
–
(47%)
Low Pro-
ductivity
–
Motivated
(61.73%)
– – – (57.68%)
G3
Partici-
pation
(64.32%)
–
(47%)
Low Pro-
ductivity
– –
Compro-
mised
(61.73%)
– – (57.68%)
G4
Partici-
pation
(64.32%)
– – – – – –
Little
Prepared
(56.61)
(60.47%)
G5
Partici-
pation
(64.32%)
(64.80%)
(47%)
Low Pro-
ductivity
Diffi-
culties
(55.54%)
Motivated
(61.73%)
Compro-
mised
(61.73%)
– – (59.19%)
G6
Partici-
pation
(64.32%)
–
(47%)
Low Pro-
ductivity
– – –
Very little
Qualified
(40.73)
– (50.68%)
the perceptions of the students regarding the engage-
ment and what was learned while performing cloud
computing related activities.
3.6 Profile of the Students
Both classes have 16 students enrolled in the first se-
mester of 2017. We used questionnaires in May of
2017 to obtain data related to the profile of the stu-
dents that took part in the action research study. The
questionnaire was composed of 15 closed questions.
The questions focused on issues related to academic
background and knowledge related to cloud compu-
ting. The questionnaire can be reached at the same
url indicated in the previous footnote.
3.7 The Role of the Authors of the Study
Among the two authors of the study, the second one
took the role as the instructor of the two disciplines.
He developed lesson plans, conducted face-to-face
and online learning activities and participated in all of
the action research process. The first author was one
of the members of the Monitoring and Support Team
(MST). The purpose of MST was to guide the instruc-
tor, conduct macro level analysis with the researcher,
assess the process, increase the validity and reliabi-
lity of data collection and analysis procedures, deve-
lop functional actions based on findings of the macro
level analysis, and to help make the research process
as much objective as possible. The MST consisted of
2 experts (the authors) from curriculum, instruction
and educational technologies.
4 ANALYZING THE DATA
In this section, we present the analysis of data obtai-
ned during the action research study to answer the
Research Question (RQ): ”Analyze the use of cloud
computing scenarios for the purpose of understan-
ding its effectiveness with respect to the adoption of
these scenarios in ”Software Analysis and Design”
and ”Operating Systems” courses from the view-
point of students in the context of Computer Science
undergraduate courses at Salvador University (UNI-
FACS)”. With this analysis we intend to draw conclu-
sions on how to engage students to face the challenges
and opportunities of cloud computing in the market.
In Figure 5, we show diagrammatically the relations-
hip among goals, questions and metrics. Based on this
relationship, we explain first how the metrics were
calculated, then we show how they were combined to
answer the questions. Finally, we explain the goals.
Within one-semester learning process of the proposed
inclusion of cloud computing scenarios in the two dis-
ciplines, the way students reacted and performed the
activities was monitored, as well as the ways students
interacted with their peers and with the researchers.
Moreover, the ways of interaction emerged during the
activity process were carefully analyzed via content
analysis.
4.1 Analyzing Data for the SAD
Discipline
In the following paragraphs, we analyze data for the
System Analysis and Design (SAD) Discipline. We
also explain how the values were calculated. In Table
3, we present the values for metrics M1-M8.
Answering the Questions for the SAD Discipline.
In the following, we present the calculations for the
ENASE 2018 - 13th International Conference on Evaluation of Novel Approaches to Software Engineering
20
eight questions aiming at providing conditions to cha-
racterize the goals stated in this study.
4.1.1 Question Q1 - Participation of the
Students in SAD
According to Figures 3 and 5, the metrics M1-M5
were designated to answer Question Q1. In Table
4, we present the results of metrics M1, M2 and M3
to answer Q1. In Table 5, we present the results of
metrics M4 and M5 collected from questions 3.1 to
3.10 of the questionnaire of discipline System Analy-
sis and Design.
Table 3: Collected Metrics for the SAD Discipline.
Metric
Description
Value
(Average)
M1 Average of students attendance (Frequency) 89.66%
M2 Assignments Average Value 64.80%
M3 Average of activities/discussions posted on Blackboard 47.00%
M4 Students ’ motivational level in activities 61.73%
M5 Level of commitment to students in activities 61.73%
M6 Qualification level of students to deal with cloud compu-
ting activities
40.73%
M7 Student preparedness level for cloud computing challenges 56.61%
M8 Percentage of difficulties students had in the activities with
cloud resources
55.54%
The value obtained for Q1 of 64.32% classified
students from the System and Analysis Design (SAD)
as Participatives. This is consistent with the feedback
students provided describing their motivation to per-
form the activities contextualized in cloud computing
scenarios.
Table 4: M1, M2 and M3 in SAD Discipline.
Metrics Description
Average
M1 Average of students attendance (Frequency) (Total 1088h
/ 112.50h Faltas)
89.66%
M2 Average Rating 64.80%
M3 Average of activities/discussions posted on Blackboard 47.00%
Table 5: M4 and M5 in SAD Discipline - Question 3.1 a
3.10.
Question
Not
Approa-
ched
Insufficient
Little
Enough
Enough
Mote
than
Enough
3.1 0% 0% 9.09% 90.91% 0%
3.2 0% 0% 9.09% 81.82% 9.09%
3.3 0% 9.09% 0% 90.91% 0%
3.4 0% 9.09% 18.18% 72.73% 0%
3.5 0% 9.09% 45.45% 36.36% 9.09%
3.6 0% 9.09% 72.73% 18.18% 0%
3.7 0% 0% 63.64% 27.27% 9.09%
3.8 0% 45.45% 18.18% 27.27% 9.09%
3.9 0% 45.45% 18.18% 36.36% 0%
3.10 0% 18.18% 45.45% 36.36% 0%
Average 0% 14.54% 30.00% 51.82% 3.64%
Table 6: Answering Q1 through M1-M5 for SAD Disci-
pline.
Metric Average (%) Weight
Result (%)
M1 89.66% 3 268.98%
M2 64.80% 2 129.60%
M3 47.00% 3 141.00%
M4 and 5M 51.82% 2 103.64%
Average 64.32%
4.1.2 Question Q2 - Results of the
Assignments/Evaluations - SAD
According to Figures 3 and 5, only the metric M2 was
designated to answer Question Q2. In Table 7, we
present the results of metric M2 to answer Q2 for the
first semester of 2017. We considered the medterm
and final exam to calculate M2 to answer Q2. The
value of 64.80 is considered regular, near 70 that was
the expected result.
4.1.3 Question Q3 - Activities Posted in
Blackboard - SAD
According to Figures 3 and 5, the metric M3 was de-
signated to answer Question Q3. In Table 8, we pre-
sent the results of metric M3 to answer Q3. As can be
seen in the table, a participation of 47% in the activi-
ties of the course was an evidence that it can be im-
proved. The reason for this occurrence was obtained
by feedback in which students declared that also used
email and instant message services in their mobile for
discussions.
4.1.4 Question Q4 - Difficulties Faced by
Students - SAD
According to Figures 3 and 5, the metrics M1, M3 and
M8 were designated to answer Question Q4. Consi-
dering that M1 and M3 for the SAD discipline were
already discussed and listed in Table 4, we present
in Table 9 the result for metric M8 as 36.36% rela-
ted to difficulties faced by students while performing
cloud computing activities in the discipline. Conside-
ring together metrics M1, M3 and M8, in Table 10 we
present the result for Question Q4 as 55.54%. This
highlight the challenges faced by students to perform
cloud related activities in the context of the SAD dis-
cipline. However, analyzing evidence from the stu-
dents feedback, we realized that despite the difficul-
ties, students strove to achieved the goals.
4.1.5 Question Q5 - Motivation to Perform
Cloud Activities - SAD
According to Figures 3 and 5, the metrics M1, M3
and M4 were designated to answer Question Q5. In
Table 11, we present the results of metrics M1, M3.
The metric M4 is presented in table 12. Considering
together metrics M1, M3 and M4, in Table 13 we pre-
sent the result for Question Q5 as 61.73%. This is
considered a regular level of motivation for this dis-
cipline with an increasing tendency as verified in the
feedback provided by the students.
An Action Research Study towards the Use of Cloud Computing Scenarios in Undergraduate Computer Science Courses
21
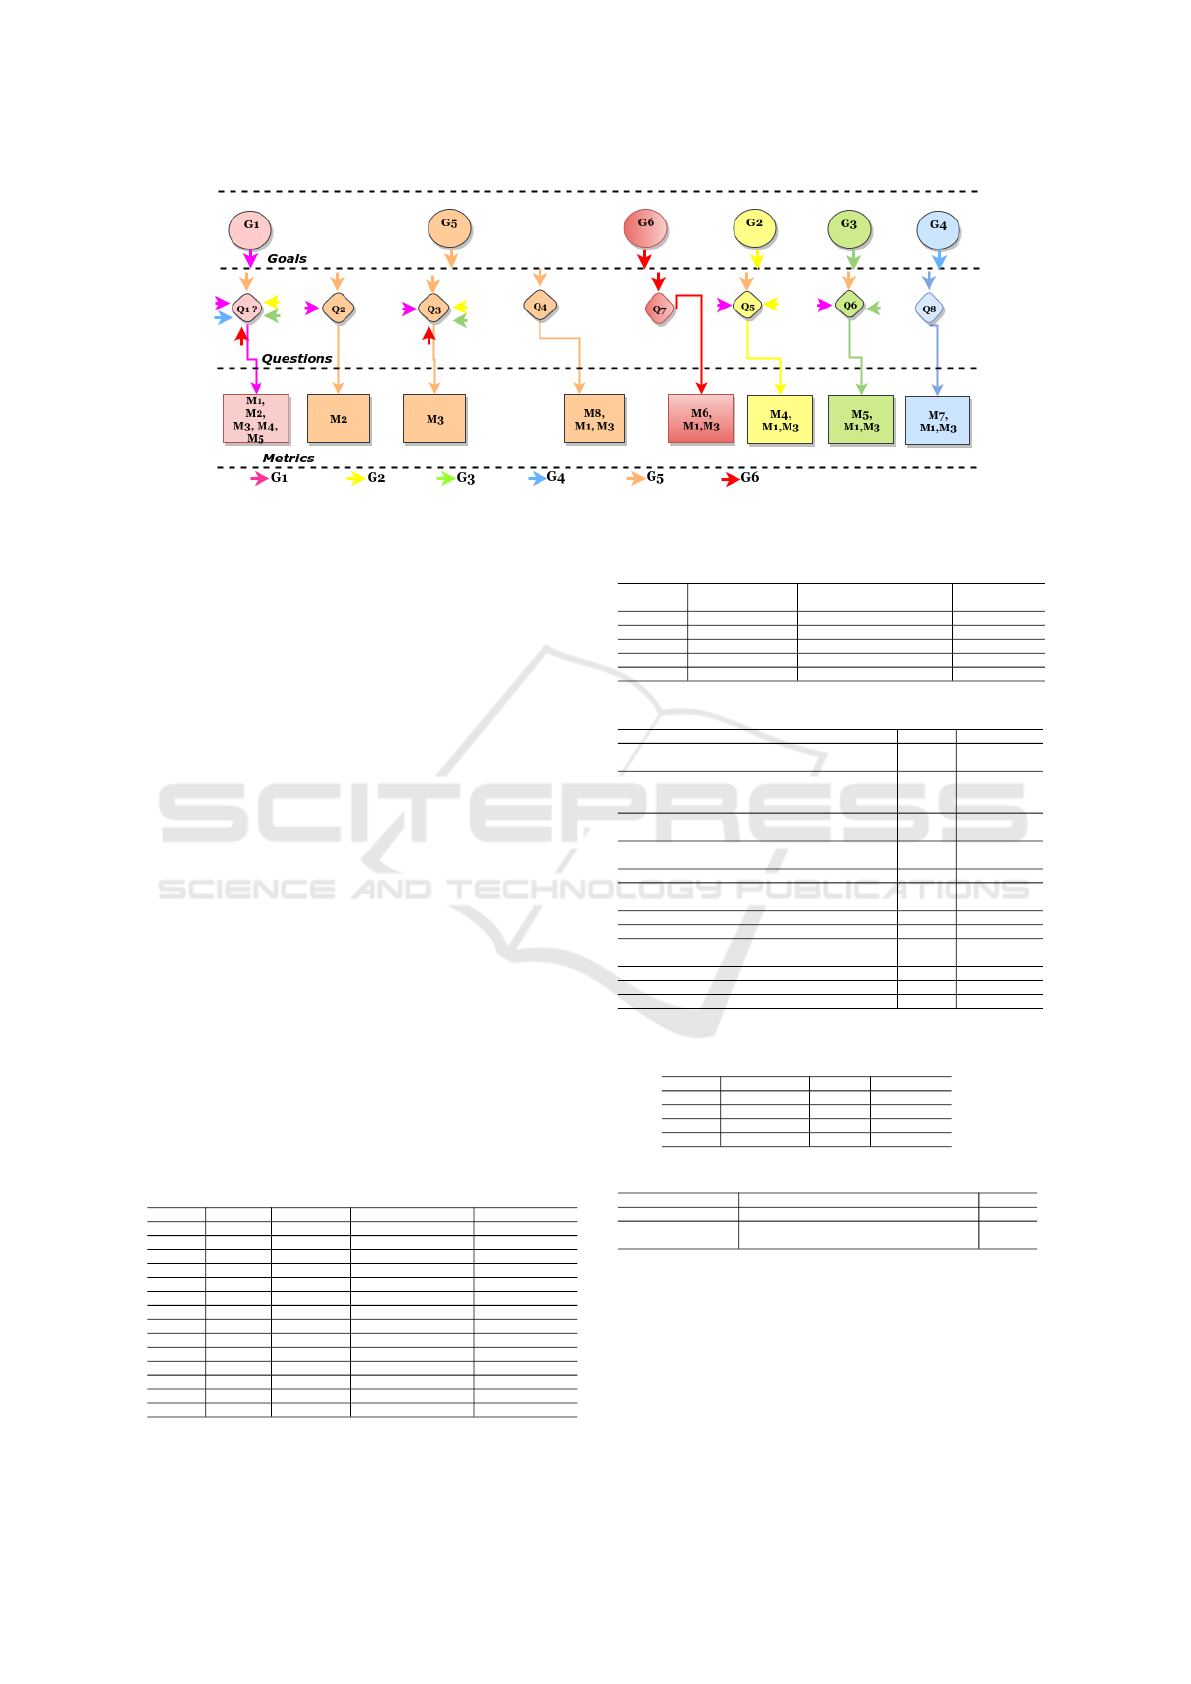
Figure 5: Relationship among Goals, Questions and Metrics.
4.1.6 Question Q6 - Commitment to Perform
Cloud Activities - SAD
According to Figures 3 and 5, the metrics M1, M3 and
M5 were designated to answer Question Q6. In Table
11, we present the results of metrics M1 and M3. In
Table 14, we present the results of metrics M5. Fi-
nally, in Table 15, we calculate the value for Q6 as
61.73%. This is an interesting evidence of commit-
ment, reporting that majority of students are engaged
in the cloud activities in the context of the discipline.
4.1.7 Question Q7 - Level of Qualification - SAD
According to Figures 3 and 5, the metrics M1, M3 and
M6 were designated to answer Question Q7. In Table
11, we present the results of metrics M1 and M3. In
Table 16, we present the results of the metric M6. Fi-
nally, in Table 17, we calculate the value for Q7 as
40.73%. This value indicates that students have the
perception that they need to improve their qualifica-
tion to deal with challenges and opportunities related
to cloud computing in the market. This is in fact an
evidence that students are aware of improvement op-
portunities they need to strive in order to be a qualified
professional.
Table 7: Answering Q2 through M2 for SAD Discipline.
k Average Frequency Frequency Relative Percentage (%)
1 4.0 1 0.06 6
2 4.5 1 0.06 6
3 5.5 1 0.06 6
4 5.8 1 0.06 6
5 6.0 2 0.13 12
6 6.1 1 0.06 6
7 6.2 1 0.06 6
8 6.4 1 0.06 6
9 6.5 1 0.06 6
10 6.8 1 0.06 6
11 7.5 2 0.13 12
12 8.0 1 0.06 6
13 8.4 2 0.13 12
Average 64.80
Table 8: Answering Q3 through M3 for SAD Discipline.
Data
Activities Scenarios
Participation
students(%)
13/03/2017 Activity 1 wiki.openmrs.org 100%
20/03/2017 Activity 2 wiki.openmrs.org 50%
21/03/2017 Activity 3 wiki.openmrs.org 25%
10/04/2017 Activity 4 Taxi App Android 13%
Average 47%
Table 9: Difficulties faced in Activities (M8 - SAD).
Elements Qty Percentage(%)
a) Understanding the proposed strategy for using
cloud-computing scenarios
4 36.36%
b) Master analysis techniques for Business ru-
les, specification functional requirements, rai-
sed/identified/Elicitados
3 27.27%
c) Master analysis Techniques for specification requi-
rements not Func., raised/identified/Elicitados
1 9.09%
d) Elaborate user story, usage cases, usage case dia-
gram, prototyping
2 18.18%
e) Elaborate class diagram 3 27.27%
f) Use virtualization Techniques (virtual machine,
Container, images)
5 45.45%
g) Understanding Software Architecture 4 36.36%
h) Elaborate sequence diagram, activity diagram 7 63.64%
i) Elaborate Compoenentes diagram, deployment dia-
gram
7 63.64%
j) Understand the steps of direct/reverse engineering 5 45.45%
k) Using Software engineering tools 3 27.27%
Average 36.36%
Table 10: Answering Q4 through M1, M3 and M8 for SAD
Discipline.
Metric Average (%) Weight
Result (%)
M1 89.66% 3 268.98%
M3 47.00% 3 141.00%
M8 36.36% 4 145.44%
Average 55.54%
Table 11: M1 and M3 in SAD Discipline.
Metrics Description
Value
M1 Frequency (Total 1088h / 112.50h Fouls) 89.66%
M3 Average of activities/discussions posted on
Blackboard
47%
4.1.8 Question Q8 - Level of Preparation - SAD
According to Figures 3 and 5, the metrics M1, M3
and M7 were designated to answer Question Q8.
In Table 11, we present the results of metrics M1
and M3. In Table 18, we present the results of the me-
tric M7. Finally, in Table 19, we calculate the value
ENASE 2018 - 13th International Conference on Evaluation of Novel Approaches to Software Engineering
22

Table 12: M4 in SAD Discipline.
Question
Not Ap-
proached
Insufficient
Little
Enough
Enough
More
than
Enough
3.1 0% 0% 9.09% 90.91% 0%
3.2 0% 0% 9.09% 81.82% 9.09%
3.3 0% 9.09% 0% 90.91% 0%
3.4 0% 9.09% 18.18% 72.73% 0%
3.5 0% 9.09% 45.45% 36.36% 9.09%
3.6 0% 9.09% 72.73% 18.18% 0%
3.7 0% 0% 63.64% 27.27% 9.09%
3.8 0% 45.45% 18.18% 27.27% 9.09%
3.9 0% 45.45% 18.18% 36.36% 0%
3.10 0% 18.18% 45.45% 36.36% 0%
Average 0% 14.54% 30.00% 51.82% 3.64%
Table 13: Answering Q5 through M1, M3 and M4 for SAD
Discipline.
Metric Average (%) Weight
Result (%)
M1 89.66% 3 268.98%
M3 47.00% 3 141.00%
M4 51.82% 4 207.28%
Average 61.73%
Table 14: M5 in SAD Discipline.
Question
Not Dis-
cussed
Insufficient
Little
Enough
Enough
More than
Enough
3.1 0% 0% 9.09% 90.91% 0%
3.2 0% 0% 9.09% 81.82% 9.09%
3.3 0% 9.09% 0% 90.91% 0%
3.4 0% 9.09% 18.18% 72.73% 0%
3.5 0% 9.09% 45.45% 36.36% 9.09%
3.6 0% 9.09% 72.73% 18.18% 0%
3.7 0% 0% 63.64% 27.27% 9.09%
3.8 0% 45.45% 18.18% 27.27% 9.09%
3.9 0% 45.45% 18.18% 36.36% 0%
3.10 0% 18.18% 45.45% 36.36% 0%
Average 0% 14.54% 30.00% 51.82% 3.64%
Table 15: Answering Q6 through M1, M3 and M5 for SAD
Discipline.
Metric Average (%) Weight
Result (%)
M1 89.66% 3 268.98%
M3 47.00% 3 141.00%
M5 51.82% 4 207.28%
Average 61.73%
Table 16: M6 in SAD Discipline.
Question
No Acti-
vity
Little
Activity
Activity
Performed
Activities
90% 0% 10%
Table 17: Answering Q7 through M1, M3 and M6 for SAD
Discipline.
Metric Average (%) Weight
Result (%)
M1 89.66% 2 179.32%
M3 47.00% 4 188.00%
M6 10.00% 4 40.00%
Average 40.73%
for Q8 as 56.61%. Similarly to Q7, this value indica-
tes that students have the perception that they need to
improve their preparation to deal with challenges and
opportunities related to cloud computing in the mar-
ket. This is in fact an evidence that students are aware
of improvement opportunities they need to strive in
order to perform effectively cloud related activities.
In Table 2, we summarize the results for all Goals,
Questions and Metrics for the SAD discipline.
Table 18: M7 in SAD Discipline.
Question
Not
prepa-
red
Very little
prepared
Little Pre-
pared
Prepared
Very
prepa-
red
5.1 36.36% 27.27% 27.27% 9.09% 0%
5.2 45.45% 18.18% 0% 36.36% 0%
5.3 36.36% 27.27% 27.27% 9.09% 0%
5.4 27.27% 27.27% 27.27% 18.18% 0%
5.5 36.36% 27.27% 9.09% 27.27% 0%
5.6 54.54% 9.09% 36.36% 0% 0%
5.7 36.36% 27.27% 18.18% 18.18% 0%
5.8 18.18% 36.36% 18.18% 27.27% 0%
Average 36.36% 25.00% 20.45% 18.18% 0.00%
Table 19: Answering Q8 through M1, M3 and M7 for SAD
Discipline.
Metric Average (%) Weight
Result (%)
1 89.66% 3 268.98%
3 47.00% 4 188.00%
7 36.36% 3 109.08%
Average 56.61%
4.2 Analyzing Data for the OS
Discipline
Considering that the Operating System discipline has
the same goals, questions and metrics as the SAD dis-
cipline and that it follows the sama analysis as presen-
ted in the previous subsection, we present Table 22
where we summarize the results for all Goals, Ques-
tions and Metrics for this discipline.
4.3 Analysis of the Results of APS and
OS Disciplines
In Table 21, we compare the results for metrics M1-
M8 for the disciplines SAD and OS. In Tables 2 and
22, we present a panoramic view for the goals, questi-
ons and metrics for the disciplines SAD and OS. Ana-
lyzing these values, we can conclude that both disci-
plines have similarities based on their Goals, Questi-
ons and Metrics. Hence, despite being different dis-
ciplines, they reacted uniformly to the proposed ap-
proach that includes cloud computing scenarios in the
activities of the disciplines.
4.4 The Engagement of the Students
As can be seen in the results presented in the fields
Q5 and Q6 (Motivated/Committed: 61.73% SAD/
61.91% OS) of Tables 2 and 22, students from both
disciplines manifested engagement and also commit-
ment to perform the activities contextualized in cloud
computing scenarios. This is an initial evidence that
in fact classes in Computer Science undergraduate
courses can be enriched with these scenarios when ap-
plied using active learning techniques such as flipped
classroom to provide students the opportunity to be
the main participants in the learning process. On the
other hand, teachers can identify improvement oppor-
tunities in each student and guide them to fill gaps in
An Action Research Study towards the Use of Cloud Computing Scenarios in Undergraduate Computer Science Courses
23
topics they are not so confident. This is an iterative
and incremental process that can be conducted with
real scenarios from the market.
Table 20: Collected Metrics for the OS Discipline.
Metric
Description
Value
(Average
M1 Average of students attendance (Frequency) 90.49%
M2 Assignments Average Value 62.50%
M3 Average of activities/discussions posted on Blackbo-
ard
46.35%
M4 Students ’ motivational level in activities 61.91%
M5 Level of commitment to students in the activities 61.91%
M6 Qualification level of students to deal with cloud com-
puting activities
52.64%
M7 Student preparedness level for cloud computing chal-
lenges
56.36%
M8 Percentage of difficulties students had in the activities
with cloud resources
52.34%
Table 21: Comparing the Metrics of SAD and OS Discipli-
nes.
Metric
APS (%) SO (%)
M1 - Average of students attendance (frequency) 89.66% 90.49%
M1 - Average of Students Attendance 64.32% 63.98%
M2 - Average Students Grade 64.80% 62.50%
M3 - Average of the activities/discussions posted
at Blackboard
47.00% 46.35%
M4 - Level of Student Motivation in activities 61.73% 61.91%
M5 - Level of commitment of students in the
activities
61.73% 61.91%
M6 - Level of qualification of pupils to act with
cloud computing (virtualization activities)
40.73% 52.64%
M7 - Level of preparation of students for the
challenges of cloud computing
56.61% 56.36%
M8 - Percentage of difficulties faced by students
in cloud computing activities
55.54% 52.34%
5 CONCLUSIONS
Software is a fundamental component of many sys-
tems, services, and products. Its development con-
sumes increasing amounts of resources. Moreover,
an infrastructure is needed to run and make availa-
ble software to users. The cloud computing paradigm
has increasingly provided a better cost-benefit relati-
onship for both the industry and final users. To deal
with this scenario, students should be prepared to per-
form tasks in this scenario. In this paper, we analyzed
the inclusion of cloud computing scenarios in two un-
dergraduate courses. As future work, there is the pos-
sibility of conducting a new version of this research
in collaboration with industry (Hanna et al., 2015), as
well as applying the described instruments of flipped
classroom and action research approach in industry
for training purposes (Fagerholm et al., 2017).Anot-
her possibility is the conduction of this study in ot-
her universities to compare results and to obtain better
conditions to generalize results and findings.
ACKNOWLEDGMENTS
The first author of this paper received a scholarship
from the Bahia Research Foundation (FAPESB) re-
gistered as BOL0731/2016.
REFERENCES
Armbrust, M., Fox, A., Griffith, R., Joseph, A. D., Katz,
R., Konwinski, A., Lee, G., Patterson, D., Rabkin, A.,
Stoica, I., et al. (2010). A view of cloud computing.
Communications of the ACM, 53(4):50–58.
Bahill, A. T. and Madni, A. M. (2017). Discovering System
Requirements, pages 373–457. Springer International
Publishing, Cham.
Bishop, J. L. and Verleger, M. A. (2013). The flipped class-
room: A survey of the research. In ASEE National
Conference Proceedings, Atlanta, GA, volume 30, pa-
ges 1–18.
Bond, J. (2015). The Enterprise Cloud: Best Practices for
Transforming Legacy IT. O’Reilly Media.
Borges, H., Hora, A., and Valente, M. T. (2016). Pre-
dicting the popularity of github repositories. In Pro-
ceedings of the The 12th International Conference
on Predictive Models and Data Analytics in Software
Engineering, PROMISE 2016, pages 9:1–9:10, New
York, NY, USA. ACM.
de Paula, A. C. M., de Figueiredo Carneiro, G., and Maciel,
R. S. P. (2017). A characterization of cloud compu-
ting adoption based on literature evidence. In ICEIS
2017 - Proceedings of the 19th International Confe-
rence on Enterprise Information Systems, Volume 1,
Porto, Portugal, April 26-29, 2017, pages 53–63.
Fagerholm, F., Kuhrmann, M., and M
¨
unch, J. (2017). Gui-
delines for using empirical studies in software engi-
neering education. PeerJ Computer Science, 3:e131.
Fernando, N., Loke, S. W., and Rahayu, W. (2013). Mo-
bile cloud computing: A survey. Future generation
computer systems, 29(1):84–106.
Green, L. S., Banas, J. R., and Perkins, R. A. (2017). The
flipped college classroom.
Hanna, P., Allen, A., Kane, R., Anderson, N., and McGo-
wan, A. (2015). Building professionalism and em-
ployability skills. Computer Science Education,
25(3):292–310.
Hendricks, C. C. (2012). Improving schools through action
research: A reflective practice approach. Pearson
Higher Ed.
Holwell, S. (2004). Themes, iteration, and recoverability
in action research. In Information Systems Research,
pages 353–362. Springer.
Jones, S., Irani, Z., Sivarajah, U., and Love, P. E. (2017).
Risks and rewards of cloud computing in the uk pu-
blic sector: A reflection on three organisational case
studies. Information Systems Frontiers, pages 1–24.
Lin, Y.-T., Wen, M.-L., Jou, M., and Wu, D.-W. (2014). A
cloud-based learning environment for developing stu-
ENASE 2018 - 13th International Conference on Evaluation of Novel Approaches to Software Engineering
24
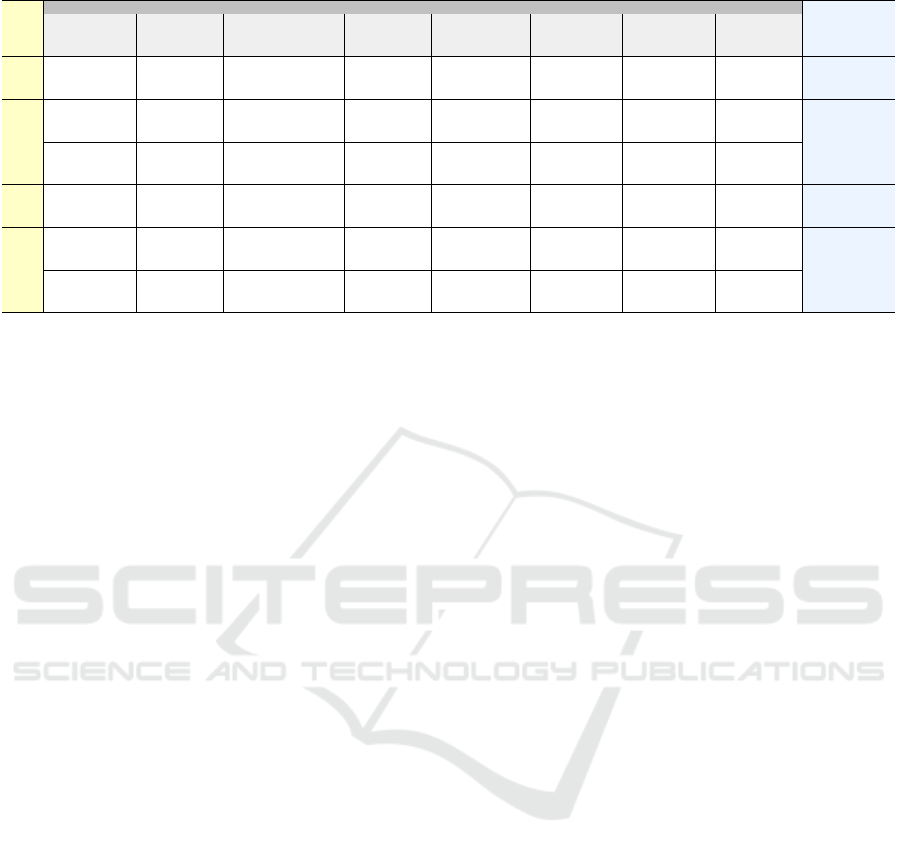
Table 22: Goals, Questions and Metrics for OS Discipline.
Research issues
Q1
Partici-
pation
Q2
Evalu-
ation
Q3
Activities
Q4
Diffi-
culties
Q5
Motivated
Q6
Commi-
tted
Q7
Qualifi-
cation
Q8
Chall-
enges
Results
G1
Partici-
pation
(63.98%)
(62.50%)
(46.35%)
Low Produc-
tivity
–
Motivated
(61.91%)
Compro-
mised
(61.91%)
– — (59.33%)
G2
Partici-
pation
(63.98%)
–
(46.35%)
Low Produc-
tivity
–
Motivated
(61.91%)
– – – (57.41%)
G3
Partici-
pation
(63.98%)
–
(46.35%)
Low Produc-
tivity
– –
Compro-
mised
(61.91%)
– – (57.41%)
G4
Partici-
pation
(63.98%)
– – – – – –
Little
Prepared
(56.36%)
(60.17%)
G5
Partici-
pation
(63.98%)
(62.50%)
(46.35%)
Low Produc-
tivity
Diffi-
culties
(52.34%)
Motivated
(61.91%)
Compro-
mised
(61.91%)
– – (58.17%)
G6
Partici-
pation
(63.98%)
–
(46.35%)
Low Produc-
tivity
– – –
Very little
Qualified
(52.64)
– (54.32%)
dent reflection abilities. Computers in Human Beha-
vior, 32:244–252.
Marston, S., Li, Z., Bandyopadhyay, S., Zhang, J., and
Ghalsasi, A. (2011). Cloud computingthe business
perspective. Decision support systems, 51(1):176–
189.
McNiff, J. (2016). You and your action research project.
Routledge.
Mokhtar, S. A., Ali, S. H. S., Al-Sharafi, A., and Aborujilah,
A. (2013). Cloud computing in academic institutions.
In Proceedings of the 7th international Conference on
Ubiquitous information Management and Communi-
cation, page 2. ACM.
Newman, D. L., Deyoe, M. M., Connor, K. A., and Lamen-
dola, J. M. (2015). Flipping stem learning: Impact on
students process of learning. Curriculum Design and
Classroom Management, page 23.
Oliveira, T., Thomas, M., and Espadanal, M. (2014). Asses-
sing the determinants of cloud computing adoption.
Information & Management, 51(5):497–510.
Petcu, D. and Vasilakos, A. V. (2014). Portability in clouds:
approaches and research opportunities. Scalable Com-
puting: Practice and Experience, 15(3):251–270.
Ryan, M. D. (2011). Cloud computing privacy concerns on
our doorstep. Communications of the ACM, 54(1):36–
38.
Sadiku, M. N., Musa, S. M., and Momoh, O. D. (2014).
Cloud computing: opportunities and challenges. IEEE
potentials, 33(1):34–36.
Silberschatz, A., Galvin, P. B., and Gagne, G. (2014). Ope-
rating system concepts essentials. John Wiley & Sons,
Inc.
Smith, A., Bhogal, J., and Sharma, M. (2014). Cloud
computing: adoption considerations for business and
education. In Future Internet of Things and Cloud
(FiCloud), 2014 International Conference on, pages
302–307. IEEE.
Sultan, N. (2010). Cloud computing for education: A new
dawn? International Journal of Information Manage-
ment, 30(2):109–116.
Tucker, B. (2012). The flipped classroom. Education next,
12(1).
Vaquero, L. M. (2011). Educloud: Paas versus iaas cloud
usage for an advanced computer science course. IEEE
Transactions on Education, 54(4):590–598.
Williams, A., Sun, Z., Xie, K., Garcia, E., and Ashby, I.
(2017). Flipping STEM, pages 149–186. Springer In-
ternational Publishing, Cham.
Zhang, Q., Cheng, L., and Boutaba, R. (2010). Cloud com-
puting: state-of-the-art and research challenges. Jour-
nal of internet services and applications, 1(1):7–18.
An Action Research Study towards the Use of Cloud Computing Scenarios in Undergraduate Computer Science Courses
25
