
Polymeric Carriers – The Influence of Body Fluid Compounds on a
Drug Local Release
Anna Trusek-Holownia and Alicja Latka
Wroclaw University of Science and Technology, Division of Bioprocess and Biomedical Engineering, Wybrz,
Wyspianskiego 27, Wroclaw, Poland
Keywords: Polymeric Drug Carrier, Diffusion, Mass Transport Coefficient, Body Fluid Compounds, Local Therapy.
Abstract: The release of a model compound (cyanocobalamin) from the core-shell structure of drug carrier was
considered. Mass transfer was described by the classical equation describing a diffusion mass flow. The
presence of compounds found in body fluids on the diffusional mass stream was investigated. It has been
shown that high molecular weight compounds unable to penetrate the carrier surface form on the carrier
surface a layer that slightly slows the drug release. Slowing down also occurs in the case of counter-current
transport of soluble organic components. However, the salts (particularly NaCl) present in body fluids,
probably due to the emerging osmotic pressure, significantly accelerate the transport of the released drug. In
order to prevent this phenomenon, salts at the concentrations equal to their concentrations in the fluid
surrounding the carrier should be placed into the carrier.
1 INTRODUCTION
Drug delivery systems based on polymers have been
studied over the last ten years in the aspect of
achieving high therapeutic concentrations of anti-
tumor drugs in local therapies (Davis et al., 2008;
Weinberg et al., 2008; De Souza et al., 2010 ). The
development of these technologies is fueled by
increasing the bioavailability of the drug at the
disease site, delivering it to cancer tissues, increasing
its solubility and minimizing side effects. Existing
systems can be divided into two groups depending on
how they are delivered and how they work.
The first consists of systemic delivery and is based
primarily on nanomaterials such as polymer
nanoparticles, liposomes and dendrimers. Such
carriers have the function of actively locating the
target site by coupling them to various chemical
species that have a strong affinity for markers of
tumor expression or by releasing the mass as a result
of responses to localized stimuli (pH, temperature,
etc.) (Wolinsky et al., 2012; Klinkier, 2017; Li et all,
2017).
The second group includes the polymeric carriers
located at the site of the cut tumor or adjacent to
cancerous tissue. These solutions have been
implemented in a variety of forms including films,
gels, plates and particles (Langer, 1983).
Polymers used in these systems are of natural
origin (Al-Ghananeem et al., 2009; Gerber et al.,
2011; Li et al., 2011; Barhoumi et al., 2015; Kulkarni
et al., 2015), however also synthetic polymers are
used (Wolinsky et al., 2012). They are usually not
biodegradable but biocompatible.
The application of the second group of carriers is
to release the active ingredient at a strictly defined
daily dose, at a relative steady stream value. The
previous paper (Trusek-Holownia and Jaworska,
2012) presented the model of a drug diffusive
transport from the core-shell type carriers. The
overall mass transport coefficient is applied in this
model.
Considering the resistances of mass transport, it
has been accepted and verified (Trusek-Holownia and
Jaworska, 2014) that the dominant resistance is
derived from the transport through the membrane.
Therefore, the value of the coefficient strongly
depends on a membrane thickness, its porosity, a pore
size. It is also a function of the type of substance
(mainly it’s diffusion coefficient and molecule size)
and the type of environment (the medium filled the
pores of the membrane).
In presented work an additional parameter was
considered, which may influence on the mass flow
rate. The influence of compounds present in body
fluids surrounding the carriers has been studied. As
these carriers are administered at a site that has been
Trusek-Holownia, A. and Latka, A.
Polymeric Carriers – The Influence of Body Fluid Compounds on a Drug Local Release .
DOI: 10.5220/0006657202410246
In Proceedings of the 11th International Joint Conference on Biomedical Engineering Systems and Technologies (BIOSTEC 2018) - Volume 1: BIODEVICES, pages 241-246
ISBN: 978-989-758-277-6
Copyright © 2018 by SCITEPRESS – Science and Technology Publications, Lda. All rights reserved
241
changed by disease (inflammation) or after removal
of the tumor, the somatosensory efflux is a common
occurrence. That why the compounds present in
lymph were considered.
Lymph consists mainly of intrahepatic fluid, but
in relation to it there is a much higher concentration
of organic matter, fats and immune cells (leukocytes).
The composition of a lymph depends on where it
originated and how inflammation progresses. Table 1
gives the average composition of lymph.
Table 1: The average composition of lymph.
Compound
Concentration [g/L]
Sodium chloride
8.0
Glucose
0.7 – 1.0
Glycerol
1.0-10.0*
Triglycerides
1.5 – 13.2
Proteins (mostly
albumin)
20- 25
Leukocytes
up to 500*
The influence of low molecular components
capable of penetrating the carrier (a counter-current
flow) and a substance capable of accumulating on the
polymeric carrier surface were determined. In the first
case the influence of salt (NaCl) present in
physiological fluid, glucose and glycerol was
determined; in the second protein (albumin) and
triglycerides. Because of the specificity of the study,
leukocyte accumulation was not tested. The model
compound released from the carrier was
cyanocobalamin.
2 MATERIALS AND METHODS
2.1 Materials
- cyanocobalamin (vitamin B12), Lowry Reagent,
Folin & Ciocalteus Phenol Reagent, Sigma Aldrich
- NaCl, Beef albumin, glycerol, ethanol, POCh
- Glucose, Chempur
- Liquick Cor-TG 30 kit, Pz Cormay
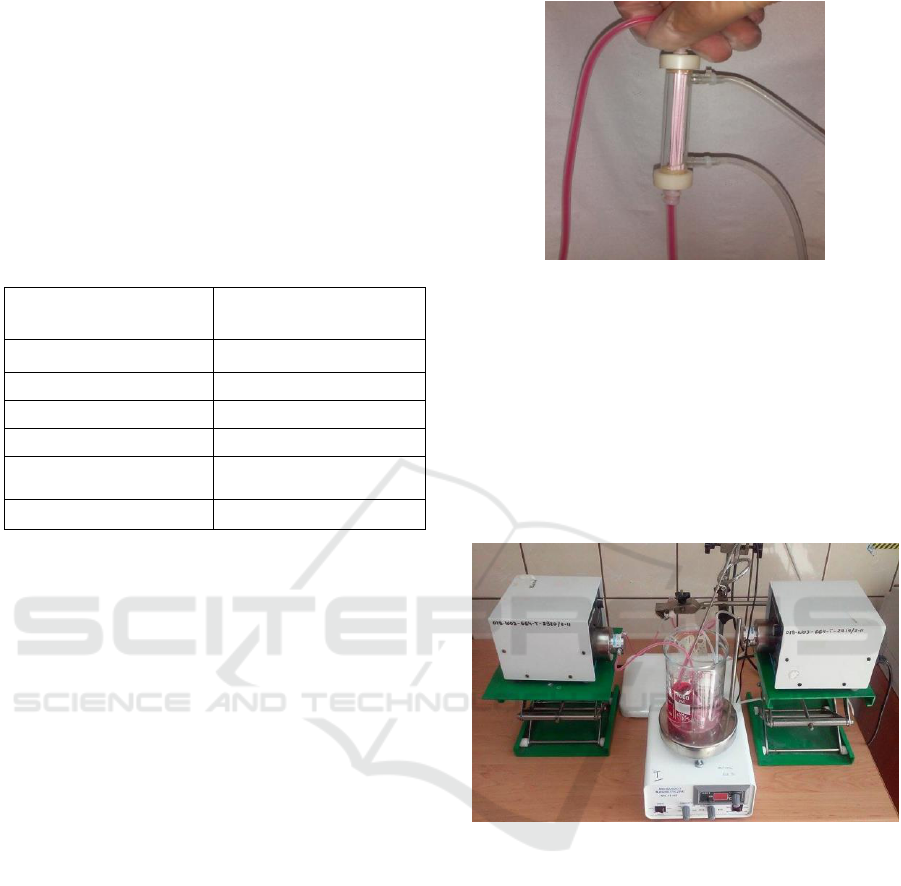
- a module (Photo 1) containing asymmetric capillary
tubes made of polysulfone with a 10kDa cutoff point
(IBIB-PAN, Warsaw). The total geometrical area of
the capillaries was 2.50 · 10
-3
m
2
.
Photo 1: The module with asymmetric capillaries made of
polysulfone with a 10 kDa cut-off point (IBIB-PAN,
Warsaw).
The solution of the model compound was pressed
into the capillary, which was then circulated using a
pump (Cole-Partner). On the outside of the
capillaries, the receiver phase was circulating. The
volumes of the phases were chosen to allow analysis
of the model compound. The equipment was
presented in Photo 2.
Photo 2: The equipment used in the study.
2.2 Determination of Cyanocobalamin
Concentration
Cyanocobalamin concentration was determined
spectrophotometrically at wavelength λ = 361 nm.
Solutions of substance ranging from 0.005 g/L to 0.09
g/L were prepared and the standard curve:
Abs(361)=21.53
.
C [g/L] on the basis of the
absorbance values was obtained.
2.3 Determination of Sodium Chloride
Concentration
Sodium chloride concentration was measured by
conductivity using a calibrated ionoselective
BIODEVICES 2018 - 11th International Conference on Biomedical Electronics and Devices
242

electrode. Solutions of substance ranging from 0.01
g/L to 1 g/L were prepared and based on the obtained
conductivity values a standard curve was obtained:
Conductivity [μS/cm] = 2198
.
C [g/L].
2.4 Determination of Glucose
Concentration – DNS Test
Glucose levels were determined by the DNS test
(Miller, 1959). Solutions of substance ranging from
0.1 g/L to 1.9 g/L were prepared and the standard
curve: Abs (550 nm) = 0.537 C [g /L] - 0.073 was
obtained.
2.5 Determination of Glycerol
Concentration
Glycerol concentration was determined by a Liquick
Cor-TG kit. The analytical method is based on a
colorimetric method with glycerolphosphate oxidase
(Jacobs and Van Denmark, 1960). Glycerol solutions
in the range of 0.1 g/L to 0.6 g/L were prepared and
the standard curve: Abs (546 nm) = 1.30
.
C [g/ L] +
0.266 was obtained.
2.6 Determination of Protein
(Albumin) Concentration
Albumin concentration was determined by the Lowry
method (Lowry et al., 1951). Albumin solutions were
prepared at concentrations ranging from 0.02 g/L to
0.2 g/L. Based on the absorbance values obtained in
the Lowry test, a standard curve: Abs (750 nm) = 3.39
.
C [g/L] + 0.122 was obtained.
2.7 Mass Transport Study
Cyanocobalamin diffusion transport was investigated
through polysulphone membrane. At the beginning of
the study, the membrane was hydrophilized with 50%
ethanol for 1 h, then the ethanol was washed with
distilled water by continuously fed at 0.3 MPa
(resulting in a permeate flow).
Modules used in the study (for each experiment a
new one) contained 10 capillaries (length 0.071m,
wall thickness 250μm, inner diameter 530μm). The
total geometric area (an internal) of the capillaries
was - 2.50 · 10
-3
m
2
. The study was conducted at 37°C
corresponding to the human body. In order to exclude
the significant influence of the mass transport in
continuous phases, they were subjected to circulation
(in the range of 16-22 L/h). A cyanocobalamin
aqueous solution at a concentration of 1 g/L (a model
solution) was circulated on a tube side. The receiving
solution was circulated on a shell side. The volumes
of both phases were equal to 75 mL. The interface
was maintained by establishing the flow of both
phases and equalizing the pressure on both sides of
the membrane.
In case of studying the effect of counter-current
diffusion in the receiving phase in individual
experiments, there were: NaCl at 8 g/L, 1g/L glucose
or 10 g/L glycerol. The changes in the concentrations
of the individual components were monitored in both
phases at fixed intervals. All analysis was performed
in duplicate.
Testing the influence of components (albumin,
triglycerides) located on the membrane surface was
preceded by sorption/deposition process. This
process was performed at 37
o
C, for 2 h circulating on
the outside of the membrane, the medium (75 mL)
containing the tested components, which in individual
experiments were triglycerides (at the concentration
10 g/L) or albumin (25 g/L). Inside the capillaries,
water was circulated. The amount of substance
adsorbed/ deposited on the surface of the membrane
was calculated on the basis of the Lowry method for
the protein and of the titrimetric method for
triglycerides.
During the transport analysis, the sorbate was
present still in receiving solution so that the sorption
equilibrium was maintained throughout the whole
process. The water present during the sorption
process (circulating inside the capillaries) was
replaced with a solution of 1 g/L cyanocobalamin.
The last stage of the study was to determine the
transport of cyanocobalamin mass in conditions
similar to those of living organisms. The research was
preceded by the sorption of albumin and triglycerides,
conducted at the circulation of the medium for 2h on
the outside of the membrane at 37
o
C. The
concentrations of the individual components in the
circulation medium were 25 g/L albumin and 10 g/L
triglycerides. Due to the addition of triglycerides the
medium was emulsified. During the monitoring of the
transport of cyanocobalamin mass, NaCl and glucose
were added to the collecting medium to obtain a
concentration of 8 g/L and 1 g/L, respectively. The
concentration of cyanocobalamin in the intra-
capillary circulating phase was 1 g/L and the flow of
both phases was maintained at 16-22 L/h. Prior to
spectrophotometric analysis, cyanocobalamin
samples were centrifuged (10 min, 4000 rpm) to
separate the fat phase.
Polymeric Carriers – The Influence of Body Fluid Compounds on a Drug Local Release
243
3 RESULTS
Based on the changes of cyanocobalamin
concentration, a mass flow was determined over time.
Due to the continuous phase mixing, the constant
concentration inside these phases was assumed, hence
the mass flux density (n) was:
(1)
By the mass balancing:
(2)
where: A – mass transport surface [m
2
], C
ex
, C
in
- the
concentration of the transported component in the
receiving phase and inside the carrier, respectively
[g/L], K – mass transport coefficient [m/s], m - mass
flow [g/s], n - mass flux density [g/s
.
m
2
], P – partition
coefficient, P [-] = C*
in
/C*
ex
(C* - equilibrium
concentration [g/L]), t - time [s], V
ex
, V
in
- the volume
of the receiving phase and the internal phase,
respectively [L].
After integrating equation (2) with time from 0 to
t we can obtain:
(3)
The linear dependence of
= f(t)
confirms the correctness of the assumption of the flat
concentration profile in continuous phases. Thus,
mass transport coefficient can be easily determined
from the equation (3) (Trusek-Holownia and
Noworyta, 2003).
As the mass transport surface, the entire geometric
surface of the membrane multiplied by a porosity
factor (estimated from electron microscope images)
at the level of 0.5 was taken. The possible error
resulting from the estimation of porosity in relation to
the calculations presented in the article is not
significant, as the relative relations are analysed
(exact the relations of mass transport coefficients
determined in different conditions). Due to the
environment within the capillaries and to the external
environment, the value of the partition coefficient (P)
was assumed to be 1.
3.1 Influence of Counter – Current
Diffusion
The study was conducted for three low molecular
weight substances found in the body fluids. A
solution containing 8 g/L NaCl, 1 g/L glucose or 10
g/L glycerol was circulated on the receiving side.
Changes in the concentration of the transported
component (cyanocobalamin) were monitored in both
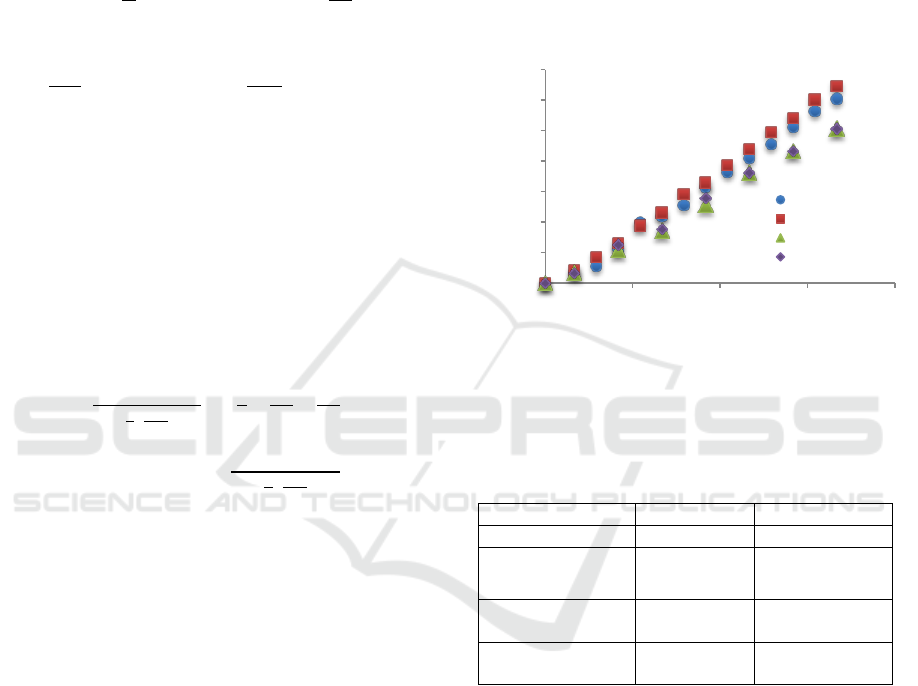
phases until equilibrium was reached. An example of
the change in cyanocobalamin concentration in the
receiving phase for different media is shown in Fig.
1, while Table 2 shows the coefficients calculated
from the concentration changes in both phases based
on equation (3).
Figure 1: Cyanocobalamin concentration changes in time in
receiving phase (water, water with NaCl at 8 g/L, waterwith
glucose at 1 g/L and with glycerol at 10 g/L), 37
o
C, cut-off
polysulfone membrane10 kDa, A=2.50·10
-3
m
2
.
Table 2: Mass transport coefficient for cyanocobalamin
calculated on the base of equation (3), 37
o
C.
Receiving phase
K [m/s]
Error[m/s]
Water
3.34
.
10
-8
4.16
.
10
-11
Water + 8 g/L
NaCl
3.96
.
10
-8
1.23
.
10
-11
Water + 1 g/L
glucose
2.50
.
10
-8
5.70
.
10
-11
Water + 10
g/L glicerol
2.78
.
10
-8
3.22
.
10
-11
As expected, counter-current diffusers may affect
the reduction of the mass transport coefficient. This
phenomenon has been observed for organic
compounds. The effect is especially visible for
glucose, which was given at 10 times lower
concentration than glycerol and the cyanocobalamin
mass transport coefficient was reduced then by about
25%.
A different effect was observed in the presence of
NaCl in the receiving phase. Salts of 10 g/L
significantly increased the osmotic pressure and
hence the effect of this phenomenon may be the
reason for accelerated diffusion in the opposite
direction. The mass transport coefficient increased in
this case by 18.6%.
0
1
2
3
4
5
6
7
0 1 2 3 4
Cyanocobalamin concentration
in receiving phase [g/L]
Time [h]
H2O
H2O + NaCl
H2O + Glucose
H2O + Glicerol
BIODEVICES 2018 - 11th International Conference on Biomedical Electronics and Devices
244
3.2 Effect of the Organic Layer on the
Carrier Surface
Substances present in the body fluids may tend to
settle on the surface of a polymeric carrier. This
phenomenon will especially affect acute
inflammation, where the leukocyte concentration is
very high (up to 50% w/v in the lymph (Agrawal et
al., 2008)). Due to the engineering nature of the study
and the particular restrictions associated with
leukocyte work, the impact of this component of the
system was not investigated. The influence of the
presence of protein (albumin) and triglycerides was
tested. In the case of protein it is possible to talk about
its sorption on the carrier and the sorption equilibrium
present in the system. In the case of triglycerides, they
are deposited on the surface.
Studies on the transport of cyanocobalamin mass
were preceded by circulation of the protein solution
at concentration (25 g/L) and a medium containing
triglycerides (10 g/L). After two hours, the mass of
the components on the membrane surface was
estimated. They amounted to 11.4 g/cm
2
for the
protein and 8.95 g/cm
2
for triglycerides. These values
have not changed significantly (the range of
analytical error) after leaving the system for another
22 h.
Table 3. Mass transport coefficient for cyanocobalamine for
the carriers with and without organic compounds layer,
37
o
C.
Receiving phase
K [m/s]
Error [m/s]
Carrier
3.34
.
10
-8
4.16
.
10
-11
Carrier with protein
layer (11.4 mg/cm
2
)
3.14
.
10
-8
4.75 ·10
-12
Carrier with
triglyceride layer (8.95
mg/cm
2
)
3.04
.
10
-8
4.67 ·10
-11
Table 3 lists the values of the mass transfer
coefficient for cyanocobalamin for the carrier with
and without the organic layer. Both in the presence of
the protein layer and the triglycerides, the value of the
mass transport coefficient has been reduced.
However, it is not very significant (less than
expected) decrease and does not exceed 6% lower of
the value without any layer.
3.3 Transport in Multi-component
System (Real Conditions)
In the last stage of the study, the carrier was covered
with the layer of protein and triglycerides and
cyanocobalamin was transported to the medium
containing NaCl, glucose, glycerol, albumin and
triglycerides at concentrations previously tested and
corresponding to concentrations in the human fluids.
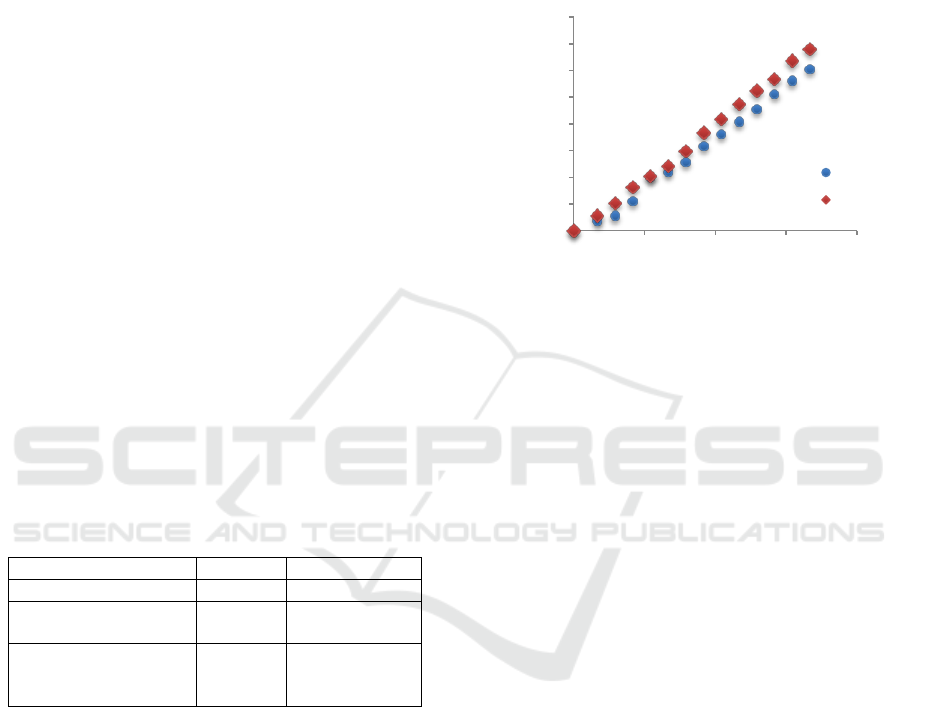
Figure 2 shows the changes in cyanocobalamin
concentration in the receiving phase and it was
compared with process run for the carrier without
layer with transport to water.
Figure 2: Cyanocobalamin concentration changes in time in
receiving phase (water or in the medium simulating a body
fluid) at 37
o
C. Under real conditions the carrier was covered
with protein and triglycerides layer.
The mass transport coefficient under real
conditions was calculated on 7.78·10
-11
[m/s]. The
value is 8.4% higher than this one obtained for carrier
without layers and for water as receiving phase.
4 CONCLUSIONS
The studies indicate that the external environment
should be considered for the precise design of drug
carriers. Both high molecular weight substances,
which are not capable of penetrating into the carrier,
as well as the low molecular weight diffusers in the
counter-current flow influence the mass transport
coefficient from drug carriers.
Particular importance is the presence of salts in
the body fluids. Probably, at their high concentration,
the osmotic pressure generated by them promotes
faster a mass release from carriers. As a result, this
effect alleviates the opposite effects coming from
compounds adsorbed on a carrier surface as well as
the counter-current diffusion of low molecular
organic compounds. The effect resulting from the
presence of salt outside carriers can be minimized by
using analogous salt concentrations inside carriers.
The present of leucocytes was not considered. It
is expected that they can have a significant influence
on mass release rate and this effect should be tested
before medical therapies.
0
1
2
3
4
5
6
7
8
0 1 2 3 4
Cyanocobalamin
concentration in receiving
phase [g/L]
Time [Min]
H2O
real
Polymeric Carriers – The Influence of Body Fluid Compounds on a Drug Local Release
245

ACKNOWLEDGEMENTS
This work was performed within the Project No.
2013/11/B/ST8/03672 sponsored by the National
Science Centre (NCN) of Poland.
REFERENCES
Abe T., Sakane M., Ikoma T., Kobayashi M., Nakamura S.,
Ochiai N., 2008. Intraosseous delivery of paclitaxel-
loaded hydroxyapatitealginate composite beads
delaying paralysis caused by metastatic spine cancer
in rats. J. Neurosurg. Spine 9 , 502–510.
Agrawal V., Doelken P., Sahn S.A., 2008. Pleural Fluid
Analysis in Chylous Pleural Effusion. CHEST Journal.
133(6), 1436-1441.
Al-Ghananeem A.M., Malkawi A.H., Muammer Y.M.,
Balko J.M., Black E.P., Mourad W., Romond E.,
2009. Intratumoral delivery of Paclitaxel in solid tumor
from biodegradable hyaluronan nanoparticle
formulations. AAPS PharmSciTech. 10, 410–417.
Barhoumi A., Salvador‐Culla B., Kohane D.S., 2015. NIR‐
Triggered Drug Delivery by Collagen‐Mediated
Second Harmonic Generation. Advanced healthcare
materials. 4(8), 1159-1163.
Davis M.E., Chen Z., Shin D.M., 2008. Nanoparticle
therapeutics: an emerging treatment modality for
cancer. Nat. Rev. Drug Discov. 7, 771–782.
De Souza R., Zahedi P., Allen C.J., Piquette-Miller M.,
2010. Polymeric drug delivery systems for localized
cancer chemotherapy. Drug Deliv. 17, 365–375.
Gerber D.E., Gallia G.L., Tyler B.M., Eberhart C.G., Royer
G., Grossman S.A., 2011. A novel polymer gel for the
delivery of local therapies to intracranial tumors: In
vivo safety evaluation. J. Biomed. Mater. Res. A. 99,
479–484.
Jacobs N.J., Van Denmark P., 1960. The purification and
properties of the α-glycerophosphate-oxidizing enzyme
of Streptococcus faecalis 10C1. J. Arch. Biochem.
Biophys. 88, 250-255.
Karpińska-Jazdon L., Spychalski W., 2005. Diagnostic
difficulties in case of pleural and chylous effusion in
mesothelioma patient. Wielkopolskie Centrum Chorób
Płuc I Gruźlicy w Poznaniu, Współczesna Onkologia
tom 9, 273-275.
Klinker K., 2017, Secondary-Structure-Driven Self-
Assembly of Reactive Polypept(o)ides: Controlling
Size, Shape, and Function of Core Cross-Linked
Nanostructures, Angewandte Chemie International
Edition, 56, 9608-9613.
Konishi M., Tabata Y., Kariya M., Suzuki A., Mandai M.,
Nanbu K., Takakura K., Fujii S., 2003. In vivo anti-
tumor effect through the controlled release of cisplatin
from biodegradable gelatin hydrogel. J. Control.
Release. 92, 301–313.
Kulkarni C. V., Moinuddin Z., Patil-Sen Y., Littlefield R.,
Hood M., 2015. Lipid-hydrogel films for sustained drug
release. International journal of pharmaceutics. 479(2),
416-421.
Langer R., 1983. Implantable controlled release systems.
Pharmacol. Ther. 21, 35–51.
Li X., Kong X., Zhang J., Wang Y., Wang Y., Shi S., Guo
G., Luo F., Zhao X., Wei Y., Qian Z., 2011. A novel
composite hydrogel based on chitosan and inorganic
phosphate for local drug delivery of camptothecin
nanocolloids. J. Pharm. Sci. 100, 232–241.
Li X., Lachmanski L., Safi S., Sene S., Serre C., Greneche
J., Zhang J., Gref R., 2017, New insights into the
degradation mechanism of metal-organic frameworks
drug carriers, Scientific Reports 7, 13142- 13152.
Liu X., Heng W.S., Li Q., Chan L.W. 2006. Novel
polymeric microspheres containing norcantharidin for
chemoembolization. J. Control. Release. 116, 35–41.
Lowry O., Rosebrough N., Farr A., Randall R., 1951.
Protein measurement with the Folin phenol reagent. J.
Biol. Chem. 193, 265– 270.
McDaniel J.R., Callahan D.J., Chilkoti A., 2010. Drug
delivery to solid tumors by elastin-like polypeptides.
Adv. Drug Deliv. Rev. 62, 1456–1467.
Miller C.N., 1959. Use of dinitrosalicyle acid reagent for
determination of reducing sugar. Analit. Chem. 81, 426
– 428.
Trusek-Holownia A., Noworyta A., 2003, Modelling of the
enzymatic synthesis of taste dipeptides with
simultaneous extraction in a membrane phase
contactor, Desalination 162, 335-342.
Trusek-Holownia A., Jaworska P., 2014. Polymeric drug
carriers, Biocybern. Biomed. Eng. 35, 192–197.
Weinberg B.D., Blanco E., Gao J., 2008. Polymer implants
for intratumoral drug delivery and cancer therapy. J.
Pharm. Sci. 97, 1681–1702.
Wolinsky J. B., Colson Y. L., Grinstaff M. W., 2012. Local
drug delivery strategies for cancer treatment: gels,
nanoparticles, polymeric films, rods, and wafers.
Journal of controlled release. 159(1), 14-26.
BIODEVICES 2018 - 11th International Conference on Biomedical Electronics and Devices
246
