
Predicting Hospital Capacity and Efficiency
James P. McGlothlin
1
, Sriveni Vedire
1
, Hari Srinivasan
1
, Amar Madugula
1
,
Srinivasan Rajagopalan
1
and Latifur Khan
2
1
Fusion Consulting Inc, Irving, TX, U.S.A.
2
University of Texas at Dallas, Richardson, TX, U.S.A.
Keywords: Predictive Analytics, Data Warehousing, Patient Movement, Discrete Event Simulation.
Abstract: Hospitals and healthcare systems are challenged to service the growing healthcare needs of the population
with limited resources and tightly restrained finances. The best healthcare organizations constantly seek
performance improvement by adjusting both resources and processes. However, there are endless options
and possibilities for how to invest and adapt, and it is a formidable challenge to choose the right ones. The
challenge is that each potential change can have far reaching effects. This challenge is exacerbated even
further because it can be very expensive for a hospital to experience logjams in patient movement. Each and
every change has a “ripple” effect across the system and traditional analytics cannot calculate all the
ramifications and opportunities associated with such changes. This project uses historical records of patient
treatment plans in combination with a virtual discrete event simulation model to evaluate and predict capacity
and efficiency when resources are added, reduced or reallocated. The model assigns assets as needed to
execute the treatment plan, and calculates resulting volumes, length of stay, wait times, cost. This provides a
valuable resource to operations management and allows the hospital to invest and allocate resources in ways
that maximize financial benefit and quality of patient care.
1 INTRODUCTION
Hospitals and healthcare systems, especially US-
based academic healthcare institutions, are under
constant pressure to streamline and achieve more with
limited resources and finances. With the growth of
electronic medical record systems (EMRs), health-
care data warehouses, and business intelligence
technologies, there is more information available to
identify problems and opportunities for improvement.
For example, we have robust dashboards which show
length of stay for patient cohorts and how these values
compare to benchmarks. We have information
around patient time in “boarder” status, i.e. being
boarded in one department when they belong in
another. Examples include patients in the emergency
department (ED) who have been admitted to the
hospital, patients in surgical recovery rooms who are
no longer under the effects of anesthesia, and patients
in intensive care units (ICUs) who no longer require
critical care. We have information from patient-
reported data, clinical engineering interfaces, staff
time and attendance, and patient surveys. There is a
staggering and growing amount of data available.
The challenge though is to use all this information
to make good decisions and initiate valuable change.
We can create change by adding or reallocating
resources and by changing processes. Resources that
could be adjusted include staff and staff schedules,
beds and bed accommodations, operating rooms
(ORs) and OR allocation schedules, imaging
resources, clinic and ambulatory surgery locations,
staffing and hours and more. Example processes that
can be manipulated include: house and bed
management; ED registration, triage and rooming
procedures; preventive care initiatives; isolation
process; discharge procedures; care management
protocols; and urgent care facilities. It is challenging
enough to predict the cost and return on investment
(ROI) from such changes to make educated decisions.
However, what really makes the challenge difficult is
that each change can have far-reaching effects. For
example, adding ED resources could create a logjam
of ED patients waiting for an inpatient bed, or cause
significant congestion in inpatient departments.
Adding an OR room or adjusting operating schedules
can create problems placing patients after
perioperative recovery. Even a simple change like
562
McGlothlin, J., Vedire, S., Srinivasan, H., Madugula, A., Rajagopalan, S. and Khan, L.
Predicting Hospital Capacity and Efficiency.
DOI: 10.5220/0006658905620570
In Proceedings of the 11th International Joint Conference on Biomedical Engineering Systems and Technologies (BIOSTEC 2018) - Volume 5: HEALTHINF, pages 562-570
ISBN: 978-989-758-281-3
Copyright © 2018 by SCITEPRESS – Science and Technology Publications, Lda. All rights reserved

adjusting discharge order times can create a logjam of
patients waiting for the orders to be processed. The
challenge is exacerbated because it can be very
expensive for a hospital to experience logjams in
patient movement. For example, an admitted patient
who is still in an ED bed is acquiring additional cost
without compensation, and very likely getting
reduced care. A patient occupying a regular bed, but
requiring critical care treatment, is not only receiving
reduced treatment, but is also creating additional staff
requirements for the non-critical care department.
Even small changes such as housekeeping procedures
or staffing can have far-reaching effects across the
hospital system.
In addition to the operational challenges above,
there are both opportunities and risks for the actual
clinical treatment of the patient. It is important to
ascertain that any change in process or staffing does
not reduce care. Generally, we measure quality of
care by key performance indicators (KPIs) including
readmission rate, mortality rate and rate of hospital-
acquired infections. Additionally, disposition should
be included to indicate that a discharge to home is a
better outcome than dispositions such as discharge to
skilled nursing facility. Finally, patient experience
(customer satisfaction) results can be included.
Additionally, treatment processes can be
improved. These include disease-specific clinical
protocols such as initiatives for sepsis, exacerbated
chronic obstructive pulmonary disease (COPD),
congestive heart failure, pneumonia and stroke.
There are also initiatives around specific clinical
events such as ventilation, blood transfusions
(McGlothlin 2017), administration of broad spectrum
anti-biotics, management of central lines and
catheters. Each of these can have far-reaching
effects. For example, improving ventilation protocols
can reduce reintubation and instances of ventilator-
acquired pneumonia, and can result in reduced
readmissions to ICU units. A significantly successful
clinical program can increase the stress on the
hospital by increasing the survival rate and putting
pressure on lower acuity units to absorb more
patients.
There is simply no meaningful way for anyone to
manually determine all the possible ramifications,
both positive and negative, from a change in resource
allocation, process or treatment. In this project, we
are proposing a digital simulation model which
coupled with bio-statistics can provide much more
meaningful and actionable insight.
2 BACKGROUND
In our investigation and design of this project we
looked at literature and industry use cases
surrounding:
Predictive analytics in hospitals
Tools for what-if scenarios for healthcare
models
Predictions models in other industries
Discrete event simulation is the process of
creating a digital model of specific events and rules.
Every treatment or movement in a hospital can be
considered an event. Tools and systems for discrete
event simulation are sometimes referred to as “digital
twins”. Digital twins create a complete virtual model
of a physical asset or process, and can be networked
together. Discrete event simulation and digital twins
are not new technology. They have been used for
years to simulate events that are too hard to test
manually (Fishman 1978), such as the impact of heat
or wind speed on a plane (Tuegel 2011). Also, they
are used to simulate entire systems which are
connected by well-defined rules. For example, they
could be used in automobile manufacturing to
determine if there is a cost advantage to a more
expensive paint which dries more quickly (Grieves
2014). This would be based on the capacity of the
additional manufacturing systems to absorb
additional auto capacity more rapidly. There are
many commercial digital twin products available on
the market, as well as open source products such as
Ditto (Glocker 2017) and OMNet++ (Varga 2001)
and SimJava (Howell 1998).
Despite the long history of this technology, it has
become much more mainstream in recent years.
Digital twins were recently identified by Gartner as
one of the ten significant trends of 2017 (Gartner
2017). The reason for this sudden grown is IoT (the
internet of things). As there are more small devices
connected to the network, and so much is known
about these devices and sensors, there is more
opportunity for digital modelling.
Despite the growth of this technology, it has rarely
been applied to healthcare, which is a much less
predictable model. A patient treated quickly and
politely may still decide to leave the hospital against
medical advice. A healthy patient might suddenly
have a totally unexpected aneurism. A patient whose
life was just saved may still be bitter and unsatisfied.
Despite being optimally staffed for a normal Friday
night, any particular Friday night may have an
unforeseeable catastrophe such as a mass shooting or
an earth quake. System-wide predictive analytics in
Predicting Hospital Capacity and Efficiency
563

healthcare is always challenging and discrete event
simulation models are no exception.
The other reason IoT has accelerated the
emergence of digital twin technology is because it
provides real and discrete information. One of the
major drawbacks of the digital twin approach has
always been that it relied on the correct modelling of
the business process. Hospitals and clinicians are
often adapting to emergencies or unusual events and
standardized processes are hard to develop or
monitor. IoT allows us to do things like monitor
actual staff and patient movement, clinical
instrumentation and other true sources of data to infer
business processes and outliers which were
previously hard to realize.
In specific contexts, there has been significant
work on predictive analytics in healthcare. Sutter
Health was able to accurately predict 30 day
readmission rates and leverage the information to
target and reduce readmissions (Ng 2014) (Jamei
2017). Similarily, (Bardhan 2014) was able to predict
readmission for congestive heart failure after analysis
of data from 67 hospitals. Parkland Hospital has been
able to accurately predict daily census and several
hospitals have used similar technology to improve
coding and reimbursement (Bradley 2010). (Maguire
2013) describes a successful predictive data mining
project specific to diabetes. There are countless more
examples, and we have tried to leverage what worked
for them, but they tend to be limited to specific patient
cohorts and single data points. While digital models
for hospitals has been widely discussed, we were
unable to find a successful system-wide project in the
literature.
3 PROPOSED APPROACH
We will detail the implementation plan and phases for
our project in section 5 after describing our specific
requirements in section 4. In this section, we will just
give a quick overview of the approach.
The general approach is to:
1. Extract patient treatment plans from historical
encounters. These treatment plans must separate
what is necessary to heal the patient from what
happened in the historical encounter due to
hospital inefficiency or capacity. We use
biostatistical analysis to transform actual events
into a treatment plan for that patient.
2. Model the resources and allocation rules based
on the business processes of the hospital. This
process will include both interviewing subject
matter experts about the processes and profiling
the historical data to infer and validate the
proposed business rules.
3. Create a discrete event simulation model which
places random patients into the hospital
according to historic trends and then assigns
resources to the patients according to their
treatment plan
4. Collect statistics around the encounters as they
pass through the model hospital.
5. Repeat the randomization many times to
determine both the median values for length of
stay, volume and other KPIs, and also worst and
best case scenarios and the probability of
significant logjams.
Once this is done, this model will support adjusting
the resources and allocation rules, adjusting the
treatment plans, and adjusting the patient flow based
on market analysis and trends. Each of these creates a
what-if scenario analyzed with the same system
above, and multiple changes can be done in the model
together to evaluate an entire proposal.
4 REQUIREMENTS
Before we outline our solution and implementation
plan we need to more clearly identify the
requirements for the system.
4.1 Measures
The following list of measures and KPIs was
identified by our Operational Excellence team. The
goal is that the solution will be able to accurately
predict each of these measures.
▪ Throughput and Volume
» Length of stay (total and in each area)
» Volume (ED, OR, and transfer)
» External transfer acceptance rate
» Isolation patient days/hours
» Census by hour and type
» Discharges by hour
▪ Wait times
» Boarding time (ED, ICU and OR)
» Discharge order to discharge
▪ Utilization and Productivity
» OR utilization
» Staff productivity
» Ancillary utilization including imaging,
labs, pharmacy, telemetry
» Bed Utilization
▪ Finances
» Contribution margin
» Activity based costs
HEALTHINF 2018 - 11th International Conference on Health Informatics
564

» Cost per discharge
▪ Patient and clinical Metrics
» Readmission rate
» Mortality rate
» Wellness scores
» Patient experience scores
Each of these measures we will want to look at by
specific patient cohorts based on diagnosis, payor,
unit, day, time, location, procedure, age, etc.
4.2 Assets and Resources
The goal is that this project support what-if scenario
analysis based on adding or removing resources or
changing schedules. The following is the list of such
resources determined so far:
▪ Beds
There can only be one patient in a bed at a time.
Whether a bed is appropriate for a patient is
based on patient class (inpatient, outpatient,
observation), level of care (such as ICU,
intermediate, acute) and service (specialities
such as cardiology or neurology). ED beds
support combination of acuity and age.
▪ Rooms
Rooms include one or more beds. Multiple beds
in the room can only be filled if the genders and
isolation status of the patients matches. For
example, we cannot place a patient with
clostridium difficile colitis (C. diff) with a patient
who does not, without risking serious harm to the
other patient. Isolation is managed in our system
with specific orders.
▪ Staffing
Staffing includes nurse and physician staffing by
unit, anesthesia staff, pharmacy staff, imaging
staff including technician and radiologists,
housekeeping staff, transport staff, and ancillary
staff including labs and pharmacy. Staffing
volume can be adjusted by hour, unit or location.
▪ Operating Rooms
▪ OR hours
The operating rooms support various volumes of
staffed rooms at different times and days of the
week. Moreover, there are primetime hours set
by day of week and location. Non-emergent
surgeries are delayed until prime hours.
▪ OR service block allocation
Our hospital holds operating rooms for specific
services according to the service block
allocation. This allocation can be changed.
▪ Imaging resources
Imaging devices such as MRI machines can be
added, removed, or given a new schedule.
The way our system works is we first build the list of
resources currently in the hospital using our data
warehouse. Then we set up the rules for allocating
the resources by working with the subject matter
experts in the hospital. Finally, we use our historical
data to validate these business process definitions and
adjust as needed.
Once we have all of the resources and rules, we
can create our model to “lock” these resources by
assigning them to specific patient encounters and
treatment plans. The system closely correlates a
semaphore locking algorithm. Once the model is
built, the user will be able to add or delete resources
or to change the business rules defining which
encounters can use the resources.
4.3 Treatment or Process Adjustment
We would like our solution to support adjusting
specific treatment plans, clinical processes or
operation processes, in addition to adjusting
resources. For example, if we are implementing a
stroke initiative that has been shown to reduce stroke
length of stay by 10% at other hospitals, we can use
our model to predict our measures given that all
stroke patients need 10% less treatment time. If we
have an initiative to write discharge orders or lab
orders earlier in the day, we can analyze the potential
effect of this change, and the appropriate alteration in
staff schedules. If we have a program to reduce red
blood cell transfusions by 50%, we can analyze the
likely effect of this improvement on additional results
such as length of stay, readmissions, hospital-
acquired infection rate, cost, and lab productivity.
4.4 Use Case Examples
In this section we will list example use cases we have
been given as potential questions this solution would
be able to answer.
1. Volume changes. Do we have the capacity
necessary to achieve the annual projections for
growth by service line? Do we have the capacity
necessary to handle the increase expected from
expanded primary care coverage?
2. What-if scenarios:
a. Asset reallocation including bed
assignment, OR hours and staffing
b. Process changes such as increased
transfers to auxiliary hospitals or
reduction in outpatient usage of beds
c. Treatment changes such as reduced
readmissions or performing triage in
waiting rooms
Predicting Hospital Capacity and Efficiency
565

d. Performance improvement such as
reduced OR turnaround times
4.5 Goals
As we look at this vast number of potential measures,
use cases and what-if scenarios, it is important we
focus on the strategic goals. These goals are to
optimally assign resources and create processes that
increase volume and patient satisfaction while
reducing cost, length of stay, readmissions and
mortality.
5 IMPLEMENTATION PLAN
5.1 Phases
This project is broad so our goal is to create a model
that can be expanded throughout several phases.
Phase 1: Proof of Concept
In this phase, we will create the model specific only
to beds and surgeries. We will calculate the volume,
throughput and utilization measures excluding
staffing and block utilization. We will concentrate on
a single use case: What will happen when we
experience growth by service line according to
projections?
Phase 2: Adjusting assets and treatment plans
In this phase we will build on phase 1 by allowing
beds to be reassigned, operating rooms to be added
and treatment plans to be changed. We will focus on
the complex scenario: Predict the measures given that
we reassign X number of beds from the surgical ICU
to the medical ICU, we reduce surgical ICU length of
stay 10% and we open one OR on Saturdays for non-
emergent cases. This shows how scenarios need to
include multiple factors to truly allow what-if
analysis, and the ability of the model to support this.
Phase 3: Adjusting operating room schedules
Currently, some operating rooms are pre-assigned to
specific services on specific days. This is a virtual
floating OR and does not specify the physical room
where the surgery takes place. In this phase, we will
support what-if scenarios where the blocks are
reassigned and we will include the block schedules in
assigning OR rooms and staff to encounters. We will
also add the measure of OR block utilization.
Phase 4: Anesthesia and ancillary staffing
In this phase, we will add measures around staff
productivity, we will include staff capacity in our
model and we will support what-if scenarios of
changing staff levels specific for anesthesia, labs and
images. We are not including nursing or attending
physician staffing to reduce complexity. Nurses are
generally staffed to bed occupancy anyway. To add
staffing to our solution, we will bring in data from
human resources and from the time and attendance
tracking system.
Phase 5: Cost
In this phase we will add cost data to get an
understanding of the financial impact of the what-if
scenarios from the previous phases.
Future Work
In the future, we can see going beyond manual what-
if scenario configuration to an optimization model
where all possible changes are considered and
optimal reassignments are proposed by our AI engine.
5.2 Team
The best opportunity for success in this project comes
from building a diverse team of experts in different
complimentary disciplines. Our team includes data
warehouse architects, statisticians, academic experts,
operational leaders, clinicians and user interface
specialists. Our purpose in detailing the team breakup
is to explain that we do not view this as simply a
technology or IT project. The best opportunity for
success is to create a project directed by the business
which includes clinicians, researchers and academics,
and technologists.
5.3 Technology
We have investigated using both commercial and
open source digital twin products, but instead, our
plan involves leveraging the technology the hospital
already has invested in. This includes Microsoft SQL
Server and an advanced enterprise data warehouse
which will support both calculating the KPIs for the
current environment and providing the historical
patients and treatment plans needed for our model.
This tight integration allows us to continue to support
our enterprise data definitions and “single version of
the truth” in both the actual data warehouse and the
new virtual model. We also utilize Cisco DV, a data
virtualization platform that allows us to quickly
integrate multiple data sources and manage
information independent of physical source. This is
important as we bring in human resource data, cost
information and time and attendance records. Cisco
DV platform can also be used to enhance our system
with auxiliary data such as avoidable delays or
hospital-acquired infections from our epidemiology
HEALTHINF 2018 - 11th International Conference on Health Informatics
566
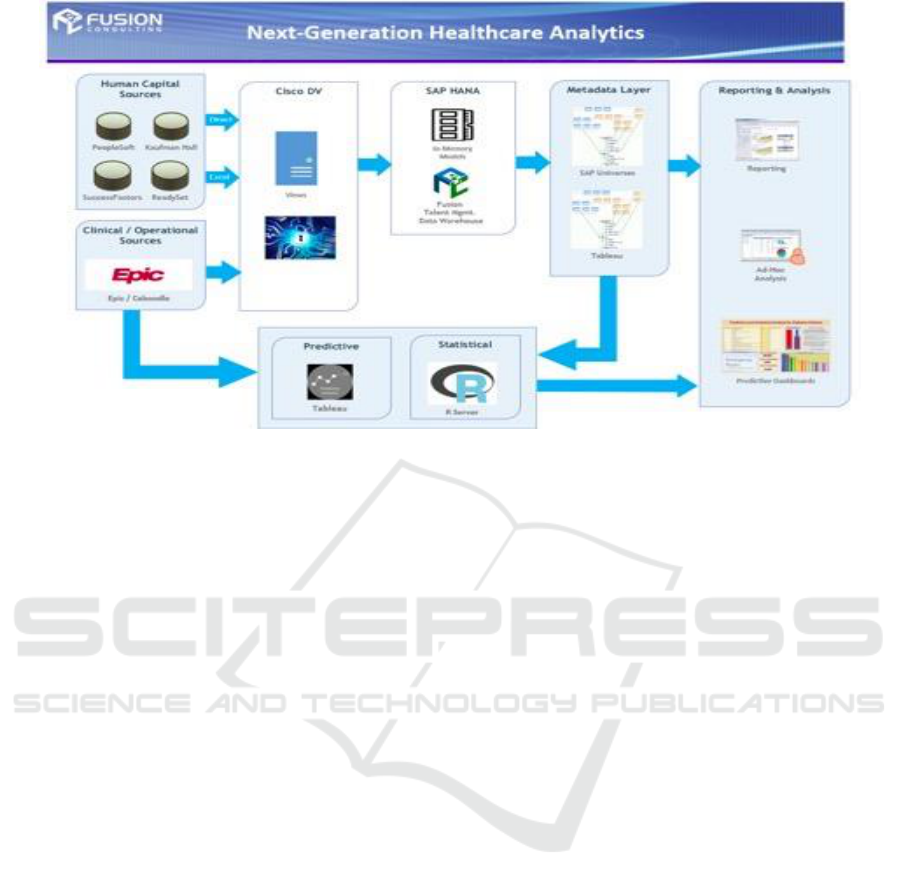
Figure 1: Data analytics system architecture.
system. Additionally, we are leveraging SAP HANA
(Farber 2012), an in-memory data analytics appliance
which will provide exceptional performance and has
a built in predictive analytics library. We are also
using R, an open source language specifically
targeted to advanced statistics and predictive
analytics. System R, originally a IBM product, is an
open source suite of such tools and algorithms.
“R has also been identified by the FDA as suitable
for interpreting data from clinical research.” (Smith
2012) Finally, we are using the dashboard
visualization tool Tableau. Tableau is already in place
at our hospital as the delivery mechanism for
dashboards and data discovery, and it supports both
HANA and R. This allows us to create a common set
of tools, data definitions and interfaces rather than
introducing new technology and learning curves.
Figure 1 shows our system architecture.
5.4 Specific Implementation Plan
In this section, we will detail our implementation
tasks and plan for successful phased execution of this
project.
5.4.1 Calculating the KPIs
For the first phase, we are targeting the KPIs around
discharge, transfer and surgical volume, and around
length of stay, census, bed utilization, isolation and
boarding times. Most of these data points are in the
enterprise data warehouse, but we need to aggregate
them appropriately and add a few fields around the
transfer center and isolation status. It is important that
we have the current and historical state of these
metrics calculated in a way that is accurate and uses
matching patient cohorts. This allows us both to
compare our what-if scenarios to current state, and,
very importantly, to test our predictive model.
5.4.2 Data Preparation
We need to create our historical patient encounters.
We do this as a multiple stage process. First, we
extract from our data warehouse and build an event
log for each hospital encounter. This log includes
timing information concerning all patient movement.
This will include arrival and triage time, each bed
movement, each order which changes the patient’s
status or level of care, each level of care or service
change, and the admit and discharge orders.
Additionaly,l we add events surrounding surgeries:
when they were scheduled, when they were
performed, how long they took, etc.
We then use our statistical tools and
biostatisticians expertise to convert our historical
event logs to treatment plans. For example, consider
a patient who spent 1 day in inpatient ICU status, but
physically still in the ED and two days in ICU status
in a ICU bed. Does their treatment require two days
of ICU care or three? The answer is probably
somewhere in between because they were receiving
care while in boarder status in the ED, but not the
same care as they would have received in the ICU.
The goal of the statistics in this phase is to determine
the relationship of boarder time to length of stay.
Predicting Hospital Capacity and Efficiency
567

Once we have this information, we store with each
historical encounter a mini treatment plan.
5.4.3 Modeling the Assets
For phase 1, the assets we care about are limited to
just beds and operating rooms. For each bed outside
of ED, we generate a bridge table which shows every
class/service/level-of-care combination supported by
that bed. We also map the beds to rooms (which is
already in the data warehouse). Now we have a list
of resources which we can use to support events on
our encounters and mini treatment plan.
It is also interesting to note that our hospital has
reassigned or added these bed resources in the past.
We load this information as type-2 historical
information using standard data warehousing
methodology. This allows us to view our historical
records in context and more accurately extract
appropriate treatment plans. Also, because we have
past change scenarios and actual results, we have real
and meaningful data and situations available for us to
validate our prediction model.
For ED, we have six types of beds: rapid intake,
adult, express care, pediatric, diagnostic and surgery.
ED is modelled somewhat differently. The only
deciding factor are acuity, age, and time of day
(express care is not open 24 hours a day).
For operating rooms, we load the list of operating
rooms/locations, the prime time hours and the staffed
hours for emergent cases. We are not concerned with
service block schedules in the first two phases.
5.4.4 Building the Allocation Agent
We build a set of coded procedures which support the
treatment plan of patient encounters by:
▪ Assigning the patient to an appropriate bed when
they are in boarder or waiting room status
▪ Adding a hold to the other bed in a room (based
on gender and isolation status)
▪ Moving patients around to support holds (for
example if two males are in separate rooms with
empty beds in a unit and a female needs a beds,
the males can be moved together)
▪ Assigning an operating room based upon the
schedule request and executing a surgery
5.4.5 Additional Statistics
We calculate additional statistics to support our
model. These include:
▪ Histograms which tell us how many patients
to expect at specific times
This allows us to more accurately feed
patients into our predictive model.
▪ Transfer center statistics to show us the
relationship between the wait time for
approval and the cancellation rate
This will allow us to predict transfer volume
and acceptance rate.
▪ ED statistics to show us the relationship
between delays in treatment and patients
leaving prematurely
This will allow us to predict how many
patients will leave prematurely based upon
the predicted waiting times.
▪ Discharge processing statistics to show us
the relationship between discharge order
times and volume to actual discharge times.
This will allow us to predict when a patient
will actually be discharged in relationship to
when the discharge order was written.
5.4.6 Virtual Model Execution
To execute our model, we place patients in the
hospital (via ED arrival, direct admit or transfer
request) according to our histograms from the
statistical analysis. We then loop every “15 minutes”
on our virtual clock and add new patients, discharge
patients, and attempt to move patients according to
their treatment plan. At any point in time, a patient is
either in appropriate status or boarder status. For
example if the treatment plan says the patient needs 3
days in ICU and they are currently assigned an ICU
bed and have only been in ICU one day in our virtual
system, they are appropriately placed and we will not
attempt to move them during this time loop. If they
are in intermediate level of care according to their
treatment team, but they are in that same ICU bed, we
will attempt to assign them an intermediate bed. If
we are able to do so, we will release the ICU bed.
Each time a patient leaves the hospital in our virtual
model, we record statistics about their encounter to
match our KPIs.
The priority order we assign patients to beds is
very important in our model execution. We will use
business rules that define which types of patients it is
most important to place first.
We load our patients completely randomly. We
take a number between 0 and 1 and multiply it by our
number of patient encounter treatment plans to
choose one. To make up for this randomization, we
run the same patients through with different random
variations thousands of times to calculate the median
KPI values and the histogram of each measure. This
allows us to not only predict the measures but also
HEALTHINF 2018 - 11th International Conference on Health Informatics
568

show where the potential for challenges or logjams is.
For example, it is possible that a given scenario
reduces length of stay on average, but has a greater
chance of increasing length of stay during stress
situations (high volume fluctuations).
5.4.7 What if Scenarios
The scenario we are supporting for Phase 1 simply
involves adjusting the patient encounters according to
given growth projections by service line. We can
achieve this with our statistics which define patient
encounters to add to the virtual hospital model.
For phase 2, we support three types of
adjustments: beds (add/delete/reallocate), operating
rooms (add/delete/change hours) and treatment plan.
Our system will allow the user to set up a
scenario. They can remove any bed in the system.
They can add a bed and define the class/level of
care/service combinations the new bed supports.
They can also specify rules for adjusting patient
treatment plans, such as reduce ICU length of stay for
all sepsis patients by 10%.
5.4.8 Testing
Before we use our model to make decisions, it is
obviously important to be certain our predictions are
accurate. To achieve this our plan is to use a
traditional training and testing process. We will train
using historical data from encounters 6-24 months
ago and then test by attempting to accurately predict
the last 6 months for the hospital.
Additionally we will use past changes for testing
purposes. Consider if 6 months ago our hospital
added 5 beds to the adult medical ICU. We could
train the system with encounters before 6 months ago,
then set up a what-if scenario where these 5 beds are
added. We use the predictive engine to predict the
resulting volumes and length of stay, and test these
predictions against our last 6 months of actual
hospital statistics.
6 CONCLUSIONS
We have proposed a staged solution to allow
hospitals to create “what-if scenarios” and predict
system results from such scenarios over a large
number of important measures. We have created an
achievable, targeted plan which delivers value in each
of several short phases as it builds the entire model.
Our model leverages the EMR and enterprise data
warehouse, well-known data mining techniques and
bio-statistical algorithms. It uses biostatistics,
discrete event simulation and business process
modelling in tandem. It is achievable, measurable
and flexible. We believe it will create a solid
foundation for predictive analytics for our hospital
system.
REFERENCES
Glocker, G., Jaekle, T., 2017. Eclipse Ditto. Viewed
August 2017. https://projects.eclipse.org/proposals/
eclipse-ditto.
Tuegel, E. J., Ingraffea, A. R., Eason, T. G. and
Spottswood, S. M., 2011. Reengineering aircraft
structural life prediction using a digital twin.
International Journal of Aerospace Engineering, 2011.
Grieves, M., 2014. Digital twin: Manufacturing excellence
through virtual factory replication. White paper.
Fishman, G. S., 1978. Principles of discrete event
simulation.
Varga, A., 2001. Discrete event simulation system. In Proc.
of the European Simulation Multiconference
(ESM'2001).
Howell, F. and McNab, R., 1998. SimJava: A discrete event
simulation library for java. Simulation Series, 30,
pp.51-56.
Jun, J.B., Jacobson, S.H. and Swisher, J.R., 1999.
Application of discrete-event simulation in health care
clinics: A survey. Journal of the operational research
society, pp.109-123.
Ng, K., Ghoting, A., Steinhubl, S.R., Stewart, W.F., Malin,
B. and Sun, J., 2014. PARAMO: a PARAllel predictive
MOdeling platform for healthcare analytic research
using electronic health records. Journal of biomedical
informatics, 48, pp.160-170.
Jamei, M., Nisnevich, A., Wetchler, E., Sudat, S. and Liu,
E., 2017. Predicting all-cause risk of 30-day hospital
readmission using artificial neural networks. PloS one,
12(7).
Bardhan, I., Oh, J. H., Zheng, Z. and Kirksey, K., 2014.
Predictive analytics for readmission of patients with
congestive heart failure. Information Systems Research,
26(1), pp.19-39.
Bradley, P. and Kaplan, J., 2010. Turning hospital data into
dollars: healthcare financial executives can use
predictive analytics to enhance their ability to capture
charges and identify underpayments. Healthcare
Financial Management, 64(2), pp.64-69.
Maguire, J. and Dhar, V., 2013. Comparative effectiveness
for oral anti-diabetic treatments among newly
diagnosed type 2 diabetics: data-driven predictive
analytics in healthcare. Health Systems, 2(2), pp.73-92.
Gartner, 2017. Gartner’s Top 10 Strategic Technology
Trends for 2017. http://www.gartner.com/smarterwith
gartner/gartners-top-10-technology-trends-2017/.
Färber, F., May, N., Lehner, W., Große, P., Müller, I.,
Rauhe, H. and Dees, J., 2012. The SAP HANA
Predicting Hospital Capacity and Efficiency
569

Database--An Architecture Overview. IEEE Data Eng.
Bull., 35(1), pp.28-33.
McGlothlin, J., Crawford, E., Srinivasan, H., Cianci, C.,
Bruneau, B., and Dorotta, I., 2017. Reducing Red Blood
Cell Transfusions. In Information Technology in Bio-
and Medical Informatics, pp. 120-133.
Smith, D. 2012. FDA: R OK for drug trials.Viewed October
2017. http://blog.revolutionanalytics.com/2012/06/fda-
r-ok.html
HEALTHINF 2018 - 11th International Conference on Health Informatics
570
