
Analyzing Urban Mobility Carbon Footprint with
Large-scale, Agent-based Simulation
Eduardo Felipe Zambom Santana
1
, Lucas Kanashiro
1
, Diego Bogado Tomasiello
2
,
Fabio Kon
1
and Mariana Giannotti
2
1
Department of Computer Science, University of S
˜
ao Paulo, Brazil
2
Department of Transportation Engineering, Polytechnic School, University of S
˜
ao Paulo, Brazil
Keywords:
Smart Cities, Urban Mobility, Simulation, Carbon Footprint.
Abstract:
The growth of cities around the world bring new challenges to urban management and planning. Tools, such
as simulators, can help the decision-making process by enabling the understanding of the current situation of
the city and comparison of multiple scenarios with regard to changes in the urban infrastructure and in public
policy. This paper presents an analysis of mobility parameters, such as distance, cost, travel time, and carbon
footprint, for different simulated scenarios in a large metropolis in a developing country. We simulated the
scenarios using an open source, large-scale, agent-based Smart City simulator that we developed.
1 INTRODUCTION
Most large cities around the world, especially in de-
veloping countries, have significant problems with re-
gard to the mobility of their inhabitants; normally,
the low-income populations in underprivileged neigh-
bourhoods are the ones that suffer the most. A valid
approach to tackle this problem is the idea of Smart
Cities, that proposes, among other things, the use of
Information and Communication Technologies (ICT)
to improve the quality of life and sustainability in
cities.
On the one hand, intelligent information systems
working in conjunction with the city infrastructure
can provide applications based on the collection and
analysis of real-time data offering services to the pop-
ulation and city servants to mitigate mobility diffi-
culties. On the other hand, planning and decision-
support tools can help city managers take better deci-
sions in the long run and design more effective public
policies. Simulators can be a valuable tool for un-
derstanding the behavior of the city and analyzing the
impact of changes in the city infrastructure and public
policies.
A simulation can show to city planners the be-
haviour and dynamics of the city in different hypo-
thetical scenarios. For example, a servant working in
the Transportation Secretariat could simulate the im-
pact of building different subway lines across the city
or the impact of locating subway stations in different
places. A servant working in the Health Secretariat
could simulate the impact of changing the medical
specialties offered in a certain city hospital. Well-
designed simulations can be instrumental in planning
changes in the mobility infrastructure and in govern-
ment actions, enabling informed decision-making.
The work presented here involves a case study in
using a large-scale, agent-based traffic simulator to
analyze the impact of a new subway line under con-
struction in S
˜
ao Paulo, Brazil. We examined four sim-
ulated scenarios based on an origin-destination survey
and compared their travel time, financial cost, and car-
bon footprint of the simulated population. We based
all the scenarios on realistic changes that might occur
with the new subway line. In this study, we consid-
ered the inhabitants of a large slum in the city that
will be potentially benefited by this new subway line.
We chose to compare the travel time and cost,
which can impact positively on the population qual-
ity of life. The carbon footprint can help the an-
alyzes of the city sustainability, measuring the im-
pact of each transportation mode. Normally, the car-
bon footprint is measured by the traveled distance
multiplied by a constant number based on the trans-
portation mode. After studying several carbon foot-
print models (Kenny and Gray, 2009), we choose one
that is well-detailed (Chester and Horvath, 2008) and
have already an implemented version (Shankari et al.,
Santana, E., Kanashiro, L., Bogado Tomasiello, D., Kon, F. and Giannotti, M.
Analyzing Urban Mobility Carbon Footprint with Large-scale, Agent-based Simulation.
DOI: 10.5220/0006662201430150
In Proceedings of the 7th International Conference on Smart Cities and Green ICT Systems (SMARTGREENS 2018), pages 143-150
ISBN: 978-989-758-292-9
Copyright
c
2019 by SCITEPRESS – Science and Technology Publications, Lda. All rights reserved
143

2014).
This paper is organized as follows. Section 2
presents related work in Smart Cities, Transportation,
and Agent-Based Simulators. Section 3 describes the
simulated scenarios and the data used in their model-
ing. Section 4 describes the tool used to simulate the
scenarios. Section 5 presents the data collected and
analyzed from the simulation, it also discusses the re-
sults of the analyses. Finally, Section 6 addresses our
conclusions and future work.
2 RELATED WORK
We now present some of the most relevant work re-
lated to our research, separating them in the Smart
Cities, Transportation, and Agent-Based Simulation
areas.
2.1 Smart Cities
“Smart City” has been widely and variously defined.
Some definitions exceed the software context, focus-
ing only on social or business aspects. Regarding soft-
ware systems, many authors describe a Smart City as
the integration of social, physical, and IT infrastruc-
tures to improve the quality of city services (Caragliu
et al., 2011). Other authors focus on a set of Infor-
mation and Communication Technology (ICT) tools
used to create an integrated Smart City environment
(Santana et al., 2017a; Washburn et al., 2009).
(Giffinger et al., 2007) assert that a Smart City has
six main dimensions: smart economy, smart people,
smart governance, smart mobility, smart environment,
and smart living. Many authors adopt this definition
(Hern
´
andez-Mu
˜
noz et al., 2011). In our work, we fo-
cus on two dimensions: smart governance and smart
mobility.
Smart Governance is related to a better manage-
ment of cities by using tools to improve the planning
of governmental initiatives such as modifications in
the infrastructure and public policies. Smart Mobility
is related to actions that facilitate the movement of the
population within the city. Both dimensions can ben-
efit from the use of simulators. For example, allowing
the understanding of the current traffic conditions and
the impacts of changes in the infrastructure and the
behavior of citizens.
There are many works proposing tools to facili-
tate the management of Smart Mobility actions. For
example, (Schnemann, 2011) presents a platform to
simulate vehicular networks with Intelligent Trans-
portation Systems (ITS), testing and experimenting
with current and future mobility scenarios. (Benevolo
et al., 2016) relate different smart mobility initiatives,
including the use of tools to facilitate the planning,
implementation, and evaluation of integrated mobil-
ity initiatives.
2.2 Transportation
The transportation systems in developing countries
metropolis share several problems. Most of them are
related to the sudden increase in the urban popula-
tion, poor land use and transport policy, and relatively
small investments in transport infrastructure (Pucher
et al., 2005).
A common consequence of the poor public trans-
port infrastructure is the mass migration to the motor-
ized private transport, which is the root of other prob-
lems like traffic congestion, air pollution, and traffic
accidents (Salon and Gulyani, 2010).
When it comes to slums in developing countries,
all the problems are enlarged. According to (Car-
ruthers et al., 2005), the main issues faced by low-
income populations in developing countries are the
long trips and travel times, lack of fare system integra-
tion, and lack of public transit supply in the outskirts
of municipalities.
Mass public transport infrastructure like metro
systems is rarely designed to serve low-income neigh-
borhoods due to the need for subsidies to make fares
cost-effective (Gwilliam, 2003). However, studies
conducted by (Zegras, 2010), identified that higher
urban density areas located close to metro stations are
related to a lower number of kilometers traveled by
vehicles, decreasing air pollution and, consequently,
the carbon footprint.
The analysis of the impact of mass public trans-
port infrastructure for the population with respect to
travel distance, travel time, and air pollution is vital
to anticipate if the investments are going to be effec-
tive, bringing real benefits to citizens. Agent-based
simulation is one of the tools to help decision makers
in this matter.
2.3 Agent-based Traffic Simulation
Agent-Based simulation is widely used to model traf-
fic scenarios (Bazzan and Kl
¨
ugl, 2014). An example
is MATSim (Horni et al., 2016), a mesoscopic multi-
agent traffic simulator. In this simulator, each person
is modeled as an agent that can move around the city.
MATSim uses a queue model to simulate the traffic
using the flow and storage capacity of each link to cal-
culate the speed of the vehicles. MATSim was used
to simulate many city scenarios such as taxi optimiza-
tion (Maciejewski and Nagel, 2013), freight traffic
SMARTGREENS 2018 - 7th International Conference on Smart Cities and Green ICT Systems
144
(Zilske et al., 2012), and autonomous cars (Bischoff
and Maciejewski, 2016).
SUMO (Behrisch et al., 2011) is a microscopic
traffic simulator that also simulates each agent indi-
vidually. The difference is that SUMO uses a Car-
Following model (Tang et al., 2014) to simulate the
traffic flow. In this simulation type, car speed is calcu-
lated considering the vehicles ahead. Usually, micro-
scopic simulators are more detailed. However, they
have a high computational cost and are not suitable
for the simulation of a large metropolitan area with
millions of agents.
(Song et al., 2017) present a mesoscopic traf-
fic simulator based for GPUs (Graphical Processing
Unit). Its aim is to use the processing power of GPUs
to speed up the execution of large-scale traffic scenar-
ios. The results presented in the paper showed a two
times improvement in the execution time of the sim-
ulation compared to a standard C++ implementation
of the simulator. However, the authors describe two
main problems in using GPUs: the communication
of the CPU and the GPU is a bottleneck to the sim-
ulation and the amount of memory of the GPU can
significantly limit the size of the simulated scenario.
Many academic and city management projects use
the simulators mentioned in this section. However,
none of them is suitable for the simulation of an entire
day of a large metropolis with several million users in
multiple modes of transportation such as cars, sub-
ways, trains, buses, bicycles, and pedestrian. There-
fore, in our work, we implemented a flexible and pow-
erful smart city simulator, capable of simulating more
than ten million agents using multimodal trips. This
simulator will be presented in Section 4.
3 SCENARIO DESCRIPTION
The area of interest is Parais
´
opolis, a large slum in
S
˜
ao Paulo with a population of approximately 50
thousand people. Besides several specific character-
istics, this slum differs from others mainly because
of its location. While most of the slums of the city
are on the periphery, this one is located in a central
area, making access to transport and other services
less costly.
The mobility characteristics of the analyzed pop-
ulation is changing dramatically in the last decades.
The motorization ratio is increasing rapidly. In 2007,
the number of motorized trips was only 10%, while in
2011 it raised to 33%.
In the future, the mobility of the slum region might
change with the governmental plan to build two new
subway stations that are going to connect the slum to
other four metro lines and several bus corridors of the
city.
Due to the changes in the public transport offer
in the next years, the importance of simulating trans-
port scenarios considering different modal splits and
its impacts in carbon footprint, travel time, and travel
cost is essential to understand the implications of the
new transport infrastructure.
3.1 Collected Data
We based our simulation in real data collected from
different sources. The databases considered in the pa-
per are:
• Origin-Destination (OD) Matrix derived from a
survey conducted by the city subway company for
the year 2007
1
• Shapefile of the planned Subway Lines
• Map of the city based on OpenStreetMaps
2
• Transit lines and stops for S
˜
ao Paulo
The origin-destination database provided the in-
formation of all the trips originated in the slum. Each
trip has the origin, destination, travel mode, and start
time. As the trips are the most important data for the
simulation, we made a exploratory analyses of this
data.
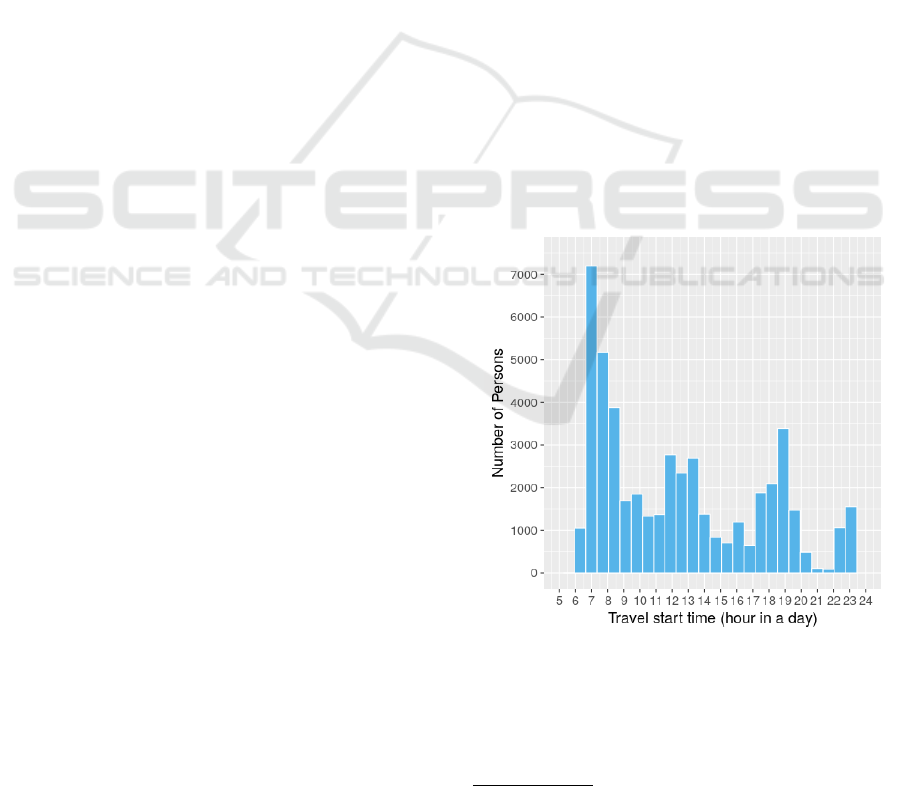
Figure 1: Travel Start Time.
Figure 1 presents the distribution of the trips by
the start time across the day. The figure shows that
most of the trips occur in the morning, when people
leave to work. Changing the morning trips from cars
1
Origin-Destination Survay - http://goo.gl/Te2SX7
2
OpenStreetMap - https://www.openstreetmap.org
Analyzing Urban Mobility Carbon Footprint with Large-scale, Agent-based Simulation
145
or buses to subway can improve the traffic and avoid
the overcrowded buses. Also, there is a significant
number of late night travels, the new line can benefit
the bus users because the interval between the buses
in the night are much larger than during the day.
3.2 Data Preparation
Based on the panorama described in the last sec-
tion, we created four simulation scenarios to com-
pare changes in the modal split considering the new
proposed subway line. To create these scenarios, we
changed the travel mode of the people that work and
live near a metro station from bus or car to subway.
The description of the new scenarios is the following:
Current Scenario: we used the current data of the
OD matrix considering the travel mode, the start
time of the travel, the origin, and the destination of
each person. We used the current subway network
of the city.
Replace Buses: we added the new line in the sub-
way network of the city and changed the travel
mode of the population that used buses in the OD
matrix to subway if the person lives and works
less than 500 meters from a subway station.
Replace Cars: we added the new line in the sub-
way network of the city and changed the mode of
transportation of all trips that use cars to subway
if the person lives and works less than 500 meters
from a subway station.
Replace Both: we combined the scenario 2 and 3,
changing all the trips to subway if the person lives
and works less than 500 meters from a subway
station.
In all scenarios, we did not change the mode of
the trips with less than 2 kilometers because it is un-
likely that a person that has the origin and destination
very close will use the subway. Table 1 presents the
travel mode of all the simulated population. All the
scenarios have the same population. Hence the to-
tal population is the same in all simulations, only the
travel mode of a subset of the people changes from
one scenario to the other.
Table 1 shows that, with the new line, 9877 peo-
ple can change their transportation mode, 20% of the
total. Of this people, 5004 are car users, indicating a
potential to improve the traffic in the region and de-
crease the pollution emission. The other 4873 people
are bus users, which can potentially reflect in a reduc-
tion of travel time and improvement of quality of life.
From Scenario 1 to Scenario 3 the number of bus
lines required to serve the simulated population also
reduced from 54 lines to 45, what can indicate that
Table 1: Modal-split of the simulated population.
Current Scenario
Replace Buses
Replace Cars
Replace Both
Car 8,867 8,867 3,863 3,863
Walk 21,373 21,373 21,373 21,373
Subway 168 5,041 5,172 10,045
Bus 17,785 12,912 17,785 12,912
Total 48,193 48,193 48,193 48,193
some lines can have their route changed or eliminated.
We created this four scenarios to compare the impact
of changing each travel mode and then the impact of
changing all the potential population.
3.3 Simulation Research Questions
With the data collected from the simulation of the four
scenarios, we can compare the different situations and
compute several metrics to evaluate the impacts of
changes in the modal split of the population. The
research questions explored in the study are related
to the impact of the new subway stations and sub-
way line for the analyzed population with regard to
travel time and travel cost and the impact in the city
measured in terms of carbon footprint. The research
questions are:
RQ1: “What is the impact of a new subway line in
the travel time of its potential users?”
RQ2: “How the new line will impact the cost of the
transportation to the population?”
RQ3: “If the potential users change its transportation
mode, will it have an environmental impact?”
Section 5 will present the answers to these re-
search questions based on the data from the simula-
tion of the scenarios.
4 SIMULATION
In this section, we present our agent-based, smart city
simulator, the execution of the scenarios presented in
the previous section and a brief description of the re-
sults of the simulation.
SMARTGREENS 2018 - 7th International Conference on Smart Cities and Green ICT Systems
146

4.1 Large-Scale Smart City Simulation
We developed InterSCSimulator, an open-source,
scalable, mesoscopic, agent-based Smart City simu-
lator capable of simulating millions of actors faster
than real-time (Santana et al., 2017b). In previous
experiments, we could simulate more than four mil-
lion agents in a 24 hours simulation in approximately
3 hours. The current version of the simulator is capa-
ble of running single and multi-modal trips using cars,
buses, subway, and pedestrian as the travel mode.
The simulator expects, as input, four XML files
describing the simulated scenario. We create these
files based on the databases described in Section 3.1,
and we describe them in the following:
subway.xml defines the city subway system. In this
file, each station is a vertex, and the connection of
two stations are the links of the graph.
map.xml describes the city road network graph. In
this file, each road stretch is a link, and the corners
are the vertices of a graph. We used the map from
Open Street Maps to generate this file.
buses.xml lists all the bus lines of the city. Each line
must have a code, the time in which the service
starts and ends, all its bus stops, and the inter-bus
interval of the line.
trips.xml contains all the trips that must be simu-
lated. The trips must have the time that it will
start, the transportation mode, the origin, and the
destination.
Listing 1 presents, as an example, a file with two
trips that will be simulated, each one with a different
transportation mode. In the file, there are two trips; in
the first one, the travel mode is car, in the second, bus.
When the travel mode is subway or bus, the person
must walk from the origin to a bus stop or a subway
station and then walk from another bus or subway sta-
tion to the final destination.
Listing 1: XML file with examples of trips.
< t r i p o r i g i n = ” 4197294783 ”
d e s t i n a t i o n =” 28637975 ”
s t a r t =” 27601 ” mode=” c a r ” />
< t r i p o r i g i n = ” 2197654483 ”
d e s t i n a t i o n =” 284356975 ”
s t a r t =” 27651 ” mode=” walk ” />
< t r i p o r i g i n = ” 1740921857 ”
d e s t i n a t i o n =” 1107272621 ”
l i n e =” 8020−10−0 ” mode=” bus ” />
< t r i p o r i g i n = ” 1107272621 ”
d e s t i n a t i o n =” 304693626 ”
mode=” walk ” />
< / m u l t i t r i p>
In Listing 1, origin and destination are nodes in the
city graph, start is the time that the agent must start its
travel, mode is the travel mode of the agent, and line
is the bus line that the agent will use. The simulator
is generic and can work with the infrastructure of any
city in the world, just requiring the generation of all
input files of the simulator.
4.2 Scenario Execution
To analyze the impact of changes in the city infras-
tructure, we executed the four scenarios described in
Section 3. We also created traffic in the city graph
based on the complete OD matrix of the city; we sim-
ulated 1.2 million cars, which lead to realistic traffic
conditions and, thus, realistic travel times for the car
trips. We executed all the scenarios in a 24-core ma-
chine with 54 GB of memory in the Google Comput-
ing Engine
3
, and all of them took less than one hour
to execute an entire day in the city.
The agent execution depends on its mode of trans-
portation. We describe the types of execution of each
mode in the following:
Car: we start by computing the shortest path be-
tween the origin and destination and then make
the agent traverse the city graph visiting all links
of the calculated path. A density function is used
to calculate the speed of the car in each link (Song
et al., 2017) based on the number of vehicles (cars
and buses) in the link in each instant.
Bus: traveling by bus, the agent walks to a bus stop
and can take one or more buses until a bus stop
close to its destination.
Subway: the agent walks to the nearest subway sta-
tion; the subway trip duration is computed with
the best path algorithm considering the travel time
between the stations. After leaving the subway,
the agent proceeds its journey by bus or walking.
Walk: the agent uses the same idea of the car trips,
the difference is that the speed is approximately 4
Km/h.
The agents can also make multimodal trips, com-
bining walking, bus, and subway. Using a car and an-
other modal in a single trip is indeed possible. How-
ever, in the OD data that we have, there were no such
cases. In addition to computing specific metrics de-
fined by the user, the simulator can also present a
graphical visualization of the simulation with the help
of the MATSim OTFVis tool
4
. Figure 2 presents the
3
Google Computing Engine – http://cloud.google.com/
compute/
4
OTFVis – http://goo.gl/U8a87g
Analyzing Urban Mobility Carbon Footprint with Large-scale, Agent-based Simulation
147
execution of the simulation in the city graph. The
green points are agents moving across the city.
Figure 2: Simulation visualization.
4.3 Results
The simulator saves an XML output file with all the
agent actions. There are four possible actions: 1)
When the agent starts its trip, 2) when the agent leaves
a link, 3) when the agent enters a link, and 4) when
the agent arrives to its final destination. All actions
have the time, the location where it occurred, and the
mode of transportation that the agent used. Listing 2
presents a sample output of the simulator with arrivals
actions.
Listing 2: XML file with the output of the simulator.
< e v e n t t i m e =” 22400 ” t y p e =” a r r i v a l ”
p e r s o n = ” 120 ” legMode=” walk ”
t r i p t i m e =” 420 ” d i s t =” 450 ”
c o s t =” 0 ” />
< e v e n t t i m e =” 27860 ” t y p e =” a r r i v a l ”
p e r s o n = ” 122 ” legMode=” c a r ”
t r i p t i m e =” 1820 ” d i s t =” 4210 ”
c o s t =” 6 . 8 ” />
< e v e n t t i m e =” 29504 ” t y p e =” a r r i v a l ”
p e r s o n = ” 123 ” legMode=” bus ”
t r i p t i m e =” 1828 ” d i s t =” 3500 ”
c o s t =” 3 . 8 ” />
When the agent arrives to its destination, the sim-
ulator computes the attributes of the trip such as total
time, distance, and cost. This output can be used to
generate the visualization of the simulation presented
in Figure 2 and to make analyzes in a statistical tool
such as R.
5 ANALYSIS AND DISCUSSION
We analyzed the change impact in three different per-
spectives: financial cost for the users, travel duration,
and the carbon footprint. The objective of this anal-
ysis is to answer the research questions presented in
Section 3.3.
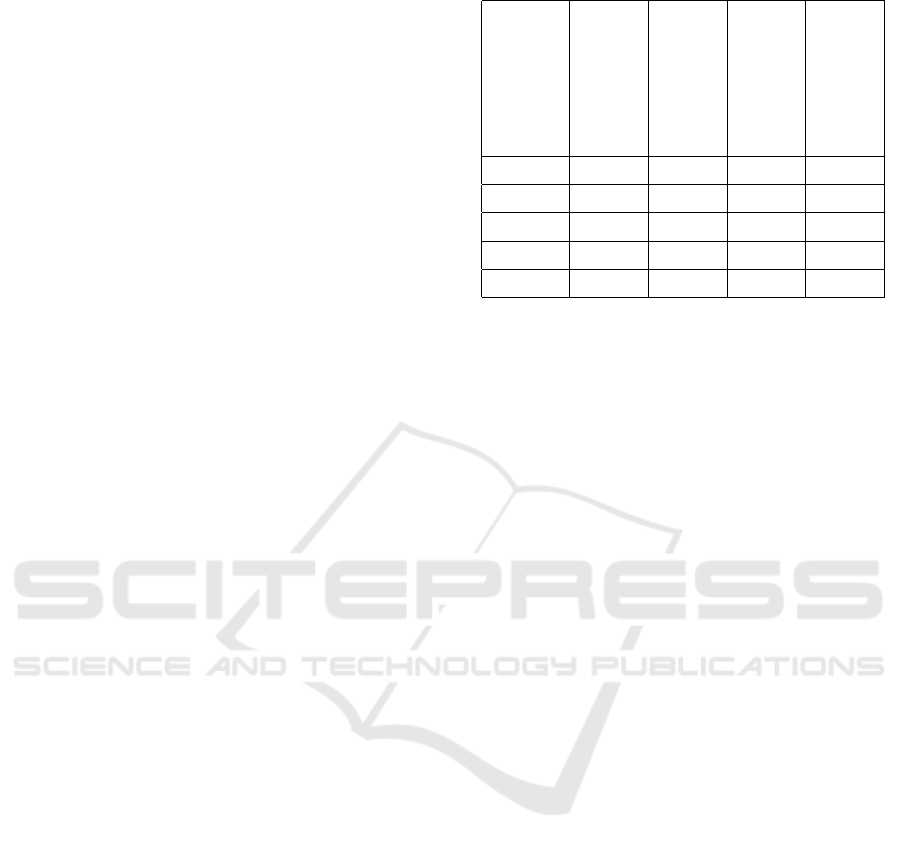
To answer RQ 1, “What is the impact of a new
subway line in the travel time of its potential users?”,
we calculated the travel time for each person in all
scenarios presented in Section 3. The time users
spend on a trip directly impacts the users’ perception
of the quality of the transportation system and qual-
ity of life. As Figure 3 presents, the travel time of
most of the population decreased, mainly for the bus
users (depicted in orange in Figure 3). For 4500 peo-
ple, i.e., 90% of the people who changed from bus to
subway, their travel time reduced significantly. For in-
stance, 30.84% of buses users that started to use sub-
way had an improvement up to 30 minutes. Moreover,
7.14% of these buses users improved their travel time
for more than 2 hours.
From the population that used cars in the original
scenario, approximately 1,500 had their travel times
decreased and 4,000 had their travel times increased.
The people that had their travel time increased by
more than 30 minutes (around 2,000 people) are un-
likely to change their travel mode. However, since the
cost reduction can be very substantial (mainly when
taking into consideration parking fees), even some of
them might prefer the subway.
Figure 3: Travel time improvement.
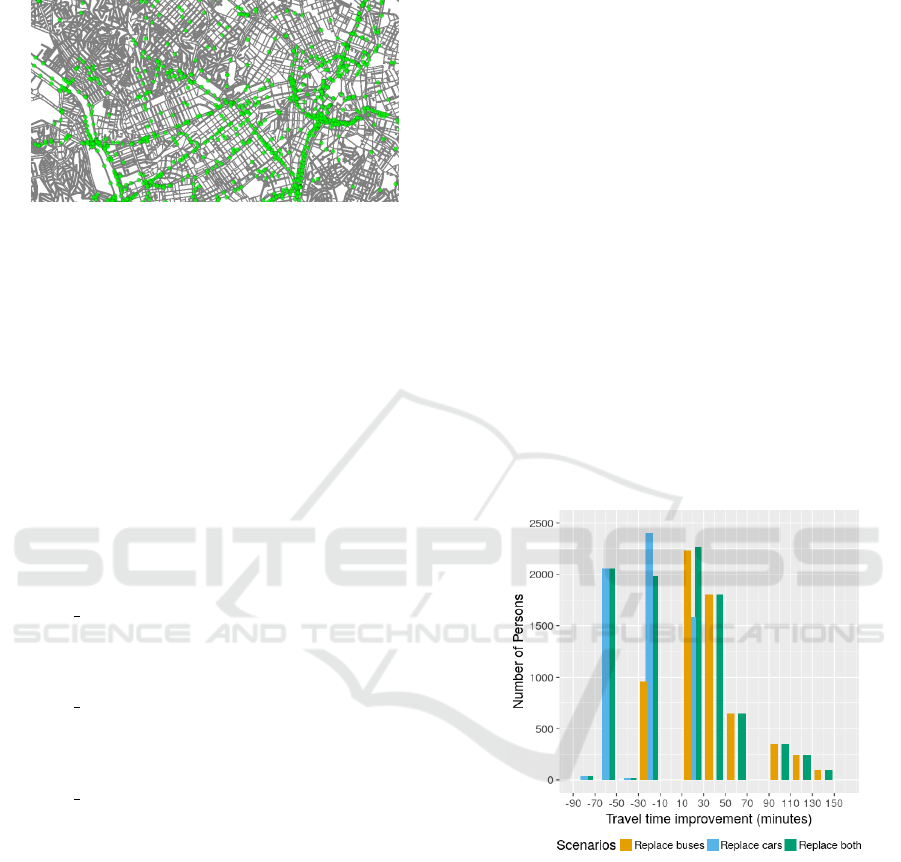
To answer RQ 2, “How the new line will impact
the cost of the transportation to the population?”, We
calculated the trip financial cost for each person in all
scenarios presented in Section 3 since users usually
want the cheapest option with a good travel condition.
In our analysis, we took into account the car trip costs,
as well as bus and subway fares. Using the OECD
Purchasing power parities (PPP), the cost of the bus
and subway fares was 1.9 USD and the car cost was
0.35 USD per kilometer.
As Figure 4 shows, the creation of this new sub-
way line would reduce the cost for more than 2,500
SMARTGREENS 2018 - 7th International Conference on Smart Cities and Green ICT Systems
148
people in the neighborhood that changed the mode
of transportation from car to the subway. This is es-
pecially important because we are simulating a low-
income community. The financial costs of trips made
by bus or by subway did not change because the price
of the two systems is the same in the analyzed city.
Figure 4: Financial cost benefit.
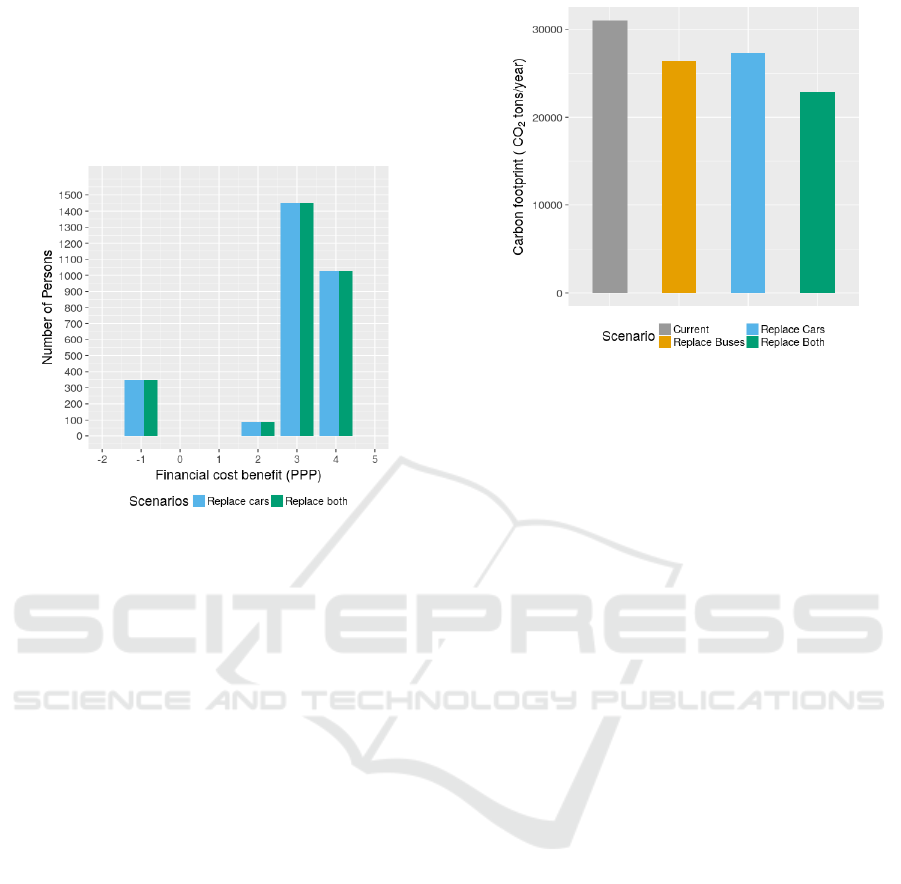
To answer RQ 3, “If the potential users change
its transportation mode, will it have an environmental
impact?” we calculated the carbon footprint of each
person in all scenarios presented in Section 3. The
common baseline is that the carbon footprint stands
for a certain amount of gaseous emissions that are rel-
evant to climate change and associated with human
production or consumption activities (Wiedmann and
Minx, 2007). By analyzing Figure 5, we can notice
that in the “Replace Both” scenario the carbon foot-
print would be reduced from 30,992 tons of CO
2
per
year to 22,790, i.e., 26%. The reason that the change
to the subway decreases the carbon footprint is that
cars and buses emit over three times more CO
2
to the
atmosphere than the subway.
In short, if the bus users start to use this new sub-
way line, they would reduce their travel time and car-
bon footprint, while still paying the same fare. How-
ever, the car users would reduce their financial cost
and carbon footprint but increase their travel time.
Thus, with this new subway line, some of the bus
users would definitely migrate to the subway because
of the reduction in travel time. However, most car
users would need to choose between a shorter travel
time or a reduced financial cost. Indeed, decision
makers should promote the usage of this new subway
line, since it would decrease both the carbon footprint
and the economic cost for the population as well as
improve traffic in the region.
Figure 5: Accumulated Carbon Footprint.
6 CONCLUSIONS AND FUTURE
WORK
The growth of the cities around the world requires bet-
ter planning and informed decisions to improve the
citizen quality of life and optimize cities’ infrastruc-
ture. To achieve this, it is mandatory the use of tools,
such as simulators, that facilitate the analysis and
comparison of different alternative scenarios, leading
to more effective public policies and governmental ac-
tions.
With the open source simulator we are now mak-
ing available, a researcher or urban planner is ca-
pable of simulating millions of agents in an entire
metropolitan area with multiple modal-splits. This
simulator can now be applied to various fields such
as mobility planning, comparison of potential inter-
ventions in the traffic, and measuring the impact of
changes in the city infrastructure.
This paper showed that with a large-scale, smart
city simulator, it is possible to analyze the impact of
changes in the infrastructure of a large metropolis,
with over 10 million people. We compared param-
eters, such as travel distance, time, and carbon foot-
print from the population of a slum using the current
mobility infrastructure and possible scenarios with
the new lines planned for the next years. The compar-
ison of the simulation results showed many potential
benefits from these modifications in the city infras-
tructure.
As future work, we plan to implement new trans-
port modes in the simulator such as bicycle, car shar-
ing, and taxis. We also intend to include new Smart
City scenarios such as smart parking and garbage col-
lection. Regarding the analyzes, we will analyze other
Analyzing Urban Mobility Carbon Footprint with Large-scale, Agent-based Simulation
149

areas in the city that also have planned very significant
modifications in their infrastructure and compare the
benefits of these adjustments.
To assure reproducibility of our results, the
experimental package, including all source code,
datasets, and scripts used in this paper is available at
http://interscity.org/software/interscsimulator.
ACKNOWLEDGEMENTS
This work is part of the INCT of the Future Inter-
net for Smart Cities (CNPq 465446/2014-0, CAPES
88887.136422/2017-00 and FAPESP 2014/50937-1)
and CNPq grant 420907/2016-5.
The authors also acknowledge the Coordination
for the Improvement of Higher Education Personnel
(CAPES) for scholarships financial support.
REFERENCES
Bazzan, A. L. and Kl
¨
ugl, F. (2014). A review on agent-
based technology for traffic and transportation. The
Knowledge Engineering Review, 29(3):375–403.
Behrisch, M., Bieker, L., Erdmann, J., and Krajzewicz,
D. (2011). Sumo–simulation of urban mobility: an
overview. In Proceedings of SIMUL 2011, The Third
International Conference on Advances in System Sim-
ulation. ThinkMind.
Benevolo, C., Dameri, R. P., and DAuria, B. (2016). Smart
mobility in smart city. In Empowering Organizations,
pages 13–28. Springer.
Bischoff, J. and Maciejewski, M. (2016). Simulation
of city-wide replacement of private cars with au-
tonomous taxis in berlin. Procedia computer science,
83:237–244.
Caragliu, A., Del Bo, C., and Nijkamp, P. (2011). Smart
cities in europe. Journal of urban technology,
18(2):65–82.
Carruthers, R., Dick, M., and Saurkar, A. (2005). Afford-
ability of public transport in developing countries.
Chester, M. and Horvath, A. (2008). Environmental life-
cycle assessment of passenger transportation: a de-
tailed methodology for energy, greenhouse gas and
criteria pollutant inventories of automobiles, buses,
light rail, heavy rail and air v. 2. UC Berkeley Cen-
ter for Future Urban Transport: A Volvo Center of
Excellence.
Giffinger, R., Fertner, C., Kramar, H., Kalasek, R., Pichler-
Milanovic, N., and Meijers, E. (2007). Smart cities-
ranking of european medium-sized cities. Rapport
technique, Vienna Centre of Regional Science.
Gwilliam, K. (2003). Urban transport in developing coun-
tries. Transport Reviews, 23(2):197–216.
Hern
´
andez-Mu
˜
noz, J. M., Vercher, J. B., Mu
˜
noz, L.,
Galache, J. A., Presser, M., G
´
omez, L. A. H., and Pet-
tersson, J. (2011). Smart cities at the forefront of the
future internet. In The Future Internet Assembly, vol-
ume 6656, pages 447–462. Springer.
Horni, A., Nagel, K., and Axhausen, K. W. (2016). The
multi-agent transport simulation MATSim. Ubiquity
Press London.
Kenny, T. and Gray, N. (2009). Comparative performance
of six carbon footprint models for use in ireland. En-
vironmental impact assessment review, 29(1):1–6.
Maciejewski, M. and Nagel, K. (2013). Simulation and dy-
namic optimization of taxi services in matsim. VSP
Working Paper 13-0. TU Berlin, Transport Systems
Planning and Transport Telematics, 2013.
Pucher, J., Korattyswaropam, N., Mittal, N., and Ittyerah,
N. (2005). Urban transport crisis in india. Transport
Policy, 12(3):185–198.
Salon, D. and Gulyani, S. (2010). Mobility, poverty, and
gender: travel choices of slum residents in nairobi,
kenya. Transport Reviews, 30(5):641–657.
Santana, E. F. Z., Chaves, A. P., Gerosa, M. A., Kon, F., and
Milojicic, D. S. (2017a). Software platforms for smart
cities: Concepts, requirements, challenges, and a uni-
fied reference architecture. ACM Computing Surveys,
50(6):78:1–78:37.
Santana, E. F. Z., Lago, N., Kon, F., and Milojicic, D. S.
(2017b). Interscsimulator: Large-scale traffic simula-
tion in smart cities using erlang. 18th Workshop on
Multi-agent-based Simulation.
Schnemann, B. (2011). V2x simulation runtime infras-
tructure vsimrti: An assessment tool to design smart
traffic management systems. Computer Networks,
55(14):3189 – 3198.
Shankari, K., Yin, M., Shanmugam, S., Culler, D. E., and
Katz, R. H. (2014). E-mission: Automated transporta-
tion emission calculation using smart phones. Techni-
cal report, EECS Department, University of Califor-
nia, Berkeley.
Song, X., Xie, Z., Xu, Y., Tan, G., Tang, W., Bi, J., and Li,
X. (2017). Supporting real-world network-oriented
mesoscopic traffic simulation on gpu. Simulation
Modelling Practice and Theory, 74:46–63.
Tang, T., Li, J., Huang, H., and Yang, X. (2014). A car-
following model with real-time road conditions and
numerical tests. Measurement, 48:63–76.
Washburn, D., Sindhu, U., Balaouras, S., Dines, R. A.,
Hayes, N. M., and Nelson, L. E. (2009). Helping cios
understand “smart city” initiatives. Growth, 17(2):1–
17.
Wiedmann, T. and Minx, J. (2007). A definition of car-
bon footprint. CC Pertsova, Ecological Economics
Research Trends, 2:55–65.
Zegras, C. (2010). The built environment and motor vehicle
ownership and use: Evidence from santiago de chile.
Urban Studies, 47(8):1793–1817.
Zilske, M., Schr
¨
oder, S., Nagel, K., and Liedtke, G. (2012).
Adding freight traffic to matsim. Technical report,
VSP Working Paper 12-02, TU Berlin, Transport Sys-
tems Planning and Transport Telematics.
SMARTGREENS 2018 - 7th International Conference on Smart Cities and Green ICT Systems
150
