
An Acoustic-based Tracking System for Monitoring Elderly People
Living Alone
Akira Sasou, Nyamerdene Odontsengel and Shumpei Matsuoka
National Institute of Advanced Industrial Science and Technology, AIST, 1-1-1, Umezono, Tsukuba, Ibaraki, Japan
Keywords: Monitoring, Elderly People, Sound Source Localization, Microphone Array.
Abstract: Japan is becoming a super-aged society and the population of elderly people is increasing, although the
overall population in Japan is decreasing. In order to support a safe and secure autonomous life and to
improve the quality of life for elderly people living alone, the development of monitoring and life-support
systems is a pressing matter. In this paper, we propose a monitoring system that would enable relatives and
other interested parties to easily monitor the daily life of elderly people from afar by using mobile devices.
With such a monitoring system, it is very important to protect the privacy of the people being monitored.
The proposed monitoring system seeks to approximately but recognizably reconstruct the status of elderly
people's daily life by using computer graphics (CG) based on information obtained from various types of
sensors, mainly consisting of acoustic sensors such as microphone arrays that are utilized to track the
walking patterns of elderly people based solely on the sound of their footsteps.
1 INTRODUCTION
Japan is becoming a super-aged society and the
population of elderly people is increasing, although
the overall population in Japan is decreasing. In
order to support a safe and secure autonomous life
and to improve the quality of life for elderly people
living alone, the development of monitoring and
life-support systems is a pressing matter. To this
end, a number of wearable sensors (Najafi, 2003),
(Adam, 2016), (Lee, 2016), (Sansrimahachai, 2016),
(Odunmbaku, 2015), (Pires, 2016), (Lachtar, 2016),
(Stutzel, 2016), (Wang, 2014), (Tuna, 2015)
including kinematic sensors (Najafi, 2003), health
monitoring vests (Adam, 2016), shoes with sensors
(Lee, 2016), mobile phones (Sansrimahachai, 2016),
smart watches (Odunmbaku, 2015), wearable
biomedical sensors (Pires, 2016), and canes (Lachtar,
2016) have been developed. These sensors are
usually used for specific purposes such as measuring
health parameters (body temperature, blood
pressure, heart rate, etc.), detecting body posture,
and measuring velocity and acceleration. There are
also other types of sensors (Tsukiyama, 2015), (Kim,
2016), (Liu, 2016) such as water-flow sensors
(Tsukiyama, 2015) and passive infrared detection
sensors (Kim, 2016). These sensors are sited in
specific places such as the kitchen, bathroom, and
the bed to measure how often such places are
utilized.
In this paper, we propose a monitoring system
that would enable relatives and other interested
parties to easily monitor the daily life of elderly
people from afar by using mobile devices such as
smartphones and tablets. With such a monitoring
system, it is very important to protect the privacy of
the people being monitored. Therefore, raw data of
photographs, video images, voices, and sounds
should not be presented directly on the mobile
devices. To avoid doing this, our monitoring system
seeks to approximately but recognizably reconstruct
the status of elderly people's daily life by using
computer graphics (CG) based on information
obtained from various types of sensors, mainly
consisting of acoustic sensors such as microphone
arrays. For instance, in our monitoring system,
microphone arrays are utilized to make it possible to
track the walking patterns of elderly people based
solely on the sound of their footsteps, without there
being a need for them to wear any sensors.
Sasou, A., Odontsengel, N. and Matsuoka, S.
An Acoustic-based Tracking System for Monitoring Elderly People Living Alone.
DOI: 10.5220/0006664800890095
In Proceedings of the 4th International Conference on Information and Communication Technologies for Ageing Well and e-Health (ICT4AWE 2018), pages 89-95
ISBN: 978-989-758-299-8
Copyright
c
2019 by SCITEPRESS – Science and Technology Publications, Lda. All rights reserved
89
2 FOOTSTEP-BASED POSITION
TRACKING
2.1 Footstep Localization with
Microphone Arrays
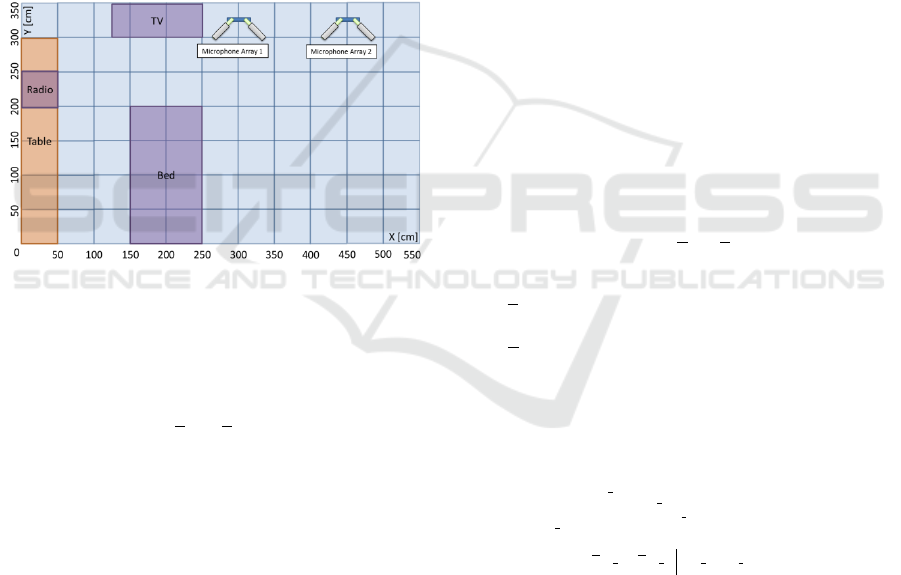
For footstep localization, we utilize a pair of
microphone arrays placed on the floor and separated
by a distance of 1.5 m, as shown in Fig. 1. Each
microphone array has two tilted linear microphone
array units implementing four MEMS microphones
per unit, meaning the pair of microphone arrays has
a total of 16 microphones. Sound source localization
(SSL) is achieved by means of a MUSIC method
implemented on 10-cm grid spacing, and each
detected sound source is segregated with minimum
variance beamforming (MVBF) (Sasou, 2009).
Figure 1: Layout of simulated living space and micro-
phone arrays.
Below, we assume that
kN
Z
denotes the number
of sound sources detected by the microphone arrays
at time k, and the XY coordinate of each detected
source is given by
jk
x
,
,
jk
y
,
,
kNj
Z
,,1
,
where k and j denote time index and sound source
index, respectively. We calculate the mel-frequency
cepstral coefficients (MFCC) from each segregated
sound source with the MVBF. The MFCC of each
sound source is used to evaluate the likelihood of a
footstep acoustic model, which consists of a
Gaussian mixture model (GMM). The GMM is
learned in advance from sample footstep data. In the
following,
jk
l
,
presents the evaluated likelihood of
the acoustic model given the MFCC
jk,
f
.
2.2 Walking Line Estimation using a
Particle Filter
We assume that the total number of particles is
P
N
,
and that the i th (
P
Ni ,,1
) particle at time k has
state variables consisting of the XY coordinates
)(i
k
x
,
)(i
k
y
and the time difference
)(i
k
x
,
)(i
k
y
, and these
state variables are assumed to satisfy the following
process equation:
)(
1
)(
1
)(
)(
1
)(
1
)(
)(
1
)(
1
)(
1
)(
)(
1
)(
1
)(
1
)(
i
k
i
ky
i
k
i
k
i
kx
i
k
i
k
i
k
i
ky
i
k
i
k
i
k
i
kx
i
k
yyLy
xxLx
yyyLy
xxxLx
(1)
where
*
L
represents a function defined by:
)(,
)(,
)(,
**
**
**
*
ll
lh
hh
L
(2)
and
**,
are process noises conforming to:
2
*
2
*
,0*,,0*
NN
(3)
We also assume the following measurement equation
with regard to the state variables
)(i
k
x
,
)(i
k
y
and the
observed XY coordinate
jk
x
,
,
jk
y
,
detected with the
microphone arrays.
)()(
,
)()(
,
i
k
i
kjk
i
k
i
kjk
xyy
xxx
(4)
where
*
is a measurement noise defined by:
2
*
,0*
N
. (5)
The weight
)(i
k
w
of a particle is updated according to:
)()(
,,
1
0
)(
1 1
,
)(
,,
i
kk
i
kkjkkjkk
N
k
kkN
j
N
i
jkk
ki
k
yxyxP
lw
K Z P
(6)
To avoid abrupt changes in the estimated walking
line, we calculate the average of the past
K
N
XY
coordinates including the current one. In this
averaging, the forgetting factor
)10(,
is
incorporated to give exponentially less weight to the
older XY coordinates. The likelihood of particle in
Eq. (6) is given by:
ICT4AWE 2018 - 4th International Conference on Information and Communication Technologies for Ageing Well and e-Health
90
)(
2
)(
,
)(
2
)(
,
)()(
2
)()(
,,
22
exp
2
1
,,
i
kk
i
kkjkk
i
kk
i
kkjkk
i
kk
i
kk
i
kk
i
kkjkkjkk
y
yy
x
xx
yx
yxyxP
(7)
The weights are sorted in descending order and
the maximum weight multiplied by a coefficient
)10(,
is adopted as a threshold value to
choose the effective particles. The chosen particles
are then classified into several classes so that the
particles of one class are separated from all other
classes within a specific distance. This can be
achieved by using the following procedure. The
particle with the maximum weight is first registered
to the representative particle of class
1,k
C
corresponding to one walking person. If the distance
between the maximum weight particle and the
second particle exceeds the specified threshold of
distance, the second particle is registered as the new
representative particle of another walking person
represented with class
2,k
C
. If it does not, the second
particle is included in class
1,k
C
. All effective
particles are processed using these procedures and
are then classified into classes
sk
C
,
,
S
Ns ,,1
,
where
S
N
represents the number of simultaneous
walking persons. The XY coordinate of each walking
person (each class) is estimated by the following
equations.
sk sk
sk sk
Ci Ci
i
k
i
k
i
ksk
Ci Ci
i
k
i
k
i
ksk
wywy
wxwx
, ,
, ,
)()()(
,
)()()(
,
/
~
/
~
(8)
Finally, a resampling algorithm is executed so
that all the particles have uniform weights.
P
i
k
i
k
i
k
i
k
i
k
i
k
i
k
i
k
i
k
Nyxyx
wyxyx
/1,,,,
~
,,,,
)()()()(
)()()()()(
(9)
where
)(
~
i
k
w
are normalized weights given by:
P
N
m
m
k
i
k
i
k
www
1
)()()(
/
~
(10)
By means of the above procedures, the current
footstep positions of the
S
N
persons are estimated.
Next we need to connect the current footstep
position to one of the previously estimated positions
in order to generate the walking lines. This can be
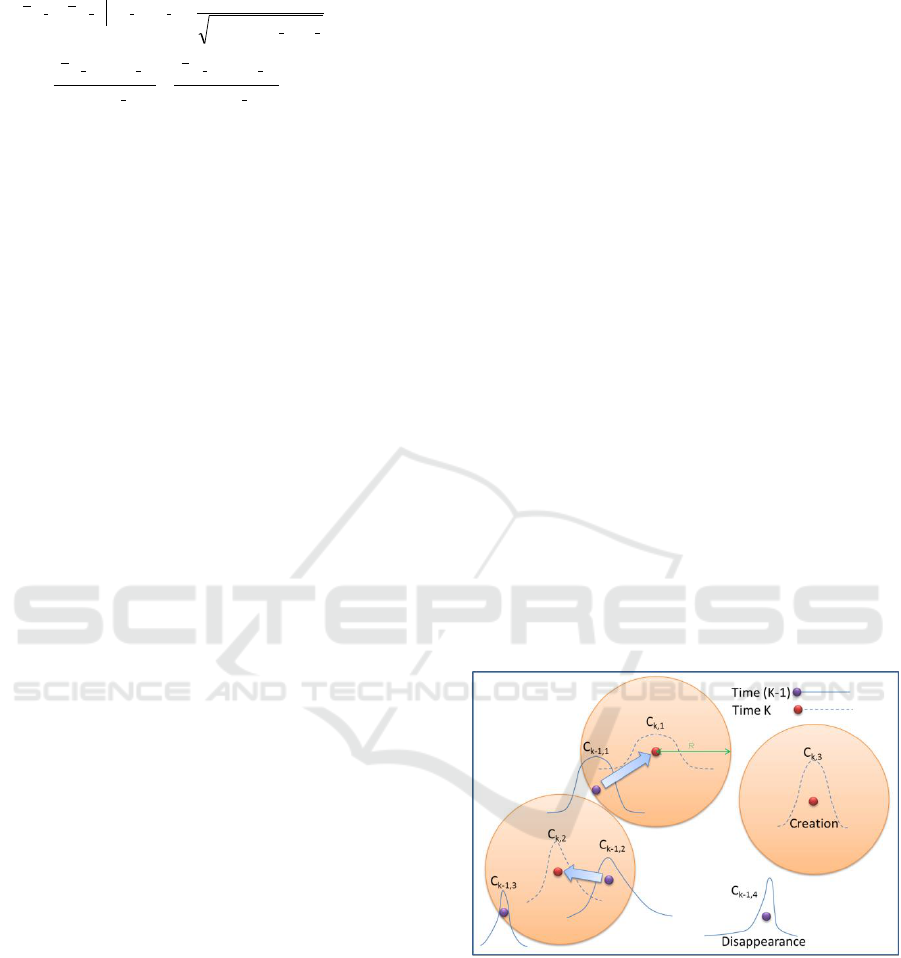
achieved as follows. In Fig. 2, we assume that four
footstep positions were detected at time k-1 as
plotted by the purple dots. We also assume that three
footstep are detected at current time k as plotted by
the red dots. We select one of the current estimated
footstep positions, and check if the previous footstep
positions enter a circle centered on the selected
current footstep position. The footstep position
previously estimated from the class
1,1k
C
enters the
circle of the footstep position currently estimated
from
1,k
C
. These two positions are thus connected.
The circle centered on the footstep position
estimated from class
2,k
C
includes the two previous
footstep positions. In this case, we select the
previous footstep position nearest to the current
position. The footstep position estimated from class
3,k
C
has no connectable previous positions. In this
case, this current position is registered as the starting
point of a new walking line. The footstep position
previously estimated from class
4,1k
C
has no
connectable current footstep position. In this case,
we decrease the time-to-live counter that is given to
every estimated footstep position. If the time-to-live
counter reaches zero, the footstep position is
extinguished. If it does not, the footstep position
remains registered. The time-to-live counter is reset
to the maximum number when a connectable
footstep position is found.
The above procedures are iterated at time k+1.
Figure 2: Estimation of walking lines.
3 EXPERIMENTS
We set up the microphone arrays in the simulated
living space shown in Fig. 1 to implement the
proposed footstep-based tracking system. We
recorded the footsteps while a specific user was
walking, like drawing a circle several times. We also
recorded the sound of TV as a noise source
An Acoustic-based Tracking System for Monitoring Elderly People Living Alone
91
separately. The volume of the TV sound was set to a
normal level. The SNR of the separately recorded
footstep and the TV sound of the normal level was
approximately 1 dB. In the following experiments,
we generated three types of footsteps for the
experiments.
A) Clean footstep without noise interference,
B) Footstep mixed with the TV sound at SNR = 1
dB,
C) Footstep mixed with the TV sound at SNR = -5
dB
where the SNR was evaluated as the average of the
SNRs of all 16 channels of the microphone arrays.
The third footstep of SNR = -5 dB was generated
because elderly people frequently have difficulty in
hearing and tend to turn up the sound volume of a
TV. The sampling frequency was 11.025 kHz. The
evaluated MFCC consists of 12 coefficients without
a C0 nor an energy coefficient. The GMM of the
footstep acoustic model consists of four Gaussian
distributions, which were trained from the specific
user's footstep acoustic signals segregated with the
microphone arrays.
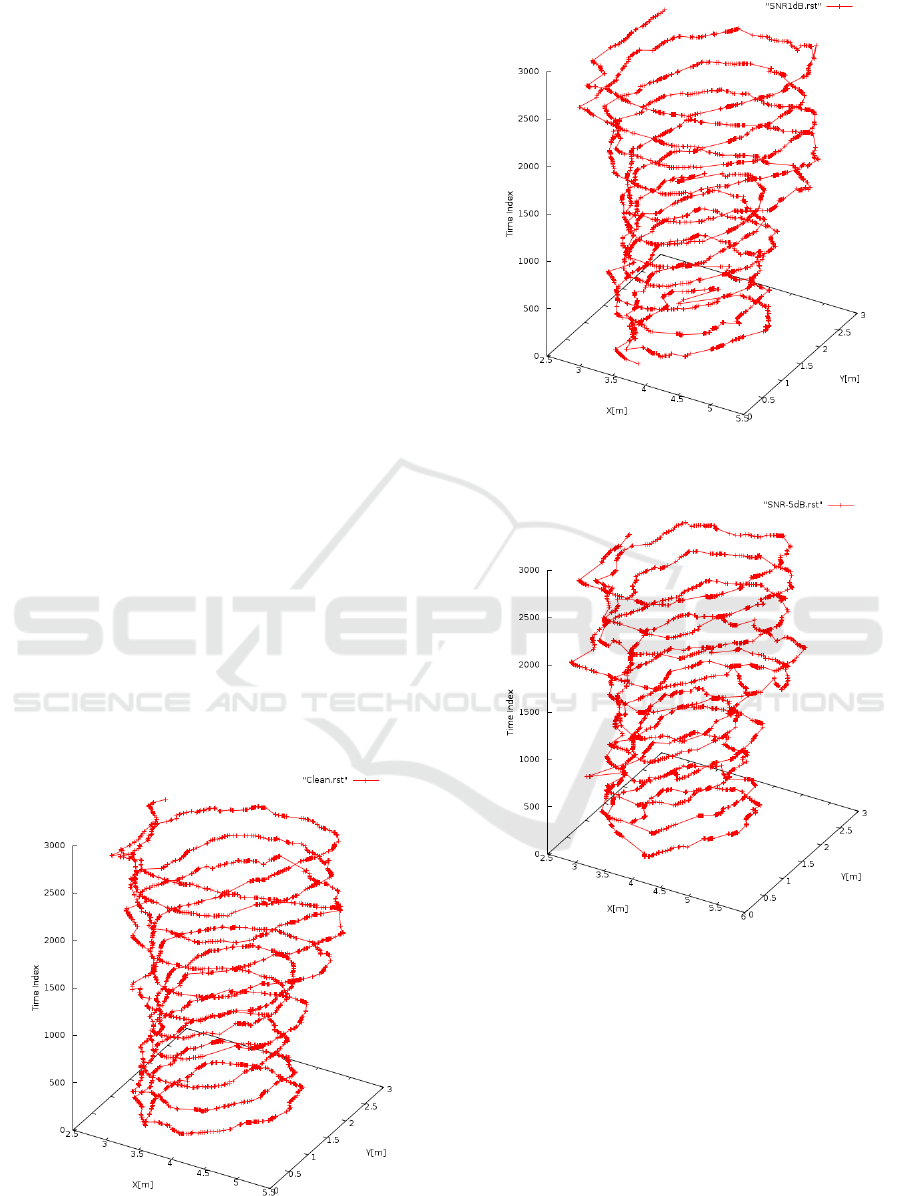
Figures 3, 4, and 5 show the estimated walking
lines from the footsteps of the Clean, SNR 1 dB, and
SNR -5 dB footsteps, respectively. To evaluate the
noise robustness of the proposed footstep-based
tracking system, we calculated the average error
distance between the walking lines estimated from
the noise-corrupted footsteps and the clean footsteps
(Fig.6). The average error distance between the
walking lines estimated from the SNR 1dB and the
Figure 3: Walking line estimated from the clean footstep.
Figure 4: Walking line estimated from the SNR 1 dB
footstep.
Figure 5: Walking line estimated from the SNR -5 dB
footstep.
clean footsteps was 0.23[m] and the standard
deviation was 0.14[m]. In the case of the noise-
corrupted footstep with SNR -5dB, the average error
distance was 0.33[m] and the standard deviation was
0.19[m].
ICT4AWE 2018 - 4th International Conference on Information and Communication Technologies for Ageing Well and e-Health
92
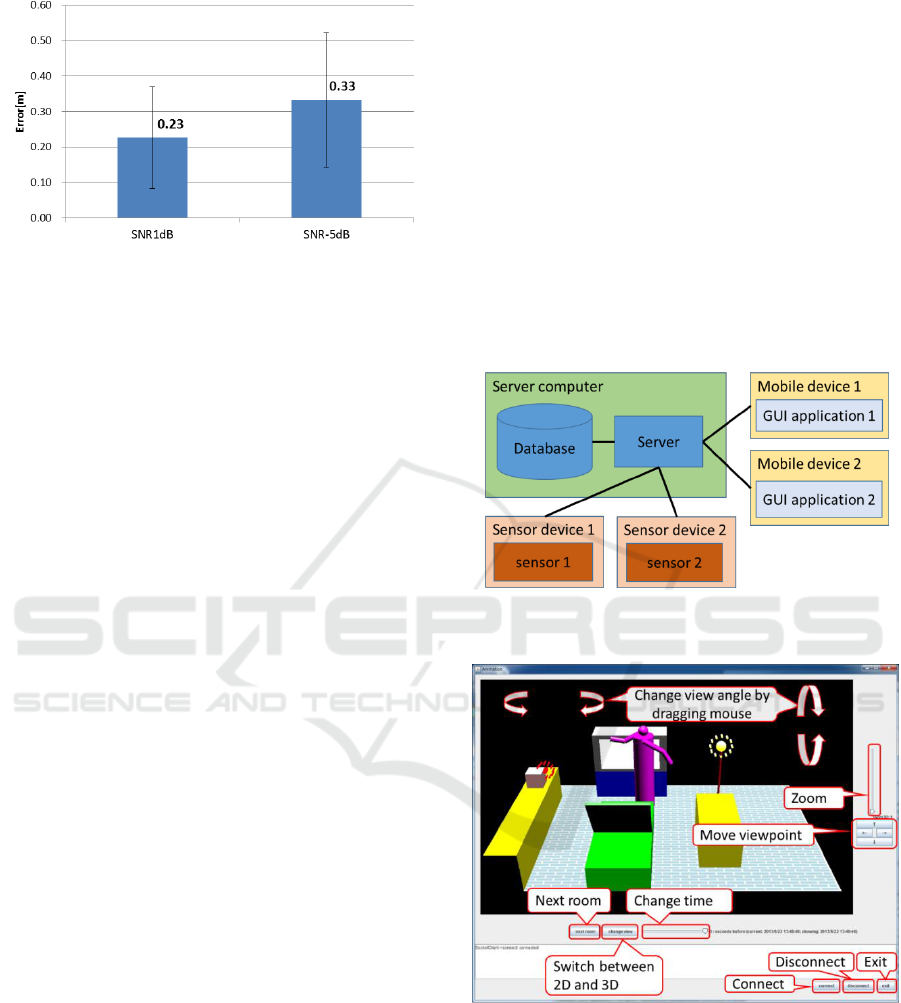
Figure 6: Average error distances between walking lines
estimated from the noise-corrupted and the clean footsteps.
4 MONITORING SYSTEM FOR
ELDERLYPEOPLE LIVING
ALONE
4.1 System Overview
The proposed monitoring system consists of a server
computer, mobile devices with Graphical User
Interfaces (GUIs) and sensor devices as shown in
Fig. 7. The server computer performs the following
operations.
Establishes connections requested from the sensor
devices and/or the GUI application running on the
mobile devices.
Receives data sent from the sensor devices.
Stores sensor data in the database.
Retrieves sensor data of the requested date and time
from the database and sends the data to the GUI
application.
Controls the remote sensor devices according to the
requests from the GUI application of the mobile
devices.
The sensor devices perform the following operations.
Request a connection to the server computer when
starting up.
Send sensing data to the server computer.
Execute the sensor control requests from the server
computer.
The GUI application running on the mobile device
performs the following operations.
Requests a connection to the server computer when
starting up.
Requests the server computer to send the sensor
data that had been stored in the database since the
requesting date and time.
Receives the sensor data sent from the server
computer.
Draws a 3D CG showing the status of the elderly
people according to the script file that defines how
to draw CG based on the received sensor data
(mentioned below).
Displays the statuses of all sensor devices
connected to the server computer and sends the
requests to the server computer for a user to
control them.
The application running on a mobile device provides
a GUI, as shown in Fig. 8. Assuming that the house
in which the elderly person lives has several rooms,
the monitoring system needs to be able to monitor
all the rooms by means of the GUI. For this purpose,
the user can switch the room being monitored by
clicking the “Next room” button (Fig. 8).
Figure 7: Block diagram of the proposed monitoring
system.
Figure 8: GUI of application running on a mobile device.
We added the following functions to the GUI to
enable the user to easily ascertain the status of the
elderly person.
User (person who monitors) can easily view CG
from various angles by dragging a mouse on the
GUI.
The “Move viewpoint” buttons and “Zoom” slide
bar enable the user to adjust the viewpoint.
An Acoustic-based Tracking System for Monitoring Elderly People Living Alone
93
Past statuses can be viewed by specifying the time
lag from the current time with the “Change time”
slide bar.
The GUI application is compiled according to a
script file. The script file defines the following.
How many rooms there are in the house.
What objects (home appliances, furniture, etc.) and
sensors are there in each room.
How to draw the objects in the GUI with the CG
depending on the values of the received sensor
data.
The script file supports the descriptions similar to a
C-shell where variables, numerical operators,
conditional “if-else” statements and “while” loops
are available. The program written in the script file
enables the CG appearances of the objects to change
depending on the received sensor data. The GUI
application updates the CG according to the script
file every time it receives new sensor data.
It is not feasible for the user to monitor the GUI
application all the time. Therefore, the GUI
application needs to show the status of the elderly
person at an arbitrary past time with regard to user
demands. To achieve this, the server program stores
two types of sensor data in the database: sensor data
and accumulated data.
Sensor data are simply data received from
sensors. The server stores sensor data in the database
with the time tag sent from the sensor. When a user
specifies the time lag to display the living conditions
on the GUI, the server sends sensor data sequentially
from the specified time.
Accumulated data include all the values of the
variable that reflect all the sensor data received from
the beginning to the specified time. The server stores
accumulated data in the database every 30 seconds
and sends them when the user selects the time to
display the living condition on the GUI.
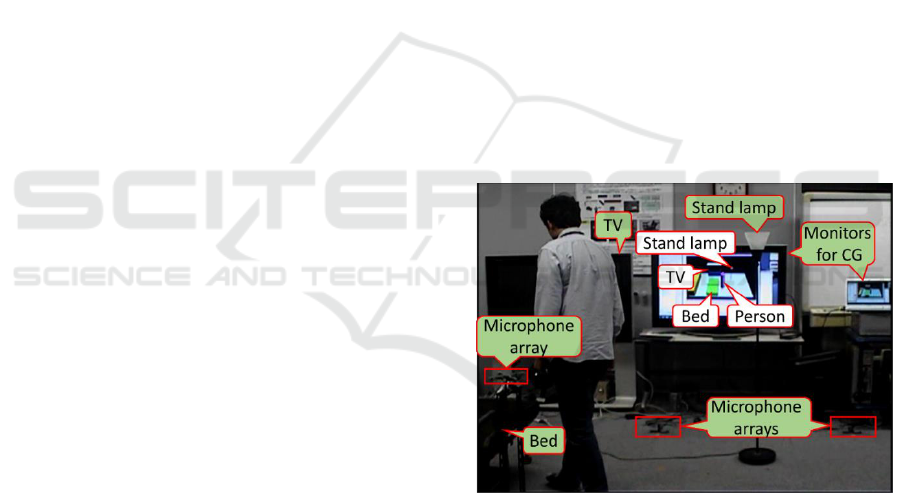
4.2 Implementation of Monitoring
System
We set up the simulated living space shown in Figs.
9 and 10 in our laboratory to implement our
monitoring system. A pair of microphone arrays is
placed on the floor for the proposed footstep-based
tracking system (Fig. 9). In this living space, we
placed a bed and some home appliances such as a
TV, a stand lamp, and a radio, which can be
controlled by speech recognition (Sasou, 2008). To
make the speech recognition robust against noise
interference, another pair of microphone arrays was
placed on both sides of the bed. The speech
recognition system is connected to these home
appliances and can control them according to the
speech recognition results.
The footstep-based tracking system and the
speech recognition system are also connected to the
server computer as sensor devices, and the localized
position of the person and the controlled states of the
home appliances are sent to the server computer. In
addition to being stored in the database of the server
computer, these sensor data are directory transferred
to the GUI application in the current time display
mode.
In this implementation, the monitor screen in the
center of Fig. 9 is used to display the GUI of the
application instead of a mobile device. The monitor
screen displays a person with a purple stick at the
position localized with the footstep-based tracking
system. The appearances of the home appliances are
changed according to the controlled state. For
instance, when the TV is off, the TV screen in the
GUI is colored black (Fig. 9). While the TV is
turned on, the screen is changed to white (Fig. 10).
We use other sensors in addition to the acoustic
sensors. For instance, a force sensor is installed on
the bed in order to detect when a person is lying on
it. In this situation, the purple stick is changed, as
shown in Fig. 10.
Figure 9: Simulated living space implemented using the
proposed monitoring system.
ICT4AWE 2018 - 4th International Conference on Information and Communication Technologies for Ageing Well and e-Health
94
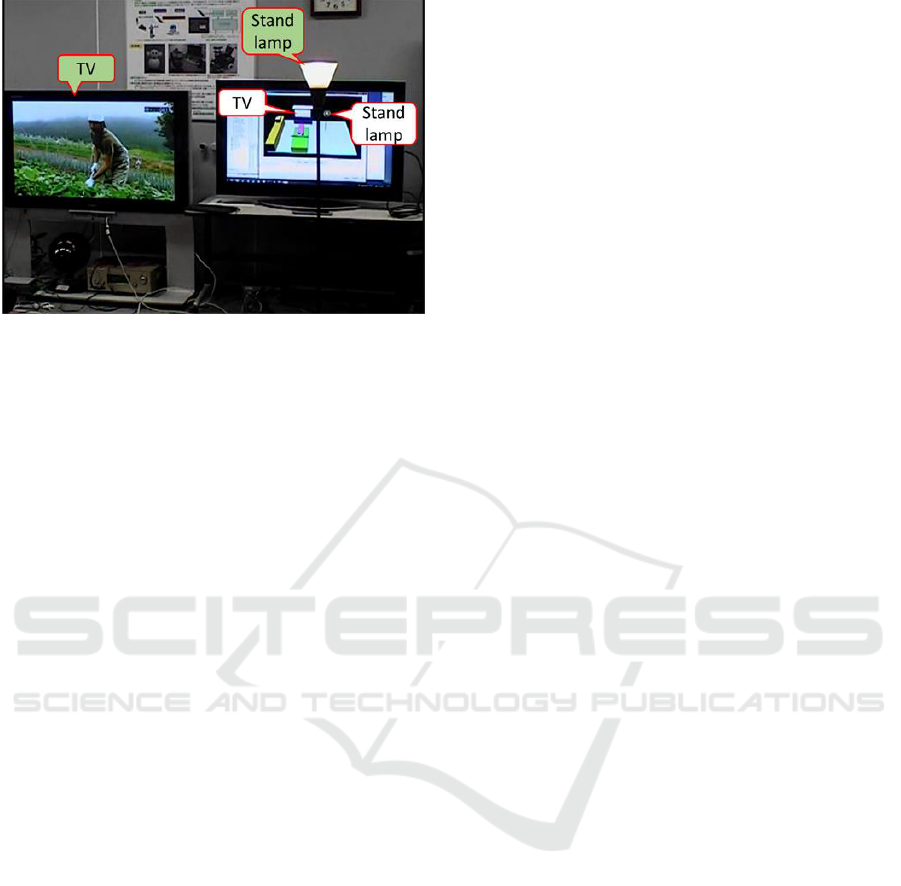
Figure 10: Example of the GUI representing the controlled
states of the home appliances.
5 CONCLUSIONS
We proposed a footstep-based tracking system. The
experiment results confirmed that the proposed
tracking system is robust against the interference of
surrounding noises. By applying a footstep-based
tracking system, we are developing a monitoring
system to support a safe and secure autonomous life
and to improve the quality of life for elderly people
living alone. We are currently planning to
implement the developed monitoring system in
facilities for the elderly in order to confirm the
feasibility of the system.
REFERENCES
Najafi, Bijan, et al. 2003. "Ambulatory system for human
motion analysis using a kinematic sensor:
monitoring of daily physical activity in the elderly."
IEEE Transactions on biomedical Engineering 50.6,
pp.711-723.
Adam, H. M., and P. J. Soh., 2016. "Development of a
health monitoring vest for the elderly." Numerical
Electromagnetic and Multiphysics Modeling and
Optimization (NEMO), IEEE MTT-S International
Conference on. IEEE.
Lee, Boram, and Yoosoo Oh., 2016. "Emergency
monitoring system for safe walking of the elderly
people." Proceedings of HCI Korea. Hanbit Media,
Inc.
Sansrimahachai, Watsawee, and Manachai Toahchoodee.,
2016. "Mobile-phone based immobility tracking
system for elderly care." Region 10 Conference
(TENCON), IEEE.
Odunmbaku, Abdulakeem, et al., 2015. "Elderly
monitoring system with sleep and fall detector."
Internet of Things. IoT Infrastructures: Second
International Summit, IoT 360°, Rome, Italy,
October 27-29.
Pires, Pedro, et al., 2016. "Integrated e-Healthcare System
for Elderly Support." Cognitive Computation 8.2,
pp.368-384.
Lachtar, Abdelfetteh, Thierry Val, and Abdennaceur
Kachouri. 2016. "3DCane: a monitoring system for
the elderly using a connected walking stick."
International Journal of Computer Science and
Information Security 14.8, pp.1-8.
Stutzel, Matheus Costa, et al., 2016. "SMAI-Mobile
System for Elderly Monitoring." Serious Games
and Applications for Health (SeGAH), IEEE
International Conference on. IEEE.
Wang, Jin, et al., 2014. "An enhanced fall detection
system for elderly person monitoring using
consumer home networks." IEEE transactions on
consumer electronics 60.1, pp.23-29.
Tuna, Gurkan, Resul Das, and Ayse Tuna, 2015.
"Wireless Sensor Network-Based Health
Monitoring System for the Elderly and Disabled."
International Journal of Computer Networks and
Applications (IJCNA) 2.6, pp.247-253.
Tsukiyama, Toshifumi, 2015. "In-home health monitoring
system for solitary elderly." Procedia Computer
Science 63, pp.229-235.
Kim, Hyun-Sik, Jong-Su Seo, and Jeongwook Seo, 2016.
"A Daily Activity Monitoring System for Internet
of Things-Assisted Living in Home Area
Networks." International Journal of Electrical and
Computer Engineering 6.1,pp.399.
Liu, Hao, et al, 2016. "Indoor monitoring system for
elderly based on ZigBee network." Micro-
NanoMechatronics and Human Science (MHS),
International Symposium on. IEEE.
Akira Sasou, et al, 2009, "Noise robust speech recognition
applied to voice-driven wheelchair," EURASIP
Journal on Advances in Signal Processing,
vol.2009, article ID 512314, 9 pages.
Akira Sasou, 2008. "Head-orientation-estimation-
integrated speech recognition for the smart-chair,"
Proc. of 2nd International Symposium on Universal
Communication (ISUC2008), pp.482-489, Dec.
An Acoustic-based Tracking System for Monitoring Elderly People Living Alone
95
