
“Flight Map” Modelling Intellectual Geoinformation System for
Urban Areas Cargo Delivery by Unmanned Aerial Vehicle
Oleg Golovnin, Nikita Ostroglazov and Tatyana Mikheeva
Samara National Research University, Samara, Russia
Keywords: Intelligent Transport Systems, Unmanned Aerial Vehicles, Transport Network Model, Geoinformation
System, Genetic Algorithm, Branch and Bound Method.
Abstract: This article is dedicated to solving the problem of safe and secure cargo delivery in urban territory using
unmanned aerial vehicles (multicopters) by modelling “flight map”, i.e. a system based on intellectual
geoinformation system that develops an optimal and secure route for each UAV in the system and tracks all
of them on electronic map online. The paper describes the results of algorithms analysis and assumes the
algorithm showing higher test results.
1 INTRODUCTION
Today multicopters are highly sought and popular
remote control Unmanned Aerial Vehicles (UAVs).
Multi-rotor UAVs are equipped with special
electronic sensors like accelerometers and gyro-
scopes allowing the UAV to stay stable and maneuver
(Garcia et al., 2017). The multicopter can be used for
performing various tasks including cargo delivery.
UAV owners, logistics companies and carriers can
benefit from using UAVs for cargo delivery purposes
(Tkachev et al., 2015). Thereby, modelling “flight
map” for UAVs using geoinformation system is
absolutely necessary. “Flight map” modelling in this
case means developing a transport network model,
UAVs security control system (Bansal et al., 2017)
providing UAVs flights safety in predetermined
echelons and corridors, and online real-time UAVs
tracking system. The automation system is based on
geoinformation system, electronic vector map,
transport network model and transport infrastructure
objects database.
A step-by-step transition from autonomous route
guidance to dynamic is a promising direction of route
navigation development. In this case, the main task of
information processing is optimal route selection and
its dynamic correction during the flight (Iswanto et
al., 2017). Dynamic route management presumes,
first and foremost, the possibility to dynamically
correct (recalculate) at any time and at any point of
the route the optimal route taking into account any
changes in the transport network (Stepanov, 2015)
and also possible changes in route selection criteria
(Antoniades et al., 2017).
2 TRANSPORT NETWORK
MODEL
The paper provides graph-based transport network
model for UAVs route development consisting of
following entities:
area – piece of transport network represented
by a set of coordinate pairs, described as a set
of physical parameters. The area is encoded by
a polygon defined by its vertices coordinates;
node – point where traffic flows are separated.
The node is the vertex of the oriented graph,
channeling traffic flows. It lies at the junction
of two areas and indicates the possibility of
moving from one area to another in the
direction defined by the relevant arc. Two
adjacent areas are assigned with two nodes.
Node is encoded by a point;
arc – element of the oriented graph that defines
the direction of the traffic flow on the area. It
contains relevant characteristics including arc
length, traffic intensity, traffic density, etc.
Two nodes are assigned with one arc defining
the traffic direction, or two arcs defining the
direction reverse area. Several arcs (traffic
flows) can be included in one area but each arc
can be included in only one area. Arc is a linear
object.
Golovnin, O., Ostroglazov, N. and Mikheeva, T.
“Flight Map” Modelling Intellectual Geoinformation System for Urban Areas Cargo Delivery by Unmanned Aerial Vehicle.
DOI: 10.5220/0006670002770282
In Proceedings of the 4th International Conference on Vehicle Technology and Intelligent Transport Systems (VEHITS 2018), pages 277-282
ISBN: 978-989-758-293-6
Copyright
c
2019 by SCITEPRESS – Science and Technology Publications, Lda. All rights reser ved
277
The “flight map” is meant for UAVs route
development (from one landing platform to another)
when performing cargo transportation from supplier
to a consumer taking into account normal and
abnormal situations. The “flight map” is
characterized by a corridor (a range of possible UAV
horizontal plane coordinates) and echelon (a
conditional height, established intervals value distant
from other heights).
This paper assumes that only 1 UAV is present in
the arc or node at the same time. That means UAVs
are canalizing in terms of time and space.
Landing Platform (LP) is designed for safe take-
off and landing of UAVs in urban areas. All the LPs
are deployed on the electronic map and included in
UAV “flight map”. The LPs can be divided into
groups according to its assignment: sources (take-off
platforms), outlets (landing points), charging points,
service stations, emergency landing platfoms.
3 ROUTE DEVELOPMENT
ALGORITHMS
3.1 Graph Model Algorithms
Route development algorithms are based on UAVs
“flight map” graph model and rely on Dijkstra’s
algorithm and branch and bound method for various
optimality criteria. In the context of dynamic route
management an additional criterion appears: optimal
path searching algorithm running time, which should
be minimized (Hayat et al., 2017).
In fact, route development is one of the traveling
salesman problem variations. All the optimal path
searching algorithms operate with graphs, all vertices
of which are included in the route (Vareldjan et al.,
2015).
3.2 Little’s Algorithm
An algorithm for the traveling salesman problem by
John D. C. Little is a particular case of the branch and
bound method. In a best-case scenario its usage
provides an opportunity to reduce the number of
operations.
The algorithm is used for an optimal route search
provided that an object (UAV) is returning to the
starting point. As a result, Little’s algorithm provides
a close loop (which may be not optimal) in less than
n steps. Calculation process complexity lies in the fact
that at each step it is necessary to analyze the elements
of the matrix and select zero elements (applicants for
branching and evaluation). With regard to algorithm
running time, with big n values the optimal path may
not be found at all due to the growth of the number of
branches and bounds. Therefore, it is required to
determine the optimal value for the algorithm.
3.3 Genetic Algorithm
Initialization, i.e. initial population formation is the
random selection of a predetermined number of
chromosomes represented by binary sequences of
fixed length. For UAV “flight map” modelling the id
number of the visited object is used as a gene. Route’s
weighting coefficient is assumed as a chromosome
fitness function (Silva Arantes et al., 2017).
3.4 Initial Data and Requirements
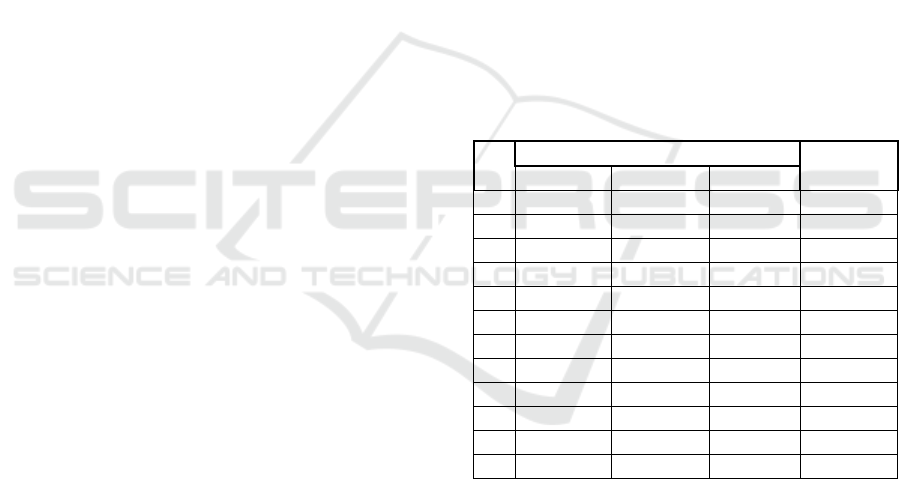
The algorithms were tested using the initial data
shown in table 1 for single UAV involving. New
graph is generated automatically after every test
cycle.
Table 1: Test cycles initial data.
№
№ of areas
№ of
arcs
Т-shaped Х-shaped I-shaped
1 5 20 3 275
2 10 40 6 550
3 20 80 12 1100
4 40 160 24 2200
5 80 320 48 4400
6 160 640 96 8800
7 320 1280 192 17600
8 640 2560 384 35200
9 1280 5120 768 70400
10 2560 10240 1536 140800
11 5120 20480 3072 281600
12 10240 40960 6144 563200
LP is an integral structure for UAV’s take-off and
landing providing safe and accurate landing in urban
areas. LP has to provide UAV’s wireless charging,
UAV’s status, options, cargo information and other
data transmission via WiFi / 4G / Ethernet networks.
LP’s normal functioning should be ensured for supply
voltage of 100-240 V, temperature of 5-45 C, wind
speed up to 5 m/s and light precipitation.
Weight of transported cargo should not exceed
5 kg. Cargo has to be packed in a special container for
transportation and should not be prohibited from
transportation by Government regulations.
The UAV should be supplied with GPS /
GLONASS navigation system, telemetry system,
VEHITS 2018 - 4th International Conference on Vehicle Technology and Intelligent Transport Systems
278
radio-beacon system, backup autonomous navigation
system, navigation light and 3-axis magnetometer.
The range of operating flight heights is from 300 m to
1200 m.
The analysis of each tested algorithm performance
is presented in “Test Results” section.
4 SYSTEM DEVELOPMENT
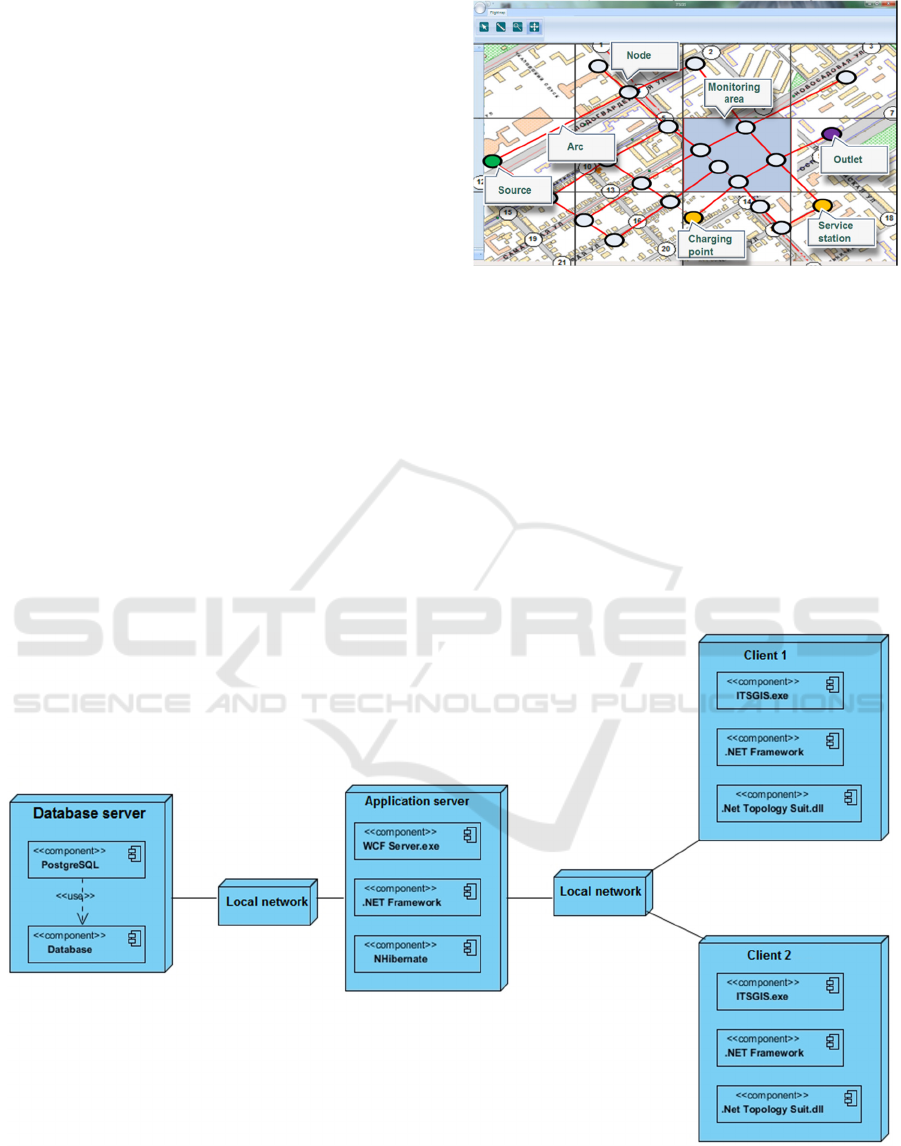
System was based on intellectual geoinformation
system ITSGIS. Figure 1 shows the UAV “flight
map” implemented in ITSGIS (Golovnin et al., 2017).
The system offers the possibility to add and edit
UAV “flight map” in multi-user mode, which
determines the use of multitier system architecture. It
is important to ensure data consistency and eliminate
emerging conflicts. The system is developed using a
three-tier architecture model (as shown in Figure 2).
Communication between clients and the application
server is based on Windows Communication
Foundation (WCF) technology.
Figure 1: UAV “Flight map”.
Figure 3 shows the diagram of system
components.
Fundamental system components are:
ITSGIS.exe – client’s executable file;
WCFServer.exe – server’s executable file;
DAO – database access layer;
Services – system services; located on the
server side and access the database through the
database access layer;
Managers – system managers; located on the
client’s side and access the services through the
network channel.
Figure 2: System architecture.
“Flight Map” Modelling Intellectual Geoinformation System for Urban Areas Cargo Delivery by Unmanned Aerial Vehicle
279
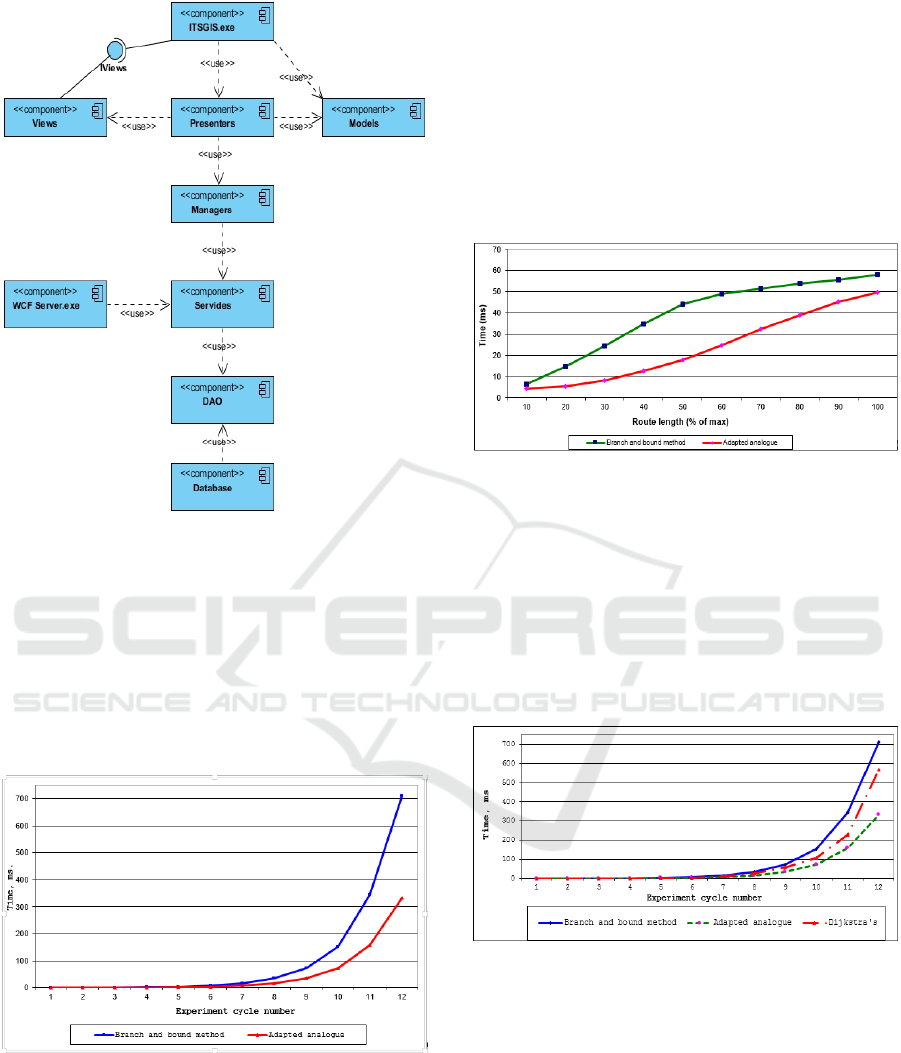
Figure 3: System components.
5 TEST RESULTS
Graphs of Figures 4 to 6 show the results of algorithm
tests. All algorithm tests were conducted under the
following testing conditions: CPU with 2 cores 2.8
GHz; 8 GB of RAM; Microsoft Windows 8;
Microsoft .NET 4 and using the same test equipment.
Figure 4: Branch and bound method and its adapted
analogue comparison.
Figure 4 shows the comparison of branch and
bound method and its adapted analogue according to
its running time parameter.
The point of adapted branch and bound method is
that it involves adding of an extra evaluation in order
to find the best node to branch. Thereby, evaluation
of every node in the tree is presented not only by the
distance travelled to the current node but also by the
distance left to travel to the final node.
In this case, the number of optimal path searching
iterations increases in proportion to the length of the
route.
Figure 5 shows the dependence of the optimal
route searching time on the number of vertices of the
graph containing about 35000 arcs.
Figure 5: Dependence of the optimal route searching time
on the number of vertices.
Figure 6 shows the comparison of branch and
bound method and Dijkstra’s algorithm. This test
results show that with the number of nodes up to
30 000, Dijkstra’s algorithm and branch and bound
method have roughly the same running time.
However, with the vertices number increasing,
Dijkstra’s algorithm is showing significantly lower
results.
Figure 6: Dependence of the optimal route searching time
on the model dimension.
Graph of Figure 7 shows the results of Little’s
algorithm running time analysis for various numbers
of points.
For routes with the number of points more than 60
algorithm’s running time increases significantly.
Thereby, the optimal number of points to use that
algorithm is ≈60.
VEHITS 2018 - 4th International Conference on Vehicle Technology and Intelligent Transport Systems
280
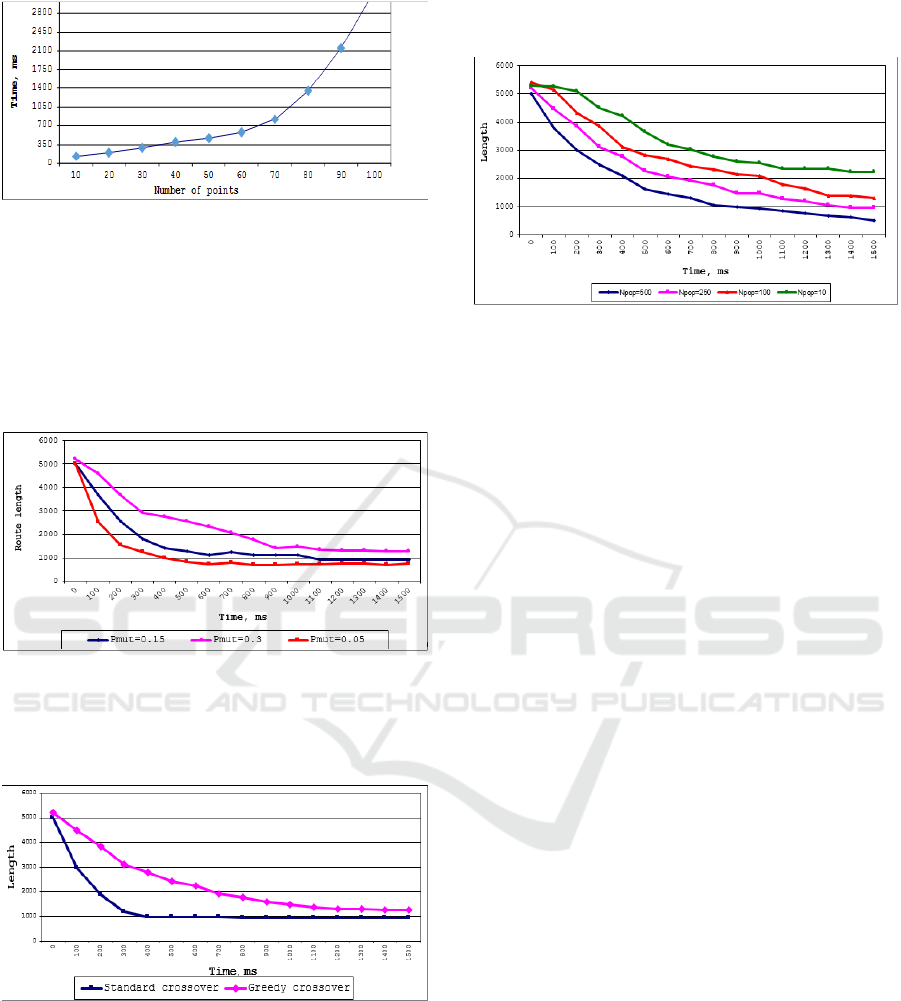
Figure 7: Little’s algorithm running time analysis.
Graphs of Figures 8 to 10 show the genetic
algorithm test results. An important parameter for
mutation operator usage is a mutation probability
р
тut.
. Graph of Figure 8 shows the dependence of the
route length on the algorithm running time for
different mutation probabilities (0.3, 0.15, 0.05). The
test was carried out for the 100 points graph.
Figure 8: Dependence of the route length on mutation
probability.
Algorithm’s performance for 100 points graph
various crossing over methods is shown in Figure 9.
Figure 9: Dependence of the route length on crossingover.
The graph shows that standard crossing over
method outputs a near-optimal result in less time than
“greedy crossover”. Convergence rate and accuracy
depends on the number of individuals specified
beforehand.
Figure 10 shows the genetic algorithm
convergence analysis for 10, 100, 250 and 500
individuals. The analysis shows that an increase in the
number of individuals leads to a more accurate result.
Figure 10: Dependence of the convergence rate on
individuals number.
6 CONCLUSIONS
This paper suggests the concept of “flight map”,
developed for providing safe and secure unmanned
aerial vehicles cargo delivery in urban areas.
The paper describes a graph-based transport
network model for UAVs route development;
requirements for unmanned aerial vehicles, landing
platforms and cargo parameters; system architecture
model and system components diagram.
The “Test Results” section presents the results of
various algorithms performance analysis and its
comparison depending on relevant parameters.
Proceeding from the results obtained the Little’s
algorithm is appropriate to use for optimal route
searching in the cases of 60-70 vertices present. When
performing the tests for the graphs of relatively small
dimensions, all the examined algorithms show equal
results on the average. For the cases with the mean
distances in a graph the adapted algorithm has an
advantage. And for the cases with maximum
distances in a graph (from one graph’s end to another)
the benefits of adapted algorithm are decreasing.
ACKNOWLEDGEMENTS
This research is financially supported by Funding
Institution: Foundation for Assistance to Small
Innovative Enterprises (FASIE) under the contract
№1773ГС1/25439.
The experimental research was conducted with
the use of equipment of the Science Production
Centre “Intelligent Transport Systems”.
“Flight Map” Modelling Intellectual Geoinformation System for Urban Areas Cargo Delivery by Unmanned Aerial Vehicle
281

REFERENCES
Garcia, E., Casbeer, D., 2017. Coordinated Threat
Assignments and Mission Management of Unmanned
Aerial Vehicles. In Cooperative Control of Multi-Agent
Systems: Theory and Applications. P. 141.
Tkachev, S.B., Krischenko, A.P., Kanatnikov, A.N., 2015.
Automatic generation of complex spatial UAV
trajectories and synthesis control. In Mathematics and
math modelling, 1(1), Pp 1-17. (In Russ.).
Bansal, S., Chen, M., Fisac, J. F., Tomlin, C. J., 2017. Safe
Sequential Path Planning of Multi-Vehicle Systems
Under Presence of Disturbances and Imperfect
Information. In American Control Conference.
Iswanto, Wahyunggoro, O., Cahyadi, A. I., 2017. Path
planning of decentralized multi-quadrotor based on
fuzzy-cell decomposition algorithm. In AIP Conference
Proceedings, 1831 (1). AIP Publishing.
Stepanov, D.N., 2015. Application of Gabor wavelets in the
problem of navigation of a UAV using a video camera.
In Fundamental research, 12(1). Pp 85-91. (In Russ.).
Antoniades, K., Ishizaka, A., Ries, J., 2017. A Multi-
Criteria Support System for UAV Maritime
Surveillance. In Highly Dynamic Environment.
Hayat, S., Yanmaz, E., Brown, T. X., Bettstetter, C., 2017.
Multi-objective UAV path planning for search and
rescue. In Robotics and Automation (ICRA), IEEE
International Conference. Pp. 5569-5574.
Vareldjan. K.S., Paramonov, A.I., Kirichek, R.V., 2015.
Optimization of UAV trajectory in flying sensory
networks. In Electrosvyaz, Pp. 20-25. (In Russ.).
Silva Arantes, J. D., Silva Arantes, M. D., Motta Toledo, C.
F., Júnior, O. T., Williams, B. C., 2017. Heuristic and
genetic algorithm approaches for UAV path planning
under critical situation. In International Journal on
Artificial Intelligence Tools, 26(01).
Golovnin, O., Mikheeva, T., Fedoseev, A., 2017. Intelligent
geographic information platform for transport process
analysis. In CEUR Workshop Proceedings, Vol. 1901.
Pp 78-85.
VEHITS 2018 - 4th International Conference on Vehicle Technology and Intelligent Transport Systems
282
