
Comparison of Landsat and ASTER in Land Cover Change
Detection within Granite Quarries
R. S. Moeletsi
1,2
and S. G. Tesfamichael
1
1
Department of Geography, Environmental Management and Energy Studies,
University of Johannesburg, Auckland Park, 2006, Johannesburg, South Africa
2
Mintek, 200 Malibongwe Drive, Randburg, 2125, South Africa
Keywords: Granite Quarries, Landsat, ASTER, Accuracy Assessment.
Abstract: This study evaluated and compared the utility of Landsat and ASTER in land cover change detection within
granite quarries. Landsat data used was acquired in 1998 and 2015 while ASTER data used was acquired in
2001 and 2013. Both Landsat and ASTER were classified using supervised and maximum likelihood
classification. Post-classification and Normalized Difference Vegetation Index change detection techniques
were applied to assess and measure changes in land cover caused by granite quarries. Overall classification
of ASTER was slightly higher than that obtained for Landsat (overall accuracy (OA) =79% and kappa 0.75vs.
OA=75% and kappa 0.71). Both Landsat and ASTER were able to assess land cover changes within granite
quarries. Change detection results revealed increase in granite quarries which subsequently resulted in
decrease in vegetation and bare land and increase in water bodies within the quarries. The study found ASTER
to be better at discriminating granite quarries from other land cover features and was able to detect small water
bodies within granite quarries due to higher spatial resolution of bands in the VNIR subsystem. On the
contrary, Landsat was found better at detecting changes in vegetation within granite quarries.
1 INTRODUCTION
Remote sensing techniques are useful in mapping,
monitoring and managing land cover changes related
to mining activities (López-Pamo et al., 1999).
Coupled with capabilities to cover large areas,
availability of historic data, availability of data at high
spatial and spectral resolution, the technology is
continuously contributing significantly to land
management initiatives (Rogan and Chen, 2004).
Several studies have used remotely sensed data
ranging from low to high spatial resolution sensors
such as MODIS, NOAA AVHRR, Landsat, ASTER,
SPOT, and IKONOS in change detection studies (Lu
et al., 2004). Even though the use of remotely sensed
data has been widely utilized in land use and land
cover change (LULCC), its applications in mapping
impacts of surface mining have not been extensively
explored (Latifovic, 2005). This paper therefore
compares utility of Landsat and ASTER satellite
sensors in land cover changes caused by granite
quarries located in the North West province of South
Africa.
Mining is an integral part of economic develop-
ment in many developing countries, however, it is
often associated with adverse environmental and
social impacts (Paull et al., 2006). Granite quarrying
in South Africa started in the late 1930s in
Bon-Accord area. Quarrying adversely affects
environment in various ways. Common
environmental impacts resulting from quarrying
activities include loss of vegetation, disruption and
destruction of natural habitat (Maponga and
Munyanduri, 2001), and can alter hydrological
systems (Darwish et al., 2011). It is therefore
important to monitor environmental variables related
to mining activities. Identifying and monitoring such
impacts contributes to sustainable development and
provides information regarding rehabilitation
measures, future site selection methods and
determining locations of abandoned and unreclaimed
quarries (Demirel et al., 2011).
2 STUDY AREA
Granite quarrying in South Africa occurs in the Main
Zone of the Rustenburg Layered Suite in the
Bushveld Igneous Complex. The area is dominated
Moeletsi, R. and Tesfamichael, S.
Comparison of Landsat and ASTER in Land Cover Change Detection within Granite Quarries.
DOI: 10.5220/0006675801870195
In Proceedings of the 4th International Conference on Geographical Information Systems Theory, Applications and Management (GISTAM 2018), pages 187-195
ISBN: 978-989-758-294-3
Copyright
c
2019 by SCITEPRESS – Science and Technology Publications, Lda. All rights reserved
187
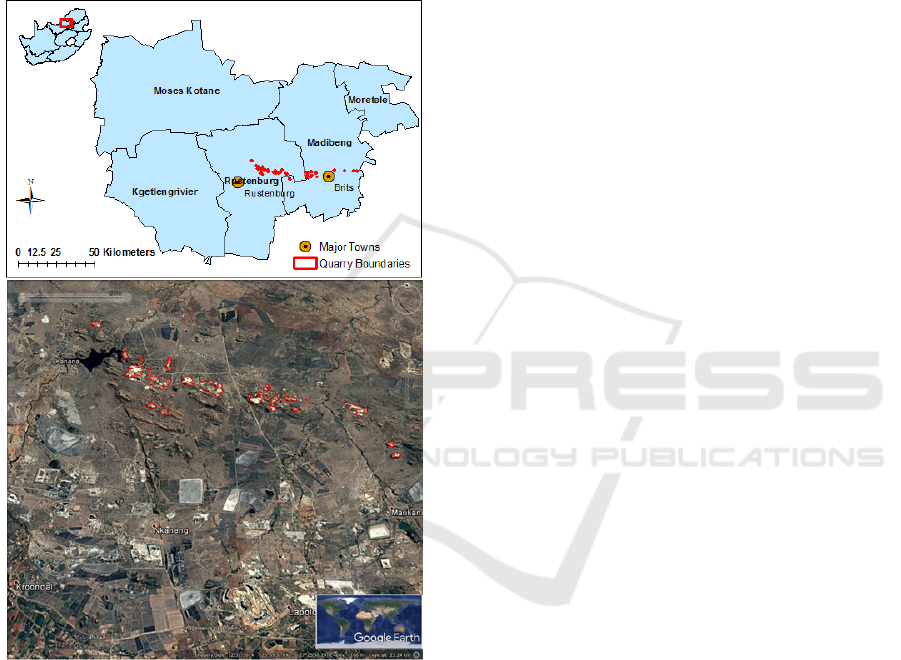
by gabbro and norite with interlayered anorthosite of
the pyramid Gabbro-Norite, Rustenburg Layered
Suite (Nex et al., 1998). The quarries are located
between Rustenburg and Brits towns in the North
West Province (Figure 1). Commercially, the word
granite refers to any crystalline rock exploited for use
in the construction and ornamental use (Dolley,
2007). Granite mining in the North West province
contributed 46 of the national mining of granite in
2008 (Lamprecht et al., 2011).
Figure 1: Maps showing (Top): Location of the study area
and granite quarries (Bottom): Landscape of quarries and
surrounding area.
3 METHODOLOGY
A minimum spatial coverage of 1 hectare and 200 m
distance between the quarries were specified for
quarry samples. The specification were set out to
avoid overlap of samples, to promote independent
comparison of quarries and to enhance detection with
spatial resolution of remote sensing data. As a result,
forty granite quarries were sampled for the study.
Since the launch of Google Earth
TM
in 2005, people
have been using it to explore the world around them
(Cha and Park, 2007). It provides images with high
spatial resolution (<2.5 m)
that are useful for land use
and land cover mapping (Hu et al., 2013). Sampling
was achieved using geographi-cal coordinates of
known quarries. The coordinates were overlain on
Google Earth
TM
to digitize the quarries and
subsequently convert the polygons to shapefiles in
ArcGIS
®
(ESRI 2016, ArcMap 10.4, Redlands,
California, USA). Digitization process was done with
the corresponding dates of acquired remote sensing
data and therefore, the year 2015 and 2013 were used
to digitize the quarries on Google Earth
TM
. Quarries
corresponding to remote sensing data acqui-red in
earlier years before 2005 could not be used for
digitization due to lack of data in Google Earth
TM
.
3.1 Remote Sensing Data
Data used in this study included Landsat images
acquired on the 16
th
March 1998 and 16
th
April 2015
while ASTER data was acquired on the 26
th
April
2001 and 11 October 2013. The data was acquired
from the United States Geological Survey
(https://earthexplorer.usgs.gov/). Attempts were
made to acquire images of same or close dates for
consistent comparison between Landsat and ASTER
data however, most of ASTER data was covered with
clouds and therefore only available cloud free data
was considered. The study preferred the use of data
acquired during high rainfall summer season when
vegetation is denser, however, unavailability of
suitable data necessitated the use of images outside of
this time period.
3.2 Data Processing
3.2.1 Image Registration of ASTER Data
Image registration process involves matching two or
more images which were taken from different sensors
at different times (Wahed et al., 2013). Accuracy in
image registration is important as this can
significantly affect the results of change detection
process. As a result, image registration accuracy
should be limited to half or one pixel in change
detection (Townshend et al., 1992). In this study, the
acquired ASTER data was firstly converted from
hierarchical data format (HDF) file to tagged image
file format (TIFF) file in ERDAS IMAGINE software
(ERDAS IMAGINE
®
2016, Hexagon Geospatial,
Norcross, USA). After converting ASTER data from
hdf to tiff format, image registration was performed
GISTAM 2018 - 4th International Conference on Geographical Information Systems Theory, Applications and Management
188

using automated registration technique in ArcGIS
®
10.4 on the 2001 and 2013 ASTER images using
Landsat 1998 and 2015 images as reference data.
Registration accuracy for both 2001 and 2013 images
were within one pixel in each dataset.
3.2.2 Radiometric Calibration
Radiometric calibration is an important step required
to improve quality of remotely sensed data by
removing factors that alters spectral properties of land
surface features (Pons et al., 2014). Both Landsat and
ASTER images were radiometrically calibrated using
absolute calibration method. This enables comparison
of images acquired at different times from different
sensors (Chander et al., 2009). Data was calibrated by
firstly converting the digital numbers (DNs) to at-
sensor spectral. The second step involved converting
at-sensor spectral radiance to exoatmospheric top of
atmosphere (TOA) reflectance (Chander et al., 2009).
Equations applicable Landsat data are explained by
(Chander et al., 2009) while those applicable for
ASTER data are provided by (Abrams and Hook,
2002).
3.2.3 Supervised Classification
Supervised classification was applied to multispectral
images created from Landsat and ASTER data. The
technique requires the user to select training samples
which are representative of the desired classes to be
identified. The quality of this classification method
depends highly on the quality of training classes
(Perumal and Bhaskaran, 2010). Supervised
classification involves three principle steps. The first
step involves defining training classes, the second
step is creation of signature file and the last step is
classification of the image (Lillesand et al., 2014).
Maximum likelihood classifier (MLC) algorithm was
used to classify multispectral images. This method
uses the training data by means of estimating means
and variances of the classes, which are used to
estimate probabilities and also consider the variability
of brightness values in each class (Perumal and
Bhaskaran, 2010). The effectiveness of MLC depends
highly on accuracy of training samples (Richards,
2012).
3.2.4 Accuracy Assessment
Accuracy assessment was carried out on the Landsat
2015 and ASTER 2013 classified images. Error
matrix was used to evaluate the accuracy of
classification. A random set of 189 points were
selected for error matrix. These points were overlain
on Google Earth
TM
; the name of each class was then
recorded using visual interpretation of land cover
features on Google Earth
TM
. The recorded class
names in the reference data were then compared to
classes generated from each image and the supervised
classification. Google Earth
TM
has been used in a
number of studies as a source of reference against
which classification could be compared (Cha and
Park, 2007; Rwanga and Ndambuki, 2017). Error
matrix was generated and accuracy assessment
parameters i.e. producer’s accuracy (measure of
omission errors), user’s accuracy (measure of
commission errors) and Kappa coefficient (measure
of agreement) were computed.
3.2.5 Change Detection
Change detection involves four major aspects: (1)
detecting that changes have occurred, (2) identify-ing
the nature of the change, (3) measuring the areal
extend of the change and (4) assessing the spatial
pattern of the change (Congalton and Green, 2008).
Various techniques used to perform change detec-tion
with digital imagery has been described by Singh
(1989). This study utilized post-classification and
Normalized Difference Vegetation Index (NDVI)
change detection techniques to assess land cover
changes within granite quarries. In post- classification
comparison, each image is classified independently
and then classification results are compared to
determine areas and magnitude of change (Singh,
1989). The NDVI has been widely used to measure
vegetation condition and biomass (Jiang et al., 2006).
It is defined as the difference between the near-
infrared band (NIR) and the red band divided by the
sum of these two bands (Tucker, 1979). The results of
NDVI range between -1 and +1, where negative
values correspond to absence of vegetation and
positive values correspond to vegetated zones.
The higher the index, the greater the chlorophyll
content of the target (Pettorelli, 2013).
4 RESULTS
4.1 Accuracy Assessment
Error matrix for Landsat image is presented in Table
1. Overall accuracy obtained for Landsat data was
75% with Kappa coefficient of 0.71. Error matrix
demonstrated that Water bodies had perfect producer’s
and user’s accuracy. Granite quarries had moderate
producer’s accuracy due to confusion with Exposed
rock formation, Bare land, Built-up land and Other
Comparison of Landsat and ASTER in Land Cover Change Detection within Granite Quarries
189
mining areas. Results for user’s accuracy however,
were very high with limited confusion from Other
mining areas. Results of other classes showed
misclassification with other classes i.e.: Bare land and
Vegetation had good producer’s accuracies but were
also confused with each other. Other mining areas were
confused with Bare land, Built-up land and Granite
quarries. Exposed rock formation resulted in low
producer’s accuracy due to confusion with Bare land
and Built-up land. Similarly, Built-up land was
confused with Bare land and that resulted in low
producer’s accuracy of Built-up land.
Overall accuracy obtained for ASTER imagery
was 79% with kappa coefficient of 0.75 (Table 2).
Similar to Landsat classification, there was also
confusion in classification of features. Water bodies
had perfect producer’s and user’s accuracy.
Producer’s accuracy for Granite quarries was high,
however, was confused with Vegetation. Misclassi-
fication of Exposed rock formation was observed due
to Granite quarries, Bare land, Built-up land and
Vegetation. Relatively low producer’s accuracy was
obtained for Other mining areas, due to mostly
confusion with Granite quarries, Built-up land, Bare
land and Vegetation. On the contrary, user’s accura-
cy for Other mining areas was perfect. Similarly,
Exposed rock formation had almost perfect user’s
accuracy with limited confusion observed with Bare
land. Granite quarries had high user’s accuracy, but
were confused with Exposed mining areas, Vegeta-
tion, and Other mining areas. Low user’s accuracy in
Bare land was caused by misclassification from Other
mining area, Built-up land, Exposed rock formation
and Vegetation. Similarly, low user’s accuracy in
Vegetation was a result of confusion caused by
Granite quarries, built-up land, Bare land, Other
mining areas and Exposed rock formation.
Table 1: Error matrix of classification derived from Landsat imagery in 2015.
Reference Data
Classified Data
WB GQ ER BUL BL V OMA Tot.
UA (%)
WB 10 0 0 0 0 0 0 10 100
GQ 0 20 0 0 0 0 1 21 95
ER 0 3 19 0 0 0 0 22 86
BUL 0 2 2 19 0 0 3 26 73
BL 0 1 9 11 24 3 4 52 46
V 0 0 0 0 6 27 0 33 82
OMA 0 3 0 0 0 0 22 25 88
Tot. 10 29 30 30 30 30 30 141
PA (%) 100 69 63 63 80 90 73
Overall accuracy = 75%, Kappa = 0.71
Key: WB=Water Bodies, GQ= Granite Quarries, ER= Exposed Rock Formations, BUL=Built-Up Land, BL=Bara Land,
V=Vegetation, OM= Other Mining Areas, Tot. =Total, PA=Producer’s Accuracy, UA= User’s Accuracy.
Table 2: Error matrix derived from ASTER imagery taken in 2013 (Key definitions similar as in Table 2).
Reference Data
Classified Data
WB GQ ER BUL BL V OMA Tot. UA (%)
WB 10 0 0 0 0 0 0 10 100
GQ 0 26 1 0 0 1 1 29 90
ER 0 0 24 0 1 0 0 25 96
BUL 0 0 1 21 0 1 3 26 81
BL 0 0 2 6 24 4 3 39 62
V 0 3 2 3 4 26 4 42 62
OMA 0 0 0 0 0 0 19 19 100
Tot. 10 29 30 30 29 32 30 150
PA (%) 100 90 80 70 83 81 63
Overall accuracy = 79%, Kappa = 0.75
GISTAM 2018 - 4th International Conference on Geographical Information Systems Theory, Applications and Management
190
4.2 Post-classification Change
Detection
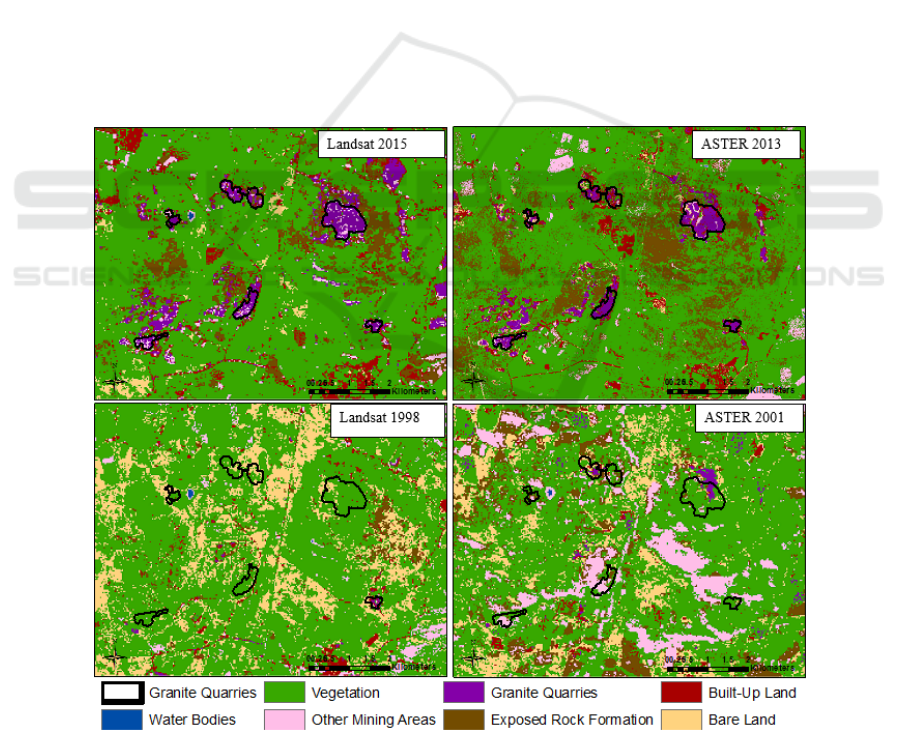
Figure 2 shows an example of land cover change
within granite quarry boundaries on a zoomed portion
of the study area. Seven land cover types generated
from Landsat and ASTER classification analysis
included (1) Water bodies, (2) Vegetation (3) Other
mining areas (4) Granite quarries, (5) exposed rock
formation, (6) Built-up land and (7) Bare land. The
results from Landsat data classification in the whole
study area revealed that dominant land cover types in
1998 were Vegetation, Bare land, natural Water
bodies and Exposed rock formation with moderate
occurrences of Granite quarries. In the year 2015
there was an increase in Granite quarries, Built-up
land as well as Water bodies inside the quarries. A
decrease in Vegetation and Bare land was observed in
the year 2015. Figure 2 shows portions of the study
area where development of granite quarries evolved
(2015) on the land that did not have quarries before
(1998).
Results of classification of ASTER images
revealed that Granite quarries were lesser in 2001
compared to the year 2013. Land cover in 2001 was
dominated by Vegetation and Bare land, natural
Water bodies, Exposed rock formation and to a lesser
extent, covered with granite quarries. Classification
of 2013 image however, revealed an increase in
Granite quarries relative to those detected in 2001 as
well as an increase in water bodies inside the quarries.
The 2013 image also revealed loss in Bare land and
increase in Exposed rock formation. Similarly, Figure
2 shows a portion of land cover that did not have
granite quarries in 2001 but evolved in the year 2013.
4.2.1 Quantitative Measures of Land Cover
change
The measure of areal extent of land cover change
based on forty quarries between 1998 and 2015 for
Landsat is given in Table 3. The results reveal
significant increase in Granite quarries which
subsequently resulted in accumulation of Water
bodies. Increase in Granite quarries also resulted in
significant loss of Vegetation and Bare land.
Figure 2: Land cover distributions created using supervised classification. Left images: land cover change within granite
quarries derived from Landsat imagery (1998 and 2015). Right images: land cover change within granite quarries derived
from ASTER imagery (2001 and 2013).
Comparison of Landsat and ASTER in Land Cover Change Detection within Granite Quarries
191
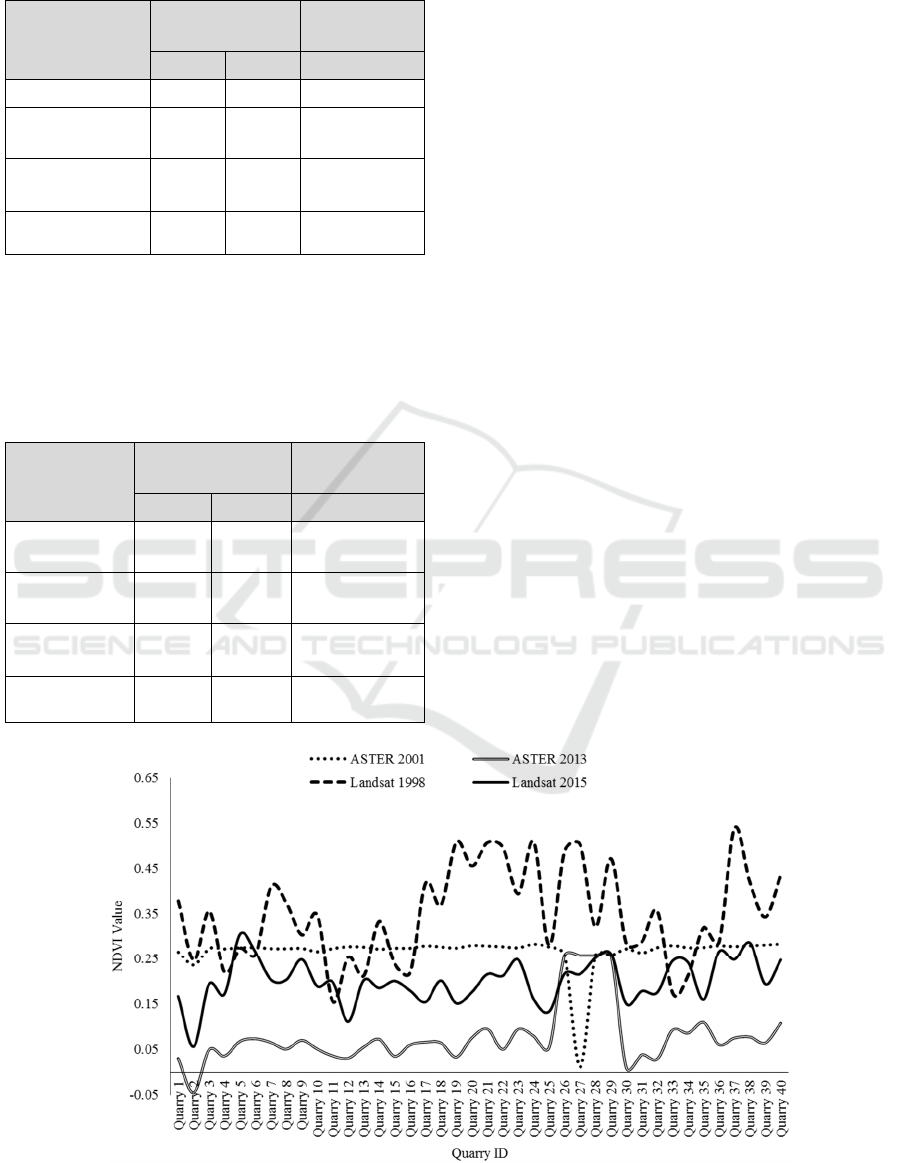
Table 3: Measure of land cover change within granite
quarries based on Landsat classification data.
Classes
Area of classes
(ha)
Difference
(ha)
1998 2015 2015-1998
Water Bodies 0.2 2.07 1.9
Granite
Quarries
433.5 910.4 476.9
Bare
Land
19.2 2.7 -16.5
Vegetation 793.7 313.1 -480.6
Similarly, the measure of change within granite
quarries using ASTER data revealed more or less the
same as those obtained from Landsat data.
Table 4 presents quantitative measure of land
cover change based on ASTER data.
Table 4: Measure of land cover change using ASTER data.
Classes
Area of classes
(ha)
Difference
(ha)
2001 2013 2013-2001
Water
Bodies
0.2 2.4 2.23
Granite
Quarries
213.1 745.1 531.9
Bare
Land
219.5 157.4 -62.1
Vegetation 704.2 236.5 -467.7
Increase in Water bodies as detected by ASTER is
more relative to results obtained from Landsat. There
was a significant increase in Granite quarries while
Vegetation and Bare land decreased significantly.
4.3 Change Detection using NDVI
Comparison of mean NDVI values within granite
quarries using Landsat and ASTER data is presented
in Figure 3. High mean NDVI values are observed in
the year 1998 indicating more presence of green
vegetation than in 2015. Mean NDVI values within
quarries in 1998 range from 0.17 to 0.54 while for
quarries in 2015 the range is between 0.05–0.3.
Majority of quarries in 2001 have mean NDVI values
above 0.25 while in 2013 majority have mean NDVI
values below 0.1. Quarry 27 shows lowest mean
NDVI value in the year 2001 whereas in 2013 and
2015, the quarry shows high mean NDVI values. This
is a typical example of an abandoned quarry where
revegetation is taking place. One quarry (Quarry #1)
was sampled to evaluate NDVI pattern based on
individual pixels within the quarry. NDVI histogram
of Landsat data based on 322 pixels revealed that 79%
of pixels in the year 1998 have NDVI values above
0.29. On the contrary, 45% of pixels in the year 2015
have NDVI values equal or less than 0. 148 while
other pixels show distribution across a range of NDVI
values.
Analysis of NDVI values using ASTER data was
based on 1296 pixels in the same quarry. Results showed
that 100% of the pixels in the year 2013 have NDVI
values between 0 and 0.233 while majority of pixels in
the year 2001 are distributed above 0.233 NDVI values.
Figure 3: Comparison of mean NDVI values within granite quarries using Landsat and ASTER data.
GISTAM 2018 - 4th International Conference on Geographical Information Systems Theory, Applications and Management
192
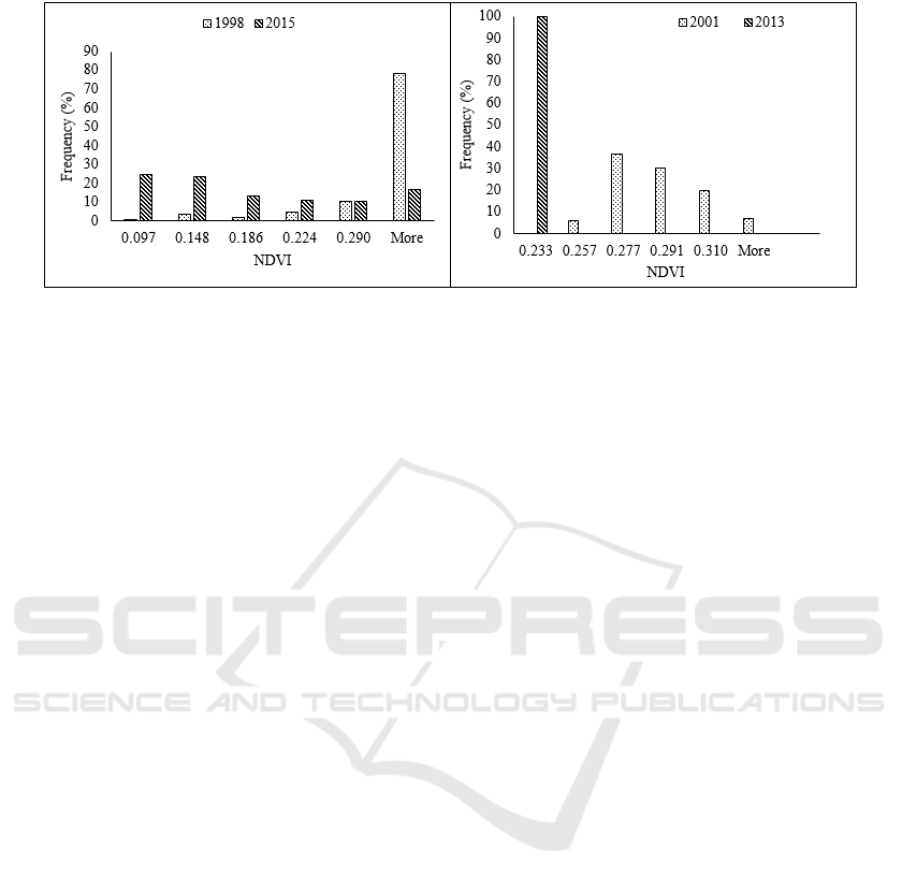
Figure 4: NDVI frequency distribution graphs for (left) Landsat data suing 322 pixels at 30 m spatial resolution and (right)
ASTER data using 1296 pixels at 15 m spatial resolution.
5 DISCUSSIONS
The aim of this study was to compare utility of
Landsat and ASTER in land cover change detection
within granite quarries. Both Landsat and ASTER
proved effective in mapping and detecting land cover
changes within granite quarries. Misclassifica-tion of
classes was encountered in both classification of
Landsat and ASTER imagery. Land cover change
detection using both satellite sensors revealed a
significant increase in Granite quarries. This increase
subsequently resulted in loss of Vegetation and Bare
land. Expansion of Granite quarries also resulted in
accumulation of Water bodies inside the quarries.
Mouflis et al. (2008) and Koruyan et al. (2012) have
also demonstrated capabilities of Landsat and
ASTER in monitoring land cover changes caused by
expansion in marble quarries.
NDVI change detection analysis revealed
decrease in green Vegetation cover within the
acquired data period for both Landsat and ASTER.
Results of NDVI derived from Landsat indicated that
mean NDVI comparison between 1998 and 2015
varies across all quarry samples. Results obtained
from ASTER data, showed that majority of quarries
(95%) in 2001 displayed mean NDVI values between
0.25-0.3 while for 2013, majority (90%) of quarries
had mean NDVI values below 0.1. Decrease in green
Vegetation within granite quarries indicates the
proliferation of quarrying activity over the acquired
data periods. On the contrary, an increase in
Vegetation on other quarries indicates revegetation
process in abandoned quarries.
Although Landsat and ASTER were able to map
land cover changes within granite quarries. ASTER
data was found to be more effective in discriminating
Granite quarries and small Water bodies within
granite quarries. This is attributed to the higher spatial
resolution of ASTER in the visible and near infrared
of electromagnetic spectrum than Landsat’s is (15 m
vs 30 m). On the other hand, analysis of NDVI change
detection revealed that Landsat sensor was better at
detecting green Vegetation compared to results
obtained using ASTER data.
Similar observations were recorded by Chevrel et
al. (2005) who demonstrated capabilities of ASTER
data in identifying and mapping surface disturbances
due to mining. Charou et al. (2010), also demonstrate-
ed the effectiveness of ASTER in monitoring
anomalies of water surfaces compared to Landsat and
SPOT. Similarly, Musa and Jiya (2011) demonstrated
the effectiveness of Landsat in assessing mining
activities impacts on vegetation using NDVI.
6 CONCLUSION
Comparison of Landsat and ASTER data in change
detection within granite quarries was evaluated in this
study. Overall accuracy of classification using
supervised classification and MLC for Landsat was
75% with kappa coefficient of 0.71, while ASTER
returned a slightly better overall classification
accuracy (79%) and kappa coefficient (0.75). Land
cover mapping using Landsat data had limitation in
detecting water bodies within granite quarries due to
inadequate spatial resolution of the image relative to
water body sizes. Vegetation cover was well
discriminated in Landsat as compared to ASTER
data. ASTER was found more effective in delineating
granite quarries as compared to Landsat and this is
attributed to the high spatial resolution of ASTER in
Comparison of Landsat and ASTER in Land Cover Change Detection within Granite Quarries
193

the visible and near infrared of the electromagnetic
spectrum.
REFERENCES
Abrams, M. and Hook, S. (2002) ‘ASTER User Hand-book
Version 2’, Jet Propulsion, 4800, pp. 1–135.
Cha, S. and Park, C. (2007) ‘The utilization of google earth
images as reference data for the multitemporal land
cover classification with MODIS data of north Korea’,
Korean Journal of Remote Sensing, pp. 483–491.
Chander, G., Markham, B. L. and Helder, D. L. (2009)
‘Summary of current radiometric calibration
coefficients for Landsat MSS, TM, ETM+, and EO-1
ALI sensors’, Remote Sensing of Environment. Elsevier
Inc., 113(5), pp. 893–903.
Charou, E., Stefouli, M., Dimitrakopoulos, D., Vasiliou, E.
and Mavrantza, O. D. (2010) ‘Using remote sensing to
assess impact of mining activities on land and water
resources’, Mine Water and the Environment, 29(1), pp.
45–52.
Chevrel, S., Bourguignon, A., Cottard, F. and Itard, Y.
(2005) ‘Exploitation of ASTER imagery in mining-
related environmental management’, in Pecora 16 -
Global Priorities in Land Remote Sensing. Sioux Falls,
South Dakota, pp. 1–10.
Congalton, R. G. and Green, K. (2008) Assessing the
Accuracy of Remotely Sensed Data: Principles and
Practices. Second Edi. Boca Raton: CRC Press.
Darwish, T., Khater, C., Jomaa, I., Stehouwer, R., Shaban,
A. and Hamze, M. (2011) ‘Environmental impact of
quarries on natural resources in Lebanon’, Land and
degradation and Development, 22, pp. 345–358.
Demirel, N., Emil, M. K. and Duzgun, H. S. (2011) ‘Surface
coal mine area monitoring using multi-temporal high-
resolution satellite imagery’, International Journal of
Coal Geology. Elsevier B.V., 86(1), pp. 3–11.
Dolley, T. P. (2007) ‘Stone, Dimension’. USGS Minerals
Yearbook, 1, pp. 1–11.
Hu, Q., Wu, W., Xia, T., Yu, Q., Yang, P., Li, Z. and Song,
Q. (2013) ‘Exploring the use of google earth imagery
and object-based methods in land use/cover mapping’,
Remote Sensing, 5(11), pp. 6026–6042.
Jiang, Z., Huete, A. R., Chen, J., Chen, Y., Li, J., Yan, G.
and Zhang, X. (2006) ‘Analysis of NDVI and scaled
difference vegetation index retrievals of vegetation
fraction’, Remote Sensing of Environment, 101(3), pp.
366–378. doi: 10.1016/j.rse.2006.01.003.
Koruyan, K., Deliormanli, a. H., Karaca, Z., Momayez, M.,
Lu, H. and Yalçin, E. (2012) ‘Remote sensing in
management of mining land and proximate habitat’,
Journal of the Southern African Institute of Mining
and Metallurgy, 112(7), pp. 667–672.
Lamprecht, A. J. H., Cilliers, S. S., Götze, A. R. and Du
Toit, M. J. (2011) ‘Phytosociological description of
norite koppies in the Rustenburg area, North-West
Province and refinement of the distribution of the
Norite Koppies Bushveld on the national vegetation
classification map of South Africa’, Bothalia, 41(2), pp.
327–339.
Latifovic, R. (2005) Satellite RemoteSensing in Assessing
the Environmental Impactsof Large-Scale Surface
Mining. PhD Thesis, Department De Genie Des Mines,
De La Metallurgie Et Des, Univerite Laval Quebec.
Lillesand, T., Kiefer, R. W. and Chipman, J. (2014) Remote
Sensing and Image Interpretation. 7th edn. New York:
John Wiley & Sons.
López-Pamo, E., Barettino, D., Antón-Pacheco, C., Ortiz,
G., Arránz, J. C., Gumiel, J. C., Martínez-Pledel, B.,
Aparicio, M. and Montouto, O. (1999) ‘The extent of
the Aznalcollar pyritic sludge spill and its effects on
soils’, Science of the Total Environment, 242(1–3), pp.
57–88.
Lu, D., Mausel, P., Brondizio, E. and Moran, E. F. (2004)
‘Change detection techniques’, International Journal of
Remote Sensing, 25(February), pp. 2365–2407.
Maponga, O. and Munyanduri, N. (2001) ‘Sustainability of
the dimension stone industry in Zimbabwe—challenges
and opportunities’, Natural Resources Forum, 25(3),
pp. 203–213.
Mouflis, G. D., Gitas, I. Z., Iliadou, S. and Mitri, G. H.
(2008) ‘Assessment of the visual impact of marble
quarry expansion (1984-2000) on the landscape of
Thasos island, NE Greece’, Landscape and Urban
Planning, 86(1), pp. 92–102.
Musa, H. D. and Jiya, S. N. (2011) ‘An Assessment of
Mining Activities Impact on Vegetation in Bukuru Jos
Plateau State Nigeria Using Normalized Differential
Vegetation Index (NDVI)’, Journal of Sustainable
Development, 4(6), pp. 150–159.
Nex, P. A., Kinnaird, J. A., Ingle, L. J., Van Der vyver, B.
A. and Cawthorn, R. G. (1998) ‘A new stratigraphy for
the main zone of the Bushveld Complex, in the
Rustenburg area’, South African Journal of Geology,
101(3), pp. 215–223.
Paull, D., Banks, G., Ballard, C. and Gillieson, D. (2006)
‘Monitoring the Environmental Impact of Mining in
Remote Locations through Remotely Sensed Data’,
Geocarto International, 21(1), pp. 33–42.
Perumal, K. and Bhaskaran, R. (2010) ‘Supervised
classification performance of multispectral images’,
Journal of Computing, 2(2), pp. 124–129.
Pettorelli, N. (2013) The Normalized Difference Vegetation
Index. New York, USA: OUP Oxford.
Pons, X., Pesquer, L., Cristóbal, J. and González-Guerrero,
O. (2014) ‘Automatic and improved radiometric
correction of landsat imageryusing reference values
from MODIS surface reflectance images’,
International Journal of Applied Earth Observation
and Geoinformation. Elsevier B.V., 33(1), pp. 243–
254.
Richards, J. A. (2012) Remote Sensing Digital Image
Analysis: An Introduction. Berlin Heidelberg: Springer
Science & Business Media.
Rogan, J. and Chen, D. (2004) ‘Remote sensing technology
for mapping and monitoring land-cover and land-use
change’, Progress in Planning, 61, pp. 301–325.
GISTAM 2018 - 4th International Conference on Geographical Information Systems Theory, Applications and Management
194

Rwanga, S. S. and Ndambuki, J. M. (2017) ‘Accuracy
Assessment of Land Use/Land Cover Classification
Using Remote Sensing and GIS’, International Journal
of Geosciences, 8(4), pp. 611–622.
Singh, A. (1989) ‘Review Article Digital change detection
techniques using remotely-sensed data’, International
Journal of Remote Sensing, 10(6), pp. 989–1003.
Townshend, J. R. G., Gurney, C., McManus, J. and Justice,
C. O. (1992) ‘The Impact of Misregistration on Change
Detection’, IEEE Transactions on Geoscience and
Remote Sensing, 30(5), pp. 1054–1060.
Tucker, C. J. (1979) ‘Red and photographic infrared linear
combinations for monitoring vegetation’, Remote
Sensing of Environment, 8(2), pp. 127–150.
Wahed, M., El-tawel, G. S. and Gad El-karim, A. (2013)
‘Automatic Image Registration Technique of Remote
Sensing Images’, International Journal of Advanced
Computer Science & Applications, 4(2), pp. 177–187.
Comparison of Landsat and ASTER in Land Cover Change Detection within Granite Quarries
195
