
Quantifying Land Cover Changes Caused by Granite Quarries from
1973-2015 using Landsat Data
Refilwe Moeletsi
1,2,*
and Solomon Tesfamichael
1
1
Department of Geography, Environmental Management and Energy Studies, University of Johannesburg,
Auckland Park, 2006, Johannesburg, South Africa
2
Mintek, 200 Malibongwe Drive, Randburg, 212, South Africa
Keywords: Remote Sensing, Land Cover Changes, Granite Quarries, Landsat, Supervised Classification.
Abstract: Environmental monitoring is an important aspect in sustainable development. The use of remote sensing in
the mining industry has evolved significantly and allows for improved mapping and monitoring
environmental impacts related to mining activities. The aim of this study was to measure land cover changes
caused by granite quarrying activities located between Rustenburg and Brits towns, North West Province,
South Africa using Landsat time series data. Landsat data used in the study were acquired in the years 1973,
1986, 1998 and 2015. Each image was classified using supervised classification and change detection was
subsequently applied to measure land cover changes. Furthermore, the normalized difference vegetation index
(NDVI) was used to highlight the dynamics in vegetation in the quarries. Accuracy assessment of the
classification resulted in an overall accuracy and Kappa coefficient of 75% and 0.71, respectively. The results
of post –classification change detection revealed a significant increase of 907.4 ha in granite quarries between
1973 and 2015. The expansion in granite quarries resulted in development of water bodies (2.07 ha) within
the quarries. Correspondingly, there were significant losses in vegetation (782.1 ha) and bare land (119 ha).
NDVI results showed variability in mean NDVI values within the digitized quarries. The overall mean NDVI
values trends showed that most granite quarries had the highest vegetation in 1998, while the least vegetation
cover was observed 1986.
1 INTRODUCTION
Land cover monitoring and management is an
important concept in sustainable development
(Demirel et al., 2011). Increases in human-induced
land use and land cover changes have called for the
need to monitor and quantify environmental changes
of such activities (Pierre and Sophie, 2016).
Mining activity is amongst anthropogenic factors
that lead to environmental degradation. This activity
has resulted in many organizations implementing
systems aimed at monitoring and managing
environmental impacts of surface mining operations
(Latifovic, 2005; Demirel et al., 2011). Monitoring
activities that lead to environmental degradation
requires continuous observations using automated
techniques such as remote sensing (Günther et al.,
1995; Lein, 2014). In recent years, remotely sensed
data have been applied in environmental management
of mining operations and areas affected by mining
(Paull et al., 2006). Latifovic et al. (2005), used
Landsat data to investigate land cover changes
resulting from oil sands mining development. Duncan
and Kuma (2009), assessed land use changes in an
open pit gold mining. Similarly, Charou et al. (2010),
used data acquired from Landsat, SPOT and ASTER
satellites sensors to monitor impacts of mining on
water resources and land use in Greece. Musa and
Jiya (2011) investigated the impacts of tin mining on
vegetation cover using Landsat data. Mouflis et al.
(2008), conducted a study to investigate the impacts
of marble quarry expansion using Landsat remotely
sensed data. In the same way, Koruyan et al. (2012)
employed ASTER and Landsat data to investigate
impact of marble quarries expansion on vegetation.
Granite quarrying activity in South Africa started
in Bon-Accord area, near Pretoria in the late 1930s.
Since then, the quarrying industry increased
drastically owing its expansion to improved mining
technologies. Quarrying activity however, results in
severe environmental impacts (Abu and Abdelall,
2014). Damage to biodiversity is the most common
196
Moeletsi, R. and Tesfamichael, S.
Quantifying Land Cover Changes Caused by Granite Quarries from 1973-2015 using Landsat Data.
DOI: 10.5220/0006675901960204
In Proceedings of the 4th International Conference on Geographical Information Systems Theory, Applications and Management (GISTAM 2018), pages 196-204
ISBN: 978-989-758-294-3
Copyright
c
2019 by SCITEPRESS – Science and Technology Publications, Lda. All rights reserved
environmental impact associated with quarrying
activities (Lameed and Ayodele, 2011). Removal of
vegetation, destruction of natural habitat and
wetlands are some of the direct biological impacts
caused by quarrying (Koppe, 1997). Quarrying
activities can also have severe impacts on landscape
patterns (Mouflis et al., 2008), hydrological systems
through sediments erosion (Gonzalez et al., 2006),
noise and air pollution through blasting and drilling
(Jain, 2015). In the present study, we evaluated the
effectiveness of remote sensing techniques in
monitoring land cover changes within granite
quarries between Brits and Rustenburg towns in the
North West Province, South Africa. The objective of
the study involves utilizing Landsat time series data
over the period of 42 years (1973-2015) to assess land
cover changes. Assessing and monitoring impacts of
quarrying and mining on the environment is critical
in achieving the goals of sustainable development.
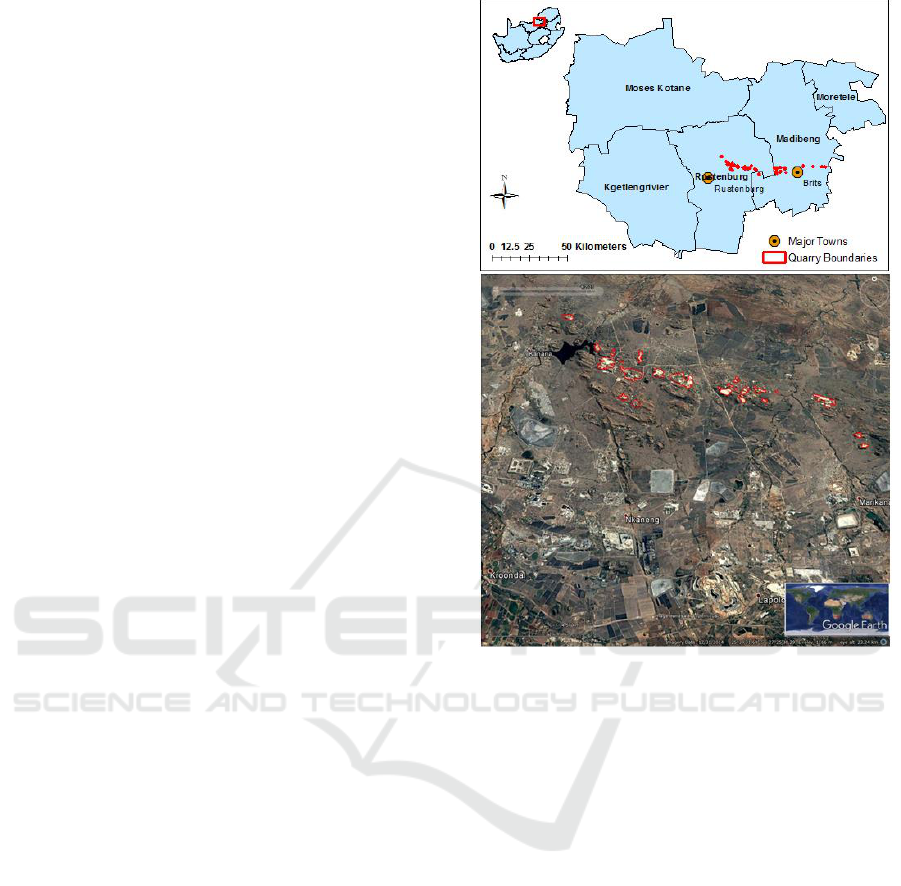
2 STUDY AREA
The study area is located between two towns namely
Rustenburg and Brits which are found in the North
West Province, South African (Figure 1). The area
was selected based on the geology and the known
location of the granite quarries. The geology of the
area is dominated by the rock of the Bushveld Igneous
Complex (BIC) which constitutes the most
voluminous mafic layered intrusion in the world
(Cawthorn et al., 2006). Granite deposits of interest
to the study are found in the Main Zone of the
Rustenburg Layered Suite of the BIC. The Main Zone
comprises of a thick succession of norite and gabbro-
norite, with minor anothorsite and pyroxenite layers
(Nex et al., 1998; Cawthorn et al., 2006).
3 METHODOLOGY
3.1 Sampling Design and Reference
Data
Quarries were sampled based on their spatial
coverage and the distance between them. A minimum
distance of 200 m between the quarries and spatial
coverage of 1 hectare were set out as a limit for
quarries analysed in this study. This was to avoid
overlap of samples and to enhance comparison with
the spatial resolution of remotely sensed data.
Consequently, forty quarries were selected for the
study. The use of accurate reference data is essential
Figure 1: Location of study area and Google EarthTM
image showing granite quarries and surrounding landscape.
to calibrate and evaluate land cover classification in
remote sensing (Lillesand et al., 2014). As a result,
Google Earth
TM
was used as a source of reference data
for the study. The high spatial resolution offered by
Google Earth
TM
allows for easy discrimination of
major natural land cover features as well as built
environments, including houses, industrial facilities
and roads. Granite quarries were located by using
geographical coordinates of known granite quarries.
The coordinates were overlain on Google Earth
that
aided digitizing process and were subsequently
converted to shapefiles in ArcGIS
®
(ESRI 2016,
ArcMap 10.4, Redlands, California, USA). Google
Earth
TM
images used for digitizing granite quarries
were acquired in April 2015 corresponding with
remotely sensed data used in the study. Google Earth
was launched in 2005 (Potere, 2008) and therefore,
digitization could not be done for dates earlier than
that.
3.2 Data Acquisition
A series of Landsat data acquired from the United
Quantifying Land Cover Changes Caused by Granite Quarries from 1973-2015 using Landsat Data
197
States Geological Survey (https://earthexplorer.
usgs.gov/) was used for this study. Landsat was
preferred for this study due to the availability of
historic dataset. In addition, several studies have
shown the effectiveness of Landsat imagery in land
cover mapping and monitoring of mining
environments as discussed in the previous section.
The list of Landsat data used in the study is given in
Table 1.
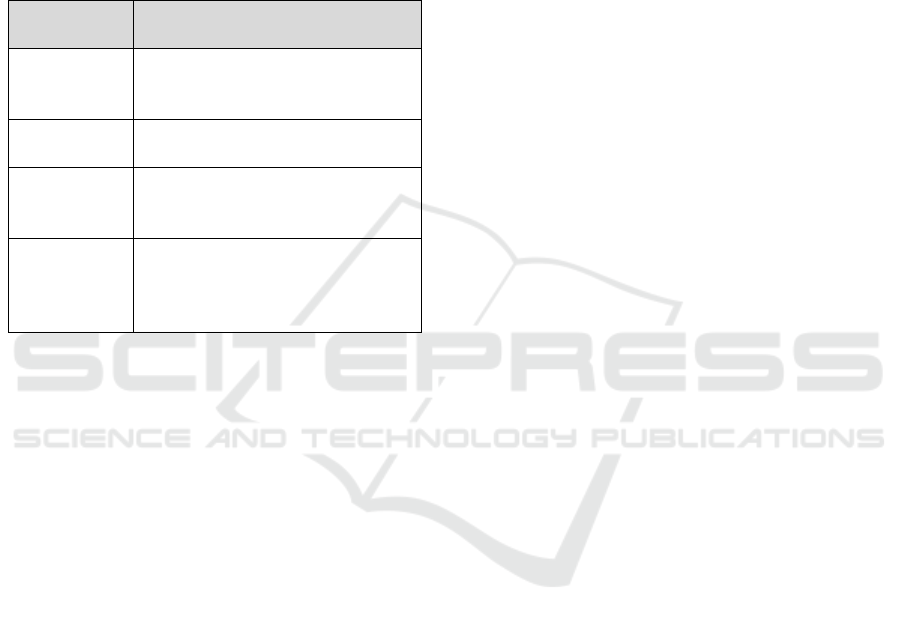
Table 1: Landsat data used in the study.
Image dates
Sensor
10 March
1973
Landsat 1 Multispectral Scanner
18 May
1986
Landsat 5 Multispectral Scanner
16 March
1998
Landsat 5 Thematic Mapper
16 April
2015
Landsat 8 Operational Land
Imager/Thematic Infrared
Sensor
3.3 Processing and Analysis
3.3.1 Radiometric Calibration
The Landsat images were radiometrically calibrated
using absolute calibration method. This method
enables comparison of images acquired at different
times from different sensors (Chander et al., 2009).
Data was calibrated by firstly converting the Digital
Numbers (DNs) to at-sensor spectral radiance. The
second step involved converting at-sensor spectral
radiance to exoatmospheric Top of Atmosphere
(TOA) reflectance using equations adopted from
(Chander et al., 2009).
3.3.2 Image Classification
Classification of multispectral images was achieved
using supervised classification method. Supervised
classification depends on the user to identify areas on
the image that are known to belong to each land cover
category. The most common algorithm used for
supervised classification is the maximum likehood
classifier (MLC) algorithm (Sun et al., 2013) which
was also used for this study.
3.3.3 Accuracy Assessment
Accuracy assessment is necessary to measure the
degree of correctness in image classification (Foody,
2002). It is considered to be the most important step
in land cover change detection studies (Congalton and
Green, 2008). Error matrix was used to evaluate the
classification accuracy. Error matrix is a square of
array numbers set out in rows and columns which
express the number of samples allocated to each land
cover feature relative to reference data. Accuracy
assessment in this study was evaluated using
reference data obtained from Google Earth
TM
. A
random set of 189 points were overlaid on Google
Earth
TM
, the name of each class was then recorded
using visual interpretation of features on Google
Earth. The recorded class names in the reference data
were then compared to classes generated from
Landsat using supervised classification. An error
matrix was then generated and subsequently, overall,
producer’s and user’s accuracies were computed.
Kappa coefficient is a common technique used in
accuracy assessment to measure the difference
between the actual agreement and chance agreement
in the error matrix (Congalton and Green, 2008). The
results of kappa ranges from -1 to +1 where positive
one indicates perfect agreement, zero indicates
change agreement while a negative value indicates
less than chance agreement (Fleiss and Cohen, 1973;
Viera and Garrett, 2005).
3.3.4 Change Detection
In land use and land cover (LULC) investigations, the
purpose of change detection is to detect and define
location of changed areas when comparing images
from different times and to measure the amount of
change (Singh, 1989). There are various methods of
change detection such as image differencing, image
regression, vegetation index differencing, post
classification comparison, image rationing etc. (Mas,
1999; Lu et al., 2004). This study used post
classification and normalized difference vegetation
index change detection methods to evaluate land
cover changes within granite quarries.
Post-classification
Post-classification technique involves classification
of each of the images independently, followed by a
comparison of the corresponding pixel labels to
identify areas where change has occurred (Singh,
1989; Deer, 1995). Post-classification method was
applied on the multispectral images to quantify land
GISTAM 2018 - 4th International Conference on Geographical Information Systems Theory, Applications and Management
198

cover changes within the 40 digitized granite
quarries.
Normalized Difference Vegetation Index
(NDVI)
Normalized Difference Vegetation Index is a widely
known index for measuring vegetation vigour from
spectral data (Gandhi et al., 2015). NDVI is defined
as the ratio of the difference between the near-
infrared band (NIR) and the red band, and the sum of
these two bands (Tucker, 1979). NDVI is aimed at
separating healthy green vegetation from all other
features (such as soil moisture, man-made features
and water) and therefore any feature with prominent
vegetation would yield high NDVI value. Very low
NDVI values (0.1 and below) correspond to barren
areas, sand or snow. Moderate values represent land
cover types such as shrubs and sparse grassland (0.2
to 0.3) (Lam et al. 2008; Pettorelli 2013; Gandhi et al.
2015) while high values indicate dense vegetation
(0.6 to 0.8) (Jackson and Huete, 1991). Bare soil is
represented with NDVI values close to 0 and water
bodies are presented with negative NDVI values
(Gandhi et al., 2015).
4 RESULTS
4.1 Accuracy Assessment
Error matrix presented in Table 2 was completed only
on imagery acquired in 2015 due to availability of
reference data during the same time. The overall
accuracy was 75% with a kappa coefficient of 0.71,
while Water bodies had perfect producer’s and user’s
accuracies. Bare land and Vegetation had good
producer’s accuracy (≥80%). Other mining showed
relatively good producer’s accuracy while Granite
quarries had moderate producer’s accuracy. Low
producer’s accuracy was obtained for Exposed rock
formation and Built-up land due to misclassification
with more classes. The result of low producer’s
accuracy in Exposed rock formation was due to being
confused with Bare land and Built-up land while the
results of low producer’s accuracy in Built-up land
was caused by confusion with Bare land. Granite
quarries had very high user’s accuracy and were
confused with Other mining areas. User’s accuracies
obtained for Exposed rock formation, Vegetation and
Other mining areas were relatively high (>80% in all
cases). Built-up land had fairly good user’s accuracy,
however, this class was confused with Granite
quarries, Exposed rock formation and Other mining
areas. Bare land on the other hand resulted in the
lowest user’s accuracy due to confusions with Granite
quarries, Exposed rock formation, Built-up land,
Vegetation and Other mining areas.
4.2 Post Classification Change
Detection
The results of classification of multi-temporal
Landsat data are shown in Figure 2. In 1973, most
areas were covered by Vegetation and Bare land,
while relatively few areas were covered by Granite
quarries in the south west part of the study area. Water
bodies in the same year are observable by the dam
located in the western part of the study area. Increases
in Granite quarries and Bare land were observed in
1986. There was a corresponding decrease in
Vegetation cover; however, the area indicated by the
quarry boundaries in 1973 and 1986 were
predominantly covered by Vegetation. The dam close
to Granite quarries also decreased in size as compared
to the year 1973. Exposed rock formations and Other
mining areas started to appear in the south western
part of the study area.
The year 1998 experienced a significant increase
in Granite quarries, Other mining areas, Built-up land
and Water bodies. On the other hand, there was a
decrease in Bare land as compared to the year 1986;
this land cover type is more dominant in the south
western part in 1998 whereas it occurred mostly in the
north and the eastern part of the study area in 1986.
The year 2015 saw an increase in Granite quarries
with quarry lakes also developing in few Granite
quarries. A decrease in Vegetation class is observed
compared to 1998 especially in the southern part of
the study area where it was mostly covered by Bare
land. An increase in Built-up land is observed in the
south western part of the study area. Water bodies
saw an increase with an occurrence of water stream
on the south eastern part of the study area.
4.2.1 Quantitative Measures of Land Cover
Area based comparison based on the forty digitized
quarries was applied to Landsat data in order to
measure land cover changes over the time period
supported by acquired data (Table 3). The pattern in
land cover types from 1973, 1986, 1998 to 2015
shows increases in Water bodies and Granite quarries,
and decreases in Bare land as well as Vegetation. No
Water bodies or quarry lakes were observed in 1973
and 1986 inside the quarries. Even though Water
bodies were not clearly visible inside Granite quarries
in the classified images due to map scale (Figure 2),
Quantifying Land Cover Changes Caused by Granite Quarries from 1973-2015 using Landsat Data
199
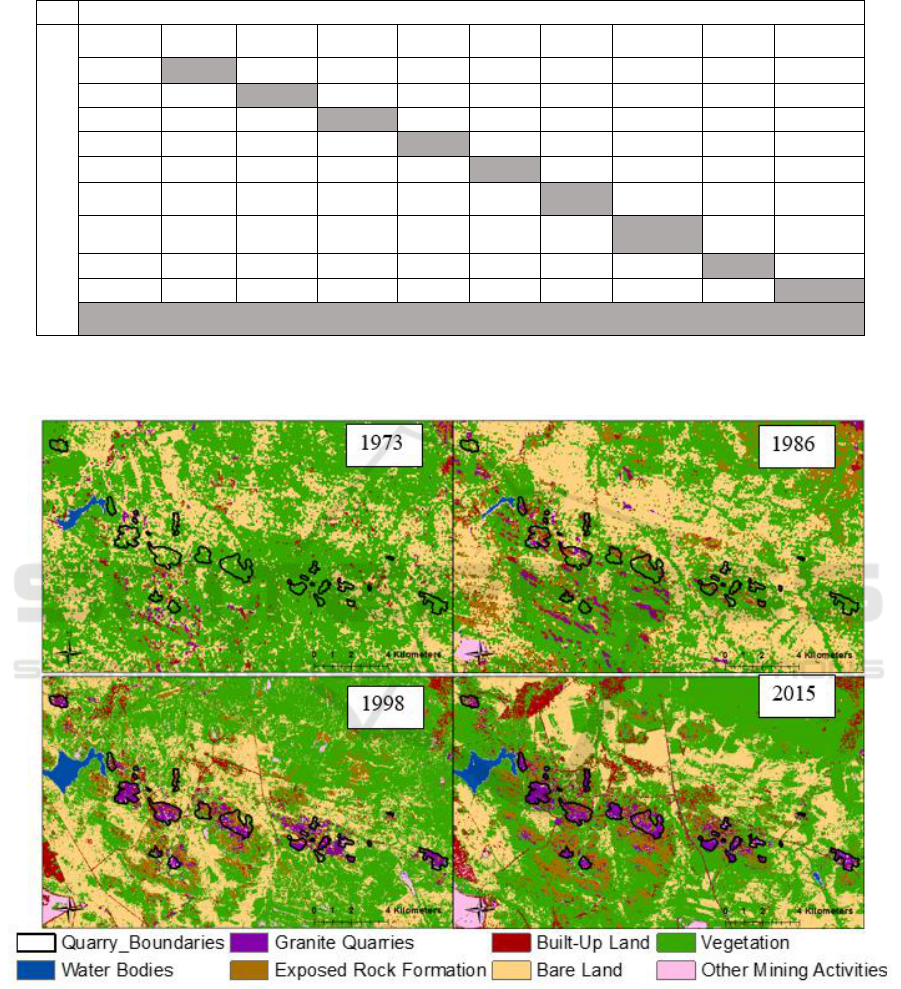
Table 2: Error matrix of classification derived from Landsat imagery taken in 2015.
Reference Data
Classified Data
WB
GQ
ER
BUL
BL
V
OMA
Tot.
UA (%)
WB
10
0
0
0
0
0
0
10
100
GQ
0
20
0
0
0
0
1
21
95
ER
0
3
19
0
0
0
0
22
86
BUL
0
2
2
19
0
0
3
26
73
BL
0
1
9
11
24
3
4
52
46
V
0
0
0
0
6
27
0
33
82
OMA
0
3
0
0
0
0
22
25
88
Tot.
10
29
30
30
30
30
30
141
PA (%)
100
69
63
63
80
90
73
Overall accuracy = 75%, Kappa = 0.71
Key: WB=Water Bodies, GQ= Granite Quarries, ER= Exposed Rock Formations, BUL=Built-Up Land, BL=Bara Land,
V=Vegetation, OM= Other Mining Areas, Tot. =Total, PA=Producer’s Accuracy, UA= User’s Accuracy.
Figure 2: Land cover distributions created using supervised classification of Landsat images acquired in 1973, 1986, 1998
and 2015.
Table 3 shows that there was an increase in Water
bodies within Granite quarries from 1973 to 2015.
The increase in Granite quarries from 1973 and 2015
(3 ha to 910.4 ha) is significant. Bare land increased
from 1973 to 1986, but decreased in 1998 and 2015.
Vegetation cover inside granite quarry boundaries
gradually decreased from the year 1973 to 2015.
There was no change in Water bodies from 1973 to
1986, while the year 1998 and 2015 shows
development and increase in Water bodies within
Granite quarry boundaries. An increase in Granite
quarries is observed from 1973 to 2015. The year
GISTAM 2018 - 4th International Conference on Geographical Information Systems Theory, Applications and Management
200
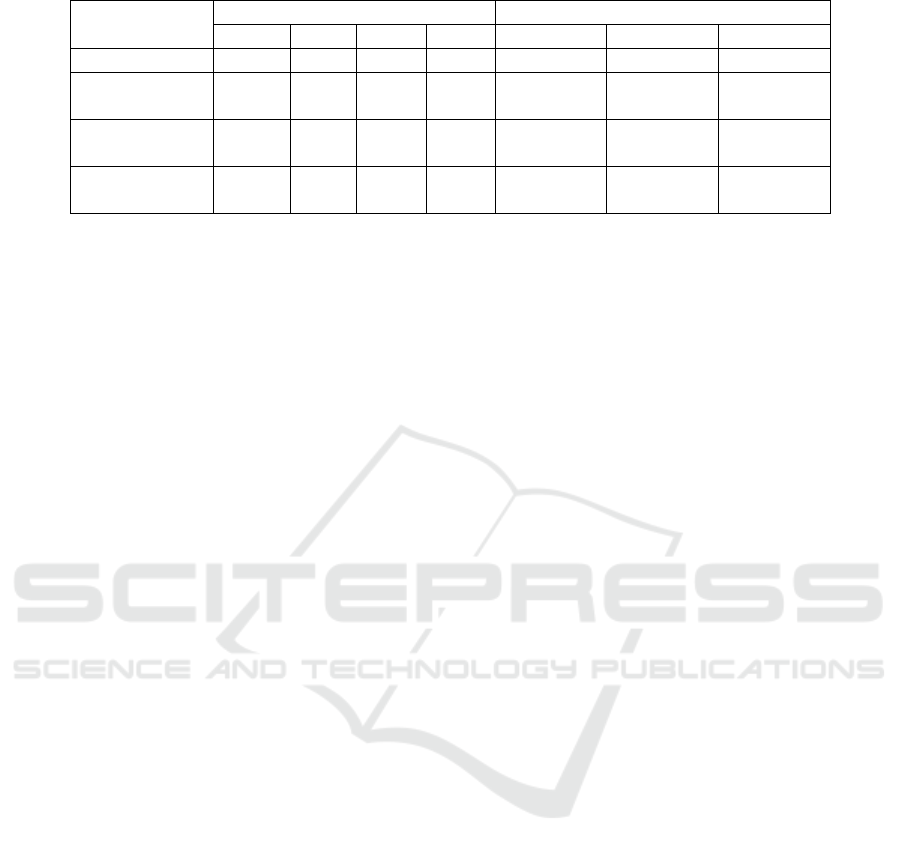
Table 3: Land cover change summary within granite quarries.
Classes
Area of classes (ha)
Difference (ha)
1973
1986
1998
2015
1986-1973
1998-1986
2015-1998
Water Bodies
0.0
0.0
0.2
2.07
0.0
0.2
1.9
Granite
Quarries
3.0
70.2
433.5
910.4
67.2
363.3
476.9
Bare
Land
121.7
130.0
19.2
2.7
8.2
-110.8
-16.5
Vegetation
1095.2
981.7
793.7
313.1
-113.5
-188.0
-480.6
1973 showed little quarrying activities, which
increased in 1986, 1998 and 2015. The increases in
quarrying activities resulted in decreases in bare land
and vegetation over the same period.
4.3 Normalized Difference Vegetation
Index
Normalized Difference Vegetation Index (NDVI)
was computed to distinguish between amounts of
vegetation in the study area. NDVI is aimed at
separating healthy green vegetation from all other
features (such as soil moisture, man-made features
and water) and therefore any feature with prominent
vegetation would yield high NDVI value. Figure 3
shows comparisons of mean NDVI values within
digitized Granite quarry boundaries for the year 1973,
1986, 1998 and 2015 using Landsat data. High mean
NDVI values are observed in the year 1998 indicating
the presence of green vegetation. This was followed
by the year 1973 and 2015 while the year 1986
displayed low mean NDVI values. Quarry No. 1 was
sampled for closer statistical observation of changes
in NDVI values over acquired time series data.
Distribution of NDVI values in the quarry was
categorised using the Natural Breaks (Jenks)
classification approach. The statistical comparison of
NDVI values was based on 322 pixels and was
explored using frequency distribution graph (Figure
4). Data acquired in 1973 and 1986 was resampled to
30 m spatial resolution for consistent comparison.
The graph shows that 95% and 79% of the pixels in
the years 1973 and 1998, respectively, have NDVI
values above 0.29 while the majority of pixels in the
year 1986 and 2015 are distributed within NDVI
values below 0.29.
5 DISCUSSION
The results of classification obtained from Landsat
data revealed a substantial strength of agreement of
classification with kappa of 0.71 and an overall
classification accuracy of 75%. Producer’s accuracy
showed that Water bodies were classified correctly.
The error matrix however, showed a certain degree of
confusion between classifications of some classes.
Granite quarries, which is the main class of interest in
this study, yielded moderate producer’s accuracy, and
was mainly confused with Exposed rock formation,
Built-up land, Bare land and Other mining areas due
to similar spectral properties. User’s accuracy for
Granite quarries showed that only one reference point
was misclassified as other mining areas.
Distribution patterns of land cover within Granite
quarries and surrounding areas using Landsat
imagery revealed major changes in the land cover
between 1973 and 2015. Land cover within digitized
Granite quarries boundaries in the year 1973, before
intense quarrying activity started, was predominantly
covered by Vegetatation, Bare land, Exposed rock
formation with minor occurrences in Granite quarries.
Increase in granite quarrying activity in the years
1986, 1998 and 2015 revelead significant change in
land cover within Granite quarries. The year 2015
revealed significant increase in water bodies within
granite quarries which form as a result of expansion
in quarries. There was also a significant loss of
vegetation and bare land due to substantial increase in
granite quarrying activity.
Comparison of mean NDVI values used to assess
the presence or absence of vegetation cover within
granite quarries revealed variability across all granite
quarries over Landsat time series. The overall mean
NDVI values trends showed that most granite
quarries had the highest Vegetation in 1998, followed
by 1973, 2015 and the year with least Vegetation
Quantifying Land Cover Changes Caused by Granite Quarries from 1973-2015 using Landsat Data
201
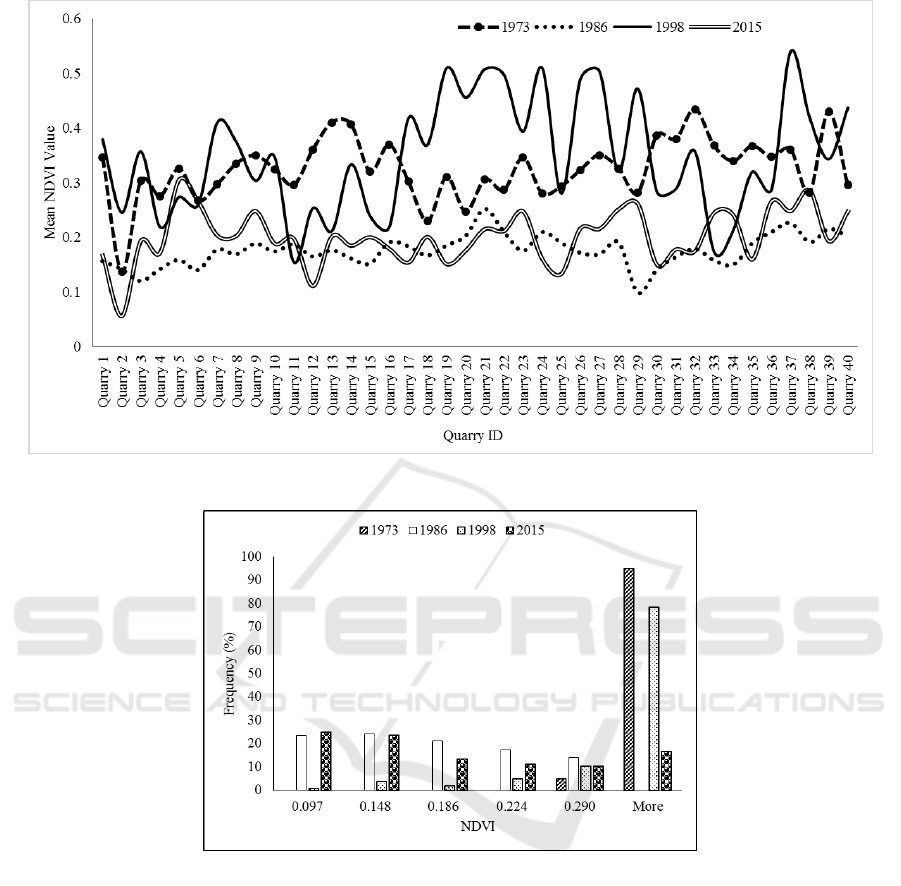
Figure 3: Comparison of mean NDVI values within digitized quarries.
Figure 4: NDVI frequency distribution for the year 1973, 1986, 1998 and 2015 at 30 m spatial resolution.
cover was 1986. Analysis of NDVI pattern based on
individual pixels within Quarry No. 1 over acquired
time series data revealed that more pixels had high
positive NDVI values in the year 1973 and 1998
indicating dominance of green Vegetation cover
while the year 1986 and 2015 had more pixels with
low NDVI values.
The results of this study showed the significance
and the potential of Landsat data in mapping and
monitoring land cover changes within granite
quarries. The results of this study support other
studies that have demonstrated the abilities of Landsat
in monitoring quarry activities (Mouflis et al., 2008;
Koruyan et al., 2012; Thakkar et al., 2017).
6 CONCLUSIONS
The aim of this study was to quantify land cover
changes caused by Granite quarries located between
Rustenburg and Brits, North West Province, South
Africa. The use of Landsat data was chosen for this
study due mainly to availability of archival data at no
cost. The overall classification accuracy was 75%
(kappa coefficient of 0.71). The study revealed a
significant increase in Granite quarries from the year
1973 to 2015. Increase and expansion in Granite
quarries resulted in an increase in accumulation of
Water bodies within Granite quarries. There was also
GISTAM 2018 - 4th International Conference on Geographical Information Systems Theory, Applications and Management
202

a substantial decrease in Vegetation and Bare land
cover due to the quarrying activity. Although Landsat
was able to measure land cover changes in the study
area, there were misclassifications due to spectral
similarities. Another limitation encountered during
the study was inability of Landsat to detect small
Water bodies within Granite quarries.
Recommendations that can address these limitations
in the future is the use of high spectral resolution data
such as hyperspectral remote sensing which is able to
distinguish between features with similar spectral
properties. Another recommendation is the use of
high spatial multispectral resolution data that is able
to detect small features such as water bodies within
granite quarries.
ACKNOWLEDGEMENTS
This study was sponsored by the University of
Johannesburg and Mintek.
REFERENCES
Abu, A. and Abdelall, S. (2014) ‘Sustainable development
of stone and marble sector in Palestine’, Journal of
Cleaner Production, 84, pp. 581–588.
Cawthorn, G. ., Eales, H. ., Walraven, F., Uken, R. and
Watkeys, M. . (2006) ‘The Bushveld Complex’, in
Johnson, M. ., Anhaeusser, C. ., and Thomas, R. . (eds)
The Geology of South Africa. Johannesburg: Geological
Society of South Africa, pp. 261–281.
Chander, G., Markham, B. L. and Helder, D. L. (2009)
‘Summary of current radiometric calibration
coefficients for Landsat MSS, TM, ETM+, and EO-1
ALI sensors’, Remote Sensing of Environment. Elsevier
Inc., 113(5), pp. 893–903.
Charou, E., Stefouli, M., Dimitrakopoulos, D., Vasiliou, E.
and Mavrantza, O. D. (2010) ‘Using remote sensing to
assess impact of mining activities on land and water
resources’, Mine Water and the Environment, 29(1), pp.
45–52.
Congalton, R. G. and Green, K. (2008) Assessing the
Accuracy of Remotely Sensed Data: Principles and
Practices. Second Edi. Boca Raton: CRC Press.
Deer, P. (1995) ‘Digital change detection techniques in
remote sensing.’, p. 53.
Demirel, N., Emil, M. K. and Duzgun, H. S. (2011) ‘Surface
coal mine area monitoring using multi-temporal high-
resolution satellite imagery’, International Journal of
Coal Geology. Elsevier B.V., 86(1), pp. 3–11.
Duncan, E. E. and Kuma, J. S. (2009) ‘Open pit mining and
land use changes: An example from Bogosu-Prestea,
South West Ghana’, The Electronic Journal of
Information Systems in Developing Countries, 36(3),
pp. 1–10.
Fleiss, J. F. and Cohen, J. (1973) ‘The equivalence of
weighted kappa and the intraclass correlation
coefficient as measure of reliability’, Educational and
Psychological Measurement, 33, pp. 613–619.
Foody, G. M. (2002) ‘Status of land cover classification
accuracy assessment’, Remote Sensing of Environment,
80(1), pp. 185–201.
Gandhi, G. M., Parthiban, S., Thummalu, N. and Christy,
A. (2015) ‘Ndvi: Vegetation Change Detection Using
Remote Sensing and Gis - A Case Study of Vellore
District’, Procedia Computer Science. Elsevier Masson
SAS, 57, pp. 1199–1210.
Gonzalez, E. P., Lopez, J. S., Martin, J. D., Burgos, A. J.
and Agudo, J. P. (2006) ‘Analysis of the mobilization
of solid loads and heavy metals in runoff waters from
granite quarries’, Environmental Geology, 50(6), pp.
823–834.
Günther, O., Radermacher, F. J. and Riekert, W.-F. (1995)
‘Environmental Monitoring : Models , Methods , and
Systems’, in Environmental Informatics. Netherlands:
Springer, pp. 13–38.
Jackson, R. D. and Huete, A. R. (1991) ‘Interpreting
vegetation indices’, Preventive Veterinary Medicine,
11, pp. 185–200.
Jain, P. K. (2015) ‘Environmental Degradation Due to
Open Cast Mining Activities in Bundelkhand and
Gwalior Region of M. P., India’, 4(3), pp. 725–731.
Koppe, J. C. (1997) ‘impacts and mining reclamation of
ornamental stone quarries’, in Marinos, P. G., Koukis,
G. C., Tsiambaos, G. C., and Stournaras, G. C. (eds)
Engineering Geology and the Environment.
Netherlands: CRC Press, pp. 2441–2446.
Koruyan, K., Deliormanli, a. H., Karaca, Z., Momayez, M.,
Lu, H. and Yalçin, E. (2012) ‘Remote sensing in
management of mining land and proximate habitat’,
Journal of the Southern African Institute of Mining and
Metallurgy, 112(7), pp. 667–672.
Lam, N., Zhou, G. and Ju, W. (2008) ‘Relating Visual
Changes in Images with Spatial Metrics’, in Yuan, M.
and Hornsby, K. S. (eds) Understanding Dynamics of
Geographic Domains. Boca Raton, London: CRC
Press, pp. 115–132.
Lameed, G. and Ayodele, E. (2011) ‘Effect of quarrying
activity on biodiversity: Case study of Ogbere site,
Ogun State Nigeria’, African Journal of Environmental
Science and Technology, 4(11), pp. 740–750.
Latifovic, R. (2005) Satellite RemoteSensing in Assessing
the Environmental Impactsof Large-Scale Surface
Mining. PhD Thesis, Department De Genie Des Mines,
De La Metallurgie Et Des, Univerite Laval Quebec.
Latifovic, R., Fytas, K., Chen, J. and Paraszczak, J. (2005)
‘Assessing land cover change resulting from large
surface mining development’, International Journal of
Applied Earth Observation and Geoinformation, 7(1),
pp. 29–48.
Lein, J. K. (2014) ‘Toward a remote sensing solution for
regional sustainability assessment and monitoring’,
Sustainability (Switzerland), 6(4), pp. 2067–2086.
Quantifying Land Cover Changes Caused by Granite Quarries from 1973-2015 using Landsat Data
203

Lillesand, T., Kiefer, R. W. and Chipman, J. (2014) Remote
Sensing and Image Interpretation. 7th edn. New York:
John Wiley & Sons.
Lu, D., Mausel, P., Brondizio, E. and Moran, E. F. (2004)
‘Change detection techniques’, International Journal of
Remote Sensing, 25(February), pp. 2365–2407.
Mas, J.-F. (1999) ‘Monitoring land-cover changes: A
comparison of change detection techniques’,
International Journal of Remote Sensing, 20(1), pp.
139–152.
Mouflis, G. D., Gitas, I. Z., Iliadou, S. and Mitri, G. H.
(2008) ‘Assessment of the visual impact of marble
quarry expansion (1984-2000) on the landscape of
Thasos island, NE Greece’, Landscape and Urban
Planning, 86(1), pp. 92–102.
Musa, H. D. and Jiya, S. N. (2011) ‘An Assessment of
Mining Activities Impact on Vegetation in Bukuru Jos
Plateau State Nigeria Using Normalized Differential
Vegetation Index (NDVI)’, Journal of Sustainable
Development, 4(6), pp. 150–159.
Nex, P. A., Kinnaird, J. A., Ingle, L. J., Van Der vyver, B.
A. and Cawthorn, R. G. (1998) ‘A new stratigraphy for
the main zone of the Bushveld Complex, in the
Rustenburg area’, South African Journal of Geology,
101(3), pp. 215–223.
Paull, D., Banks, G., Ballard, C. and Gillieson, D. (2006)
‘Monitoring the Environmental Impact of Mining in
Remote Locations through Remotely Sensed Data’,
Geocarto International, 21(1), pp. 33–42.
Pettorelli, N. (2013) The Normalized Difference Vegetation
Index. New York, USA: OUP Oxford.
Pierre, D. and Sophie, B. (2016) ‘Revisiting Land-Cover
Mapping Concepts’, in Giri, C. P. (ed.) Remote Sensing
of Land Use and Land Cover: Principles and
Applications. Boca Raton: CRC Press, pp. 49–64.
Potere, D. (2008) ‘Horizontal positional accuracy of google
earth’s high-resolution imagery archive’, Sensors,
8(12), pp. 7973–7981.
Singh, A. (1989) ‘Review Article Digital change detection
techniques using remotely-sensed data’, International
Journal of Remote Sensing, 10(6), pp. 989–1003.
Sun, J., Yang, J., Zhang, C., Yun, W. and Qu, J. (2013)
‘Automatic remotely sensed image classification in a
grid environment based on the maximum likelihood
method’, Mathematical and Computer Modelling.
Elsevier Ltd, 58(3–4), pp. 573–581.
Thakkar, A. K., Desai, V. R., Patel, A. and Potdar, M. B.
(2017) ‘Post-classification corrections in improving the
classification of Land Use/Land Cover of arid region
using RS and GIS: The case of Arjuni watershed,
Gujarat, India’, Egyptian Journal of Remote Sensing
and Space Science. National Authority for Remote
Sensing and Space Sciences, 20(1), pp. 79–89.
Tucker, C. J. (1979) ‘Red and photographic infrared linear
combinations for monitoring vegetation’, Remote
Sensing of Environment, 8(2), pp. 127–150.
Viera, A. J. and Garrett, J. M. (2005) ‘Understanding
Interobserver Agreement: The Kappa Statistic’, Family
Medicine, 37(5), pp. 360–363.
GISTAM 2018 - 4th International Conference on Geographical Information Systems Theory, Applications and Management
204
