
Graphicuss
Temporal Visualisation of Canvas Creation Processes
Tenshi Hara
1
, Anastasia Iljassova
2, ∗
, Iris Braun
1
and Felix Kapp
3
1,2
Faculty of Computer Science, Chair of Computer Networks, Technische Universit
¨
at Dresden, Dresden, Germany
3
Faculty of Psychology, Chair of Learning and Instruction, Technische Universit
¨
at Dresden, Dresden, Germany
Keywords:
Graphical Discussion, Guided Discussion, Graphicuss, Temporal Information.
Abstract:
The use of graphical models to describe complex topics is very common in teaching, helping students build an
adequate model of knowledge presented. Often, students discuss open questions on-line in forums. Backtrack-
ing of errors conducted during the creation process is hard. The individual steps of developing a solution – the
temporal information – are lost. Graphicuss combines concepts of textual discussion systems and graphical
feedback systems. It fosters better discussions and comprehension through access to the temporal information
of canvases. Especially self-regulated learning benefits from the addition of temporal information; students’
skill acquisition capabilities are amplified. Yet, an intuitive representation of temporal information is still re-
quired. Based on image and video processing, we investigated existing metaphors for temporal information.
A series of user studies emphasises the differences of the metaphors in varying use-cases and strongly points
at a candidate suitable and feasible for PCs as well as mobile devices.
1 INTRODUCTION
In computer science lectures the use of graphical
models to describe complex algorithms and correla-
tions is very common. It is very important for the stu-
dents to build an adequate model of the knowledge
presented in the lecture. If the students have any
questions after the lecture, they can discuss them in
a forum like auditorium
1
(Beier et al., 2014), Stack-
Overflow
2
, or others. However, there they can only
use textual descriptions of the problem; they might be
able to quote figures or pictures in the web, but they
cannot discuss the single steps of developing the fig-
ure or model because they only know the final result;
temporal information of the creation process is lost.
Basically, these discussions never recreate the major
advantage of a real-life studying session, namely cre-
ating solutions together step by step, including back-
tracking of errors made in the process.
At CSEdu 2017, we presented our graphical dis-
cussion system Graphicuss (Chen, 2016; Hara et al.,
2017). It combines known concepts of textual dis-
cussion systems and graphical feedback systems into
a single canvas-based application. Treating text and
∗
Student in the CS master’s programme.
1
https://auditorium.inf.tu-dresden.de
2
https://stackoverflow.com
graphics as mere objects within a canvas allows for
better discussion of concepts through temporal cor-
relation of information in text and graphics. Thus,
it applies known text-based discussion features (e.g.,
quoting) to the graphical level while adding temporal
context. Rather than attaching an invariable image to
a text or to adding new content to an otherwise un-
altered image, Graphicuss enables users to quote up
until any point in time with changes and/or amend-
Figure 1: GUI mock-up for Graphicuss.
Hara, T., Iljassova, A., Braun, I. and Kapp, F.
Graphicuss.
DOI: 10.5220/0006680901990204
In Proceedings of the 10th International Conference on Computer Supported Education (CSEDU 2018), pages 199-204
ISBN: 978-989-758-291-2
Copyright
c
2019 by SCITEPRESS – Science and Technology Publications, Lda. All rights reserved
199

ments thereafter due to the availability of the entire
creation time-line of a canvas. Therefore, Graphi-
cuss provides opportunities for students to give and
receive peer feedback (e.g., (Peters et al., 2017))
on their own or others learning process and learn-
ing products. By combining established didactics
and learning psychology methods with new imple-
mentation concepts, Graphicuss supports students in
mastering self-regulated learning (Zimmerman et al.,
2000). The documentation of the own creation pro-
cess and the final representation allows to reflect and
self-evaluate ones learning activities and helps correct
misconceptions for subsequent study phases. With re-
gard to peers’ solutions, the addition of temporal in-
formation is of special value for the understanding of
the creation process. Allowing students to compre-
hend a complex canvas step by step by reproducing
the creation process of a peer helps them to create an
adequate mental model themselves.
In (Hara et al., 2017) we focused on prelimin-
ary findings with respect to basic interface design and
storage requirements; visualisation of temporal infor-
mation was not yet investigated. E.g., Figure 1 depicts
how a temporally partial quotation and amendment of
a canvas can be presented to users after its submis-
sion. However, an intuitive representation of temporal
information is required before and during the quot-
ing process. Thus, based on existing metaphors used
in image and video processing, we investigated can-
didates for temporal representations of progress, edit-
ing state, changes, etc. In this paper we will present
our results of several user studies and propose GUI
guidelines for the representation of temporal creation
information.
2 RELATED WORK
We investigated different representations of temporal
information in the context of text-based discussion
systems (i.e., forums), collaborative editing as well
as visual information hubs (e.g, YouTube
3
).
2.1 Forums
Forum systems can be divided into two types: hier-
archical systems (e.g., photo.net Discussions
4
) and
bulletin systems (a.k.a. flat systems) (e.g., StackOver-
flow
5
). Both types focus on a specific representation
of the content. While bulletin systems emphasise the
3
https://youtube.com
4
https://www.photo.net/discuss
5
https://stackoverflow.com
(a) Classic
(b) Newest-on-Top
Figure 2: Classic (2(a)) vs newest-on-top threading (2(b)).
importance of topics rather than threads, it is difficult
to extract temporal information with respect to the or-
der of which posting was posted when (of course, the
creation and modification time is often displayed, but
the temporal order is not perceivable on a glimpse).
However, associated content is clustered together. In
contrast, hierarchical systems focus on a representa-
tion of the evolution of threads. The real creation his-
tory (time-line, temporal information) is often repres-
ented either as is (cf. 2(a)) or in a highlighted fashion
newest-on-top (cf. 2(b)).
The basic idea behind both types of forum systems
is easily accessible content, be it by topic or within a
time-line. Nevertheless, the granularity of temporal
information is set on a per-submission level. Within
a submission, temporal information is not available in
general. Of course, one may assume, text at the begin-
ning of a submission was written before text at the end
of a submission, but it might just be the opposite, with
the author writing something and then adding further
content ahead of the corresponding paragraph, etc.
2.2 Collaborative Editing
The drawing concept of Graphicuss is similiar to col-
laborative editing systems such as virtual interactive
whiteboards (e.g., AwwApp
6
, Scribblar
7
) or shared
document systems (e.g., Google Docs
8
, Microsoft Of-
fice Online
9
). However, within these systems the tem-
poral information is provided on an in-submission (in-
document) level and is utilised for local and shared
undo and redo functionality. The current document
composition is shared amongst the collaborators. In
general, edits and submissions are represented by
states and transitions between these states. A state
is defined by sufficient changes to a document or by
editing pauses. E.g., states may be created for each
6
https://awwapp.com
7
https://scribblar.com
8
https://docs.google.com
9
https://www.office.com
CSEDU 2018 - 10th International Conference on Computer Supported Education
200

(a) Traditional undo/redo model.
(b) Selective undo/redo model
Figure 3: Traditional (3(a)) vs selective (3(b)) undo/redo
models within collaborative editing systems.
new sentence, for each word when typing slower,
or single letters over a longer period of time. Lin-
early traversing along the states leads to a traditional
undo/redo model (cf. 3(a)). Allowing jumps between
states without direct transition leads to a selective
undo/redo model (cf. 3(b)) which requires on-demand
computation of differences between involved states.
Basically, it is a direct implementation of (Berlage,
1994).
2.3 Video Sharing
The best example for the representation of temporal
information is a video. With progression of time the
displayed graphical information changes. A direct
correlation between point in time and visual informa-
tion is given, leading to a direct coupling of time-line
and content. The long history of video media has lead
to established and agreed-upon standards for the rep-
resentation of the time-line.
Typically, a progress bar represents the entirety of
the time-line with the current fill of the progress bar
representing the elapsed time and the current position
within the time-line (cf. Figure 4). Commonly, the
progress bar is accompanied by further control means,
(a) Windows Media Player interface.
(b) YouTube Player interface.
(c) YouTube Player interface with seek bar.
Figure 4: Interfaces of Windows Media Player (4(a)) and
YouTube Player (4(b)) (YouTube Player seek bar in 4(c)).
e.g. a pause/play button. If the progress bar itself
can be utilised to access specific points in time along
the time-line, it is commonly referred to as a seek bar
(cf. 4(c)). For online video platforms in particular,
the progress/seek bar often also provides information
on the pre-fetching (buffering) future, yet to be dis-
played, video content (cf. grey vs red progress in fig-
ures 4(b) and 4(c)).
3 STATE-BASED METAPHORS
Besides the aspects of temporal information repres-
entation presented in the previous subsections, human
expectations must be considered, too. Information
must be presented in a means easily comprehensible
for humans. Metaphors have proven to be an efficient
means of proving information in well-known con-
cepts to humans (e.g., (Preim and Dachselt, 2015)).
With respect to temporal information, the repres-
entation of all information is not feasible. Time pro-
gresses continuously while computers need to store
the time-line discretely. Hence, a problem is granular-
ity: should a state be created every millisecond, every
second, every ten seconds? The granularity problem
is accompanied by an evident storage requirements
problem. Commonly, a mantra of ‘as often as ne-
cessary and as seldom as possible’ is followed. This
leads to a state-based storing of temporal information,
namely creating snapshots when sufficient changes
have occurred. Of course, this matches the concepts
introduced in subsection 2.2. The interesting question
then is, how these states can be easily visualised. A
rather simple translation of a time-line into a meta-
phor is depicted in Figure 5 by a slider (a seek bar)
(amended with forward/backward buttons) and in Fig-
ure 6 by a slideshow. The latter metaphor is well es-
tablished in photo and image applications, especially
on devices with touch interfaces such as smartphones.
For interpreting temporal information as a con-
tinuous flow of changes in a document, the obvious
metaphor is a video. Thus, the visualisation concepts
(cf. 2.3) should apply. A simple translation of a time-
line into the video metaphor is depicted in Figure 7.
However, other metaphors may be more suitable,
especially with respect to the expected use-cases of
Figure 5: Slider mock-up.
Graphicuss
201

Figure 6: Slideshow mock-up.
Graphicuss. Assuming most cases are based on the
states, the entire time-line is discrete. For example,
Graphicuss allows easy creation of UML
10
diagrams
by providing users with a tool box of predefined
shapes (squares, arrows, etc.) for easier drawing.
Each insertion of such a shape can be considered a
new state in the creation time-line of a canvas.
Figure 7: Video mock-up.
On smartphones a state representation with a high-
light on the current state can be a beneficiary meta-
phor. Due to multi-tasking support, small picto-
graphs, each representing the current state of an ap-
plication, are arranged within the graphical user in-
terface (GUI). Users can easily select from the run-
ning applications by tapping the corresponding pic-
tograph. This concept has been around for a long
time, especially also within desktop operating sys-
tems (e.g., Flip in Microsoft Windows, Switcher in
Apple MacOS). Translating this concept into the con-
text of Graphicuss leads to two separate metaphors: a
stack (cf. Figure 8) with the current state on top of the
stack and all older states laying below, and a carousel
(cf. Figure 9) with the current state in the centre, older
states to one side, and newer states to the other.
Figure 8: Stack mock-up.
10
Universal Markup Language
Figure 9: Carousel mock-up.
However, Graphicuss can not only be utilised for
UML diagrams. Therefore, we assumes that different
types of metaphors are suitable for different types of
use-cases. We defined a set of requirements in order
to select the most suitable metaphor for the repres-
entation of temporal information, namely the creation
history of canvases within Graphicuss.
We defined five mandatory and three optional re-
quirements to be met by the GUI. Therein, it. . .
M1 . . .must use easily comprehensible metaphors;
no explanation of how time is represented,
M2 . . .must support different use-cases,
M3 . . .must visualise the time-line and its direction,
M4 . . .must ensure that the current state is always
accessible within the time-line,
M5 . . .must allow forwarding/rewinding the time-
line in coarse as well as fine steps,
O1 . . .could utilise large and clear icons,
O2 . . .could provide control elements adaptable to
different client devices, and it
O3 . . .could be multi-modal (accept different types
of input methods).
4 USER STUDIES
For the design process of our Graphicuss prototyp is is
very important that the developed systems fulfills all
requirements for the different use cases and contexts.
Therefore, we objectively analysed the suitability of
the different metaphors with respect to fulfilment of
our defined requirements before the user studies. We
aggregated our findings into a table (cf. Table 1). Un-
conditional fulfilment of a requirement is symbolised
by a ++ (value of 2), conditional fulfilment by a +
(value of 1), and dissatisfaction by a − (value of -1).
The total scores (Σ) are calculated by adding the indi-
vidual values of each row.
Based on these first result, one may presume that
the video metaphor is the most suitable. However, the
table actually only proves that all investigated meta-
phors are more or less suitable. There is no single
best metaphor as all metaphors have some conditions
attached to their suitability. Therefore, we decided
to focus on the three higher rated metaphors (Slider,
CSEDU 2018 - 10th International Conference on Computer Supported Education
202
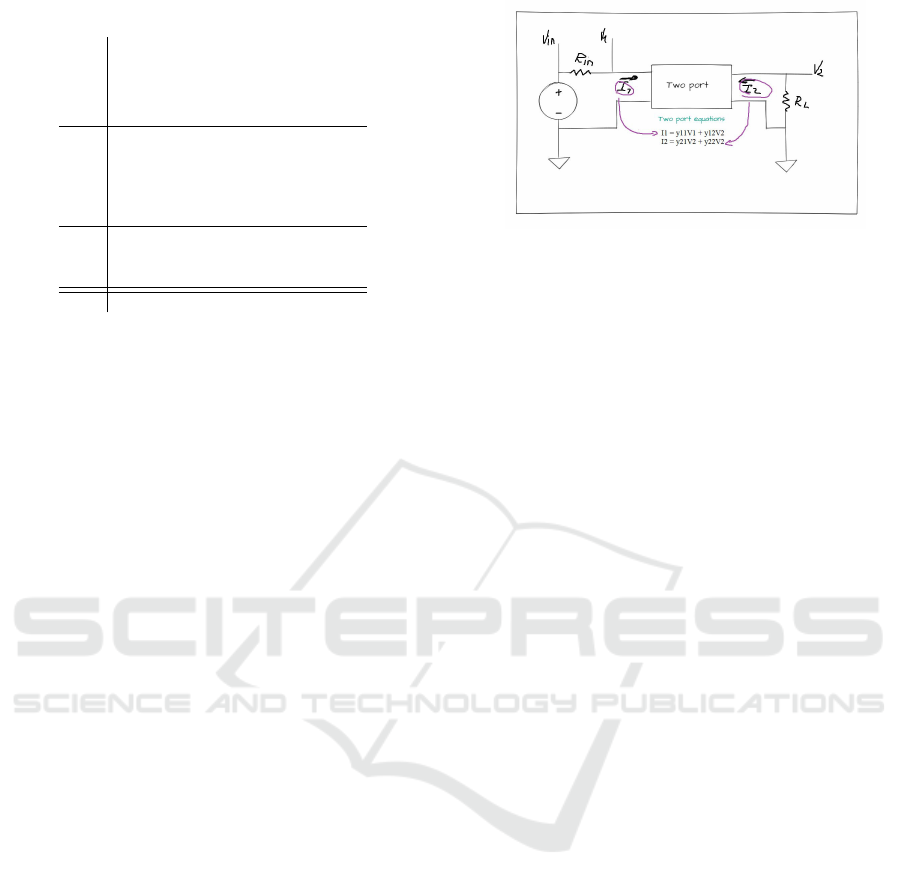
Table 1: Requirements fulfilment by metaphor.
Rqmnt
Slider
Slideshow
Video
Stack
Carousel
M1 + + + + +
M2 ++ ++ ++ ++ ++
M3 + + ++ ++ +
M4 + ++ ++ ++ ++
M5 + − − − −
O1 + + + + +
O2 ++ ++ ++ + +
O3 ++ ++ + − −
Σ 11 10 12 6 6
Slideshow, Video) and involve users in order to de-
termine the subjectively best option.
We investigated the metaphors’ suitability by
means of user studies in two iterations within con-
trolled environments. In the first iteration (n=5),
thinking aloud as well as blank paper prototype meth-
ods were utilised. This was intentionally conducted
in this manner in order to determine whether users
would come up with the Slider, Slideshow or Video
metaphor on their own. If ‘yes’, it would provide
proof to the suitability of said metaphors. In the
second iteration (n=15), paper-based mock-ups as
well as Wizard-of-Oz low-fidelity prototypes (some
functionality that would be automated in the real sys-
tem were manually conducted by humans) were util-
ised. The goal was to target specific aspects of the
metaphors and investigate the users’ opinions on us-
ability as well as comprehensibility. In addition to the
two iterations, we conducted interviews, asking about
metaphor suitability, comprehensibility of the time-
line, etc.
The first iteration of studies resulted in two intu-
itive metaphors: Slider and Slideshow. When asked
explicitly about it in the interviews, the test subjects
also deemed the Video metaphor as suitable, but they
did not come up with this metaphor during the blank
paper prototyping. Additionally, Video was deemed
suitable only for quasi-continuous or equidistant time
representation. Considering suitability for utilisation
on desktop as well as mobile devices, we interviewed
the test subjects whether they could imagine to util-
ise any of the metaphors on their PC as well as their
smartphone. Overall, the first iteration and the inter-
views conducted resulted in the following statements:
• The representation of temporal information was
comprehensible in all three metaphors.
• Most of the icons utilised in the metaphors were
correctly identified. Icons for coarse rewind-
ing/forwarding could be misinterpreted.
• The direction of the time-line (in general: left-to-
Figure 10: Canvas used in the tests.
right) was easily comprehensible.
• On mobile devices, the Slideshow metaphor is
better suitable than the Slide metaphor.
• The Video metaphor must correlate to the actual
creation time-line exactly.
• Users cannot determine the presentation speed op-
timal for their needs in the Video metaphor.
• Identifying differences between two states be-
comes increasingly complex with more states.
Based on these statements, we decided to drop
the Video metaphor in the second iteration. Storing
the exact timestamp of what happened when in the
time-line is not feasible. It requires a fine granular-
ity of states which is not suitable for low traffic re-
quirements, especially on mobile networks. Also, the
criticism about playback speed had to be considered.
In direct comparison, the Slider and Slideshow meta-
phors allow user to determine when they want to see
a change. In the Video metaphor, they had to con-
stantly use the pause and play controls, which basic-
ally turned the Video into a Slideshow. Therefore,
only the Slider and Slideshow metaphors were invest-
igated in the second iteration. Due to the last state-
ment from the previous iteration, we used a complex
electrical circuit drawing for our tests (cf. Figure 10).
In total, we tested three paper prototypes with
the test subjects: Slider (cf. Figure 11) and two
Slideshows with different controls arrangement (cf.
Figure 12). Our investigations showed that the Slider
metaphor is well suited with larger displays, espe-
cially on desktop or laptop computers. However,
on smaller displays (e.g., smartphones), a full-screen
representation was preferred by the majority of test
subjects. Thus, only the Slideshow metaphor is suit-
able for utilisation on PCs and smartphones.
Our investigations also show that the previous
statement regarding granularity of seeking within the
time-line is important. In some situations users need
to be able to slowly follow the time-line by navig-
ating through it state-by-state (fine granularity), in
other situations users need to be able to skip entire
states within the time-line (coarse granularity). The
Slideshow metaphor can address both situations: in
Graphicuss
203

Figure 11: Slider paper prototype.
a touch-controlled environment (e.g., smartphone),
the speed of swipes can determine the speed of state
changes, whereas on point-and-click environments
(desktop PC), different controls for different granu-
larities can be used (cf. 12(b)).
5 CONCLUSION
We conclude that only the Slideshow metaphor is suit-
able for all devices Graphicuss is expected to serve,
namely personal computers as well as smartphones.
However, as the Slider metaphor has clear advant-
ages over the Slideshow metaphor on larger displays,
(a) Slideshow paper prototype, var. 1.
(b) Slideshow paper prototype, var. 2.
Figure 12: Two variants of Slideshow paper prototypes.
Standard controls (12(a)) and extended controls with coarse
rewind/forward controls (12(b)).
it might be beneficiary to include implementations of
both metaphors within Graphicuss. Based on the dis-
play size either metaphor can then be delivered.
The results need to be implemented into our
Graphicuss prototype as the findings are of theor-
etical nature and are entirely based on blank pa-
per prototypes, low-fidelity mock-ups, and user in-
terviews. This is a memium-term goal as Graphicuss
is currently undergoing a complete re-implementation
in order to facilitate better compatibility with our
AMCS
11
system.
In the future, we wish to further investigate the
suitability of the different metaphors in different use-
cases. With the new prototype, we will be able to
investigate different classroom settings (e.g., lecture,
tutorial) as well as different topic contexts (e.g., com-
puter science (UML diagrams, service sketches, . . .),
physics (TTT curves, radiation patterns, . . .)).
REFERENCES
Beier, L., Braun, I., and Hara, T. (2014). auditorium - Frage,
Diskutiere und Teile Dein Wissen! In GeNeMe 2014
- Gemeinschaften in Neuen Medien. GeNeMe.
Berlage, T. (1994). A selective undo mechanism for graph-
ical user interfaces based on command objects. ACM
Transactions on Computer-Human Interaction, 1(3).
Chen, K. (2016). Graphical Discussion System. Master’s
thesis, Technische Universit
¨
at Dresden.
Hara, T., Chen, K., Braun, I., and Kapp, F. (2017). Graph-
icuss - Proposing Graphical Discussion System. In
Proceedings of the 9th International Conference on
Computer Supported Education (CSEdu 2017).
Peters, O., K
¨
orndle, H., and Narciss, S. (2017). Effects of
a formative assessment script on how vocational stu-
dents generate formative feedback to a peers or their
own performance. European Journal of Psychology of
Education.
Preim, B. and Dachselt, R. (2015). Interaktive Systeme:
Band 2: User Interface Engineering, 3D-Interaktion,
Natural User Interfaces. Springer-Verlag.
Zimmerman, B. J., Boekarts, M., Pintrich, P., and Zeidner,
M. (2000). Attaining self-regulation: a social cognit-
ive perspective. Handbook of self-regulation, 13.
All URLs within this paper were last successfully accessed
on 19 January 2018.
11
https://amcs.website – cf. CSEdu 2014-2016
CSEDU 2018 - 10th International Conference on Computer Supported Education
204
