
Cellular Bandwidth Prediction for Highly Automated Driving
Evaluation of Machine Learning Approaches based on Real-World Data
Florian Jomrich
1,2
, Alexander Herzberger
3
, Tobias Meuser
2
,
Bj
¨
orn Richerzhagen
2
, Ralf Steinmetz
2
and Cornelius Wille
3
1
Opel Automobile GmbH, R
¨
usselsheim, Germany
2
Multimedia Communications Lab (KOM), TU Darmstadt, Germany
3
Computer Science Department, Technical University of Applied Sciences Bingen, Germany
Keywords:
Cellular Networks, Connectivity Map, LTE, Throughput Prediction, Machine Learning, Mobile, Vehicular.
Abstract:
To enable highly automated driving and the associated comfort services for the driver, vehicles require a
reliable and constant cellular data connection. However, due to their mobility vehicles experience significant
fluctuations in their connection quality in terms of bandwidth and availability. To maintain constantly high
quality of service, these fluctuations need to be anticipated and predicted before they occur. To this end,
different techniques such as connectivity maps and online throughput estimations exist. In this paper, we
investigate the possibilities of a large-scale future deployment of such techniques by relying solely on low-
cost hardware for network measurements. Therefore, we conducted a measurement campaign over three weeks
in which more than 74,000 throughput estimates with correlated network quality parameters were obtained.
Based on this data set—which we make publicly available to the community—we provide insights in the
challenging task of network quality prediction for vehicular scenarios. More specifically, we analyse the
potential of machine learning approaches for bandwidth prediction and assess their underlying assumptions.
1 INTRODUCTION
Highly automated driving vehicles will fundamen-
tally change our personal mobility in the future. Au-
tonomous driving will enable people to spend their
time in the car with productive or relaxing tasks in-
stead of driving by themselves. This will include
office tasks like writing e-mails, having Skype calls
and video conferences or relaxing tasks like stream-
ing music and videos. Furthermore the car itself has
to receive continuously updates regarding the current
traffic situation to ensure the safety and the comfort
of its passengers. This includes the sharing of per-
sonal sensor readings between the vehicles directly
or through a data processing backend (Here, 2015),
(Lee et al., 2016), (Jomrich et al., 2017b). All these
services require a robust and well performing mobile
data connection. However due to their mobility the
vehicles are constantly experiencing a different con-
nection quality. Reasons therefore are the varying de-
ployed technology in the cellular network, its density
and the usage related available resources of the cell
towers. To ensure a reliable data connection with a
high quality of service under such fluctuating con-
ditions, different concepts and techniques have been
investigated. Several researchers proposed the idea
to enhance the insufficient network coverage infor-
mation offered by the providers through data, which
is collected by the vehicles themselves (Kamakaris
and Nickerson, 2005), (Nagel and Morscher, 2011),
(Kelch et al., 2013), (P
¨
ogel and Wolf, 2015). Through
their own communication equipment the cars are able
to sense their currently experienced connection qual-
ity. By collecting and sharing this data the network
coverage maps of the cellular providers can be en-
hanced into so called connectivity maps, which poses
a much better accuracy regarding the to be expected
network quality at a certain location in the map.
Besides this concept further approaches try to pre-
dict specific key performance parameters of the over-
all network quality in a near real time fashion. There-
fore those so called online estimation algorithms only
measure the network quality, which is currently expe-
rienced by the vehicle and try to predict future values
based on the most recent measurements. One of the
most application-relevant network quality parameters
is the expected future throughput bandwidth. Many
scientists have developed different online prediction
Jomrich, F., Herzberger, A., Meuser, T., Richerzhagen, B., Steinmetz, R. and Wille, C.
Cellular Bandwidth Prediction for Highly Automated Driving.
DOI: 10.5220/0006692501210132
In Proceedings of the 4th International Conference on Vehicle Technology and Intelligent Transport Systems (VEHITS 2018), pages 121-132
ISBN: 978-989-758-293-6
Copyright
c
2019 by SCITEPRESS – Science and Technology Publications, Lda. All rights reserved
121

algorithms for this value.
Within this paper we now investigate the applica-
bility of such throughput estimation algorithms for a
large scale deployment in a mobile communication
scenario as described by the highly automated driv-
ing vehicles. Thus in contrast to existing work (Lu
et al., 2015), (Jin, 2015), (Margolies et al., 2016),
we only rely on data that is easily obtainable from
low cost hardware instead of relying on specialized
measuring equipment or software tools. To make our
obtained results comparable to the work of other re-
searchers we rely on the public APIs of nowadays An-
droid smartphones. Those devices can obtain the re-
quired network quality parameters in a similar timely
resolution and accuracy as currently deployed vehic-
ular communication hardware.
Furthermore we propose and examine the idea to
combine both mentioned concepts (the connectivity
map and the online throughput estimation) together,
to achieve better throughput prediction results. There-
fore we assume and analyse whether location specific
historical measurement data can be used to optimize
the training of instantaneous throughput estimation
algorithms.
As a further contribution we give a broad overview
about Related Work in the research area of connectiv-
ity maps and online throughput estimation techniques
in the following Chapter 2.
The rest of this paper is structured as follows.
Within Chapter 3 we first explain the general ap-
proach and the setup used to obtain the cellular mea-
surements. Furthermore the selected highway sce-
nario and the used measuring devices with their ob-
tained quality parameters are described. Outgoing
from the obtained measurements we evaluate the ef-
fects of a variety of investigated parameters on the
overall performance of throughput estimation algo-
rithms in the context of a mobile communication sce-
nario in Section 4. We summarize our obtained re-
sults and give a short outlook regarding future work
in Chapter 5.
2 RELATED WORK
To address the general challenge of continious adapta-
tion regarding changing connectivity conditions while
moving in traffic, different techniques have been pro-
posed and investigated by researchers. They can
be grouped into different categories based on the
life time of data upon which they rely as well as
their achieved accuracy and prediction horizon as de-
scribed by (Bui et al., 2014). Within this work we
investigate the possibilities that lie in the combination
of two of such concepts (connectivity maps and on-
line throughput estimation algorithms). Therefore we
now give an overview of Related Work in those two
areas of research.
2.1 Connectivity Maps
The general idea behind the connectivity map is to
collect and store information about the network qual-
ity, which is experienced at certain areas of the map.
For example this can include parameters like the re-
ceived signal strength, the experienced latency and
the measured throughput bandwidth of the network.
In the context of vehicular communication the cars
are considered as probes to generate such a connec-
tivity map. They measure the network with their per-
sonal communication equipment and share such in-
formation with a data collecting backend server. This
gathered data set within the server is than used to pre-
dict the future network quality of a vehicle based on
its current location and driving direction. Most com-
monly this is achieved by taking the average of the
historical data for equally sized areas of the map and
considering those average values as the most likely to
be experienced value in future.
One of the earlier works, which proposed the con-
cept of a connectivity map is done by (Kamakaris
and Nickerson, 2005). Within their work the authors
investigated the correlation between the Received
Signal Strength Indication (RSSI) and the measured
throughput values within WiFi networks. In their
work the authors addressed the short average lifetime
of predictions that can be achieved by the connec-
tivity map based on its stored measurements. This
is due to the highly dynamic variations of the over-
all network quality over time. The data contained in
the map therefore gets quickly outdated and has to be
constantly updated by remeasuring the current situa-
tion. The authors state that the reasons therefore are
manifold, for example the fluctuation of actual users
in the network and thus the current network load, but
also environmental influences like buildings.
Kelch et al. (Kelch et al., 2013), Lu et al. (Lu
et al., 2015) and P
¨
ogel et al. (P
¨
ogel and Wolf, 2012),
(P
¨
ogel and Wolf, 2015) specifically focus on the cre-
ation of a connectivity map of the cellular network
and its possibilities for vehicular usage scenarios. A
similar kind of connectivity map is also considered to
be established in our contribution.
In the work of (Kelch et al., 2013) and (Lu et al.,
2015) both authors independently from each other in-
vestigated the usability of connectivity maps to opti-
mize the overall experienced network quality of 3G
HSDPA cellular networks. Therefore both authors
VEHITS 2018 - 4th International Conference on Vehicle Technology and Intelligent Transport Systems
122

suggest to correlate the so called Cellular Quality In-
dex (CQI)
1
with the achieved throughput rate at dif-
ferent locations of a map. The CQI is a parameter de-
rived from the different measured signal strength pa-
rameters (Reference Signal Received Power - RSRP,
Reference Signal Received Quality - RSRQ and Re-
ceived Signal Strength Indication - RSSI) to indicate
the overall channel quality. While driving a vehicle
Kelch et al. periodically executed the download of a
large file via the HTTP protocol using the TCP trans-
port layer protocol to fully utilize the present channel
and to measure the maximum achievable bandwidth.
The Channel Quality Indicator (CQI) was collected in
parallel by polling it each second from the used cellu-
lar modem via an AT-command.
In a similar way (Lu et al., 2015) send data for a
consecutive time of 60 seconds via the UDP protocol
to obtain active measurements of the currently present
HSDPA cell. They used Nexus 5 smartphones as mea-
suring devices. The CQI values were retrieved with a
high precision timely resolution of 2-8 ms by connect-
ing those smartphones to the so called Qualcomm eX-
tensible Diagnostic Monitor (QXDM)
2
framework.
As a result of their investigation both authors
suggest the Channel Quality Indicator to be a good
value to predict the achievable throughput. They state
this as possible, as an exact mapping of the Chan-
nel Quality Indicator onto the reserved resources and
the used modulation scheme of the celltower is pos-
sible. Those two parameters than directly specify the
granted available bandwidth. Such an exact mapping
however is not possible any more in the more ad-
vanced 4G/LTE networks
1
, which are investigated in
our work. Furthermore the achievable network speeds
in 4G networks are far larger than the speeds obtained
by Kelch et al. and Lu et al., being limited in the peak
to only 7,2 Mbit/s. This makes the predictability more
difficult as larger variations in the achievable through-
put rate are possible. We argue that although we ex-
pect the CQI as well to be an important parameter
in the throughput prediction, it should not be consid-
ered as sufficiently enough. Thus we investigate fur-
ther parameters (see Section 3) in our personal work,
which describe the overall network quality and can
be stored within the connectivity map as well. The
work of (Lu et al., 2015) further relies on the highly
accurate CQI values obtained via the QXDM toolset.
This hinders an actual large scale deployment, as such
software requires expensive licenses and might not be
easily deployable on low cost hardware, as used in our
work.
(P
¨
ogel and Wolf, 2012) also investigate the pos-
1
www.sharetechnote.com/html/Handbook LTE CQI.html
2
Diagnostic Monitor. http://goo.gl/ibV7g1
sibilities of a connectivity map to predict certain net-
work parameters in the vehicular context. This in-
cludes the next cell tower, to which a future handover
of the current connection will be performed, as well
as the future to be experienced bandwidth. In a fur-
ther work (P
¨
ogel and Wolf, 2015) this gathered infor-
mation is than used to improve a variety of network
services like adaptive video streaming and the han-
dover between different network technologies (2G,
3G networks). Similiar to (Kelch et al., 2013), (P
¨
ogel
and Wolf, 2012) collected active measurement data
from a productive HSDPA network by performing
drive tests. Furthermore both approaches only rely on
historical collected data without taking into consid-
eration currently measured quality parameters of the
moving vehicle. (P
¨
ogel and Wolf, 2012) stated this as
a future work in their research, however did not fur-
ther investigate it in (P
¨
ogel and Wolf, 2015).
In conclusion of this section it can be summarized
that the connectivity map is capable to improve the
overall network experience of vehicles by leveraging
its historic data to plan future network transmissions
accordingly. However due to the high timely fluctu-
ation of the overall network quality as described by
(Kamakaris and Nickerson, 2005), we argue that the
data stored within the connectivity map should not
be considered sufficient enough. In addition instanta-
neous measurements of the currently experienced net-
work quality should be taken into account, too. A va-
riety of contributions, which only rely on those instant
values, are presented in the following Section 2.2.
2.2 Online Throughput Estimation
As one of the earlier contributions within the field of
instantaneous throughput prediction (Xu et al., 2013)
develop PROTEUS, a system interface, which col-
lects instantaneous network performance parameters,
such as throughput, loss rate and one way delay of 3G
networks to predict the future network performance.
The authors did not investigate the performance of
their approach regarding the more advanced 4G/LTE
networks as it is the case in our contribution. PRO-
TEUS relies on Regression trees to enable the im-
provement of services such as VoIP, video confer-
encing and online gaming. To realize its future net-
work predictions PROTEUS only relies upon the last
20 seconds of experienced network performance and
completely avoids any form of previous offline train-
ing.
(Liu and Lee, 2015) addressed this gap by rely-
ing on previously driven trace data of 3G networks
to train their online throughput estimation approach.
The estimator itself relied upon 60 average through-
Cellular Bandwidth Prediction for Highly Automated Driving
123

put samples of 5 seconds long data transmission (300
seconds in total). This data is then used to predict
the following 300 seconds of future throughput. The
authors did not specifically investigate a mobile sce-
nario, in which the measuring probes are moving,
they still support our assumption regarding the sig-
nificant impact of locality by stating that their ob-
tained results have been different for varying loca-
tions, where the measurements have been performed.
As a small disadvantage their approach has to rely
upon information gained by initially transmitting data
to be able to predict the remaining transmission qual-
ity. This approach might not be feasible for only short
term transmissions of small amounts of data as it is
the case in many automotive scenarios like sensor data
uploads from the vehicles or map updates for highly
automated driving vehicles as described in our pre-
vious works (Jomrich et al., 2017b), (Jomrich et al.,
2017a).
(Jin, 2015) are one of the first works, who inves-
tigated 4G/LTE cellular networks for instantaneous
throughput prediction. The authors used ensemble
learner to predict the future throughput and also re-
lied on the QXDM toolset described previously. Thus
they were able to obtain a large set of precise network
parameters (e.g. the number of assigned Resource
Blocks for each client), which would otherwise not be
available. The authors share our opinion, that relying
on the QXDM toolset makes a current large scale de-
ployment not possible as considered by our approach.
The currently available devices (October 2017) do not
provide such values ”out of the box”.
(Margolies et al., 2016) investigate the influence
of so called ”slow-fading” on the obtained channel
quality of 3G networks, which is experienced specifi-
cally by mobile nodes (e.g. vehicles), which are mov-
ing between different cell towers. Instead of predict-
ing the future achievable throughput (as it is the case
for our work) the authors try to predict the position
of the vehicle without relying on GPS sensors. The
current location of the vehicle therefore is predicted
based on the experienced short term history of signal
quality. In a second step the estimated position seg-
ment, in which the car is currently residing, is than
queried from a connectivity map to provide the aver-
aged throughput value of this specific segment for fur-
ther transmission planning. Thus the approach does
not include any kind of online estimation for the fu-
ture throughput value. Similar to previous work all
the measurement values have been obtained in a fine
granular resolution of only some milliseconds by us-
ing the QXDM tool set.
Ide and Wietfeld et al. (Wietfeld et al., 2014),
(Ide et al., 2016) propose a predictive Channel-Aware
Transmission scheme (pCAT), which tries to identify
so called connectivity hot spots of good network qual-
ity based on measuring the experienced current and
historic Signal To Noise Ratio (SINR) to improve the
overall network performance, especially the required
energy consumption for each data transmission. Al-
though the authors do not predict the actual achiev-
able throughput, they propose in their first work (Wi-
etfeld et al., 2014) an approach that combines his-
torical measured SINR values stored in a connectiv-
ity map and currently measured values together to
identify the connectivity hot spots. Thus the gen-
eral concept is similar to the investigated idea within
our work. In their second work however the authors
then focus only on location-independent connectivity
data to feed their channel-aware transmission scheme.
Also only the Signal To Noise Ratio (SINR) is inves-
tigated as an influencing factor of the channel quality.
In our work we take additional quality parameters into
account.
(Samba et al., 2017) present another approach
to predict the currently achievable throughput band-
width in current 4G networks. Therefore they rely on
the usage of Random Forest classification trees. In
contrast to the work of Ide and Wietfeld et al. the
authors also consider further parameters like the Re-
ceived Signal Strength Indicator (RSSI) and the Ref-
erence Signal Received Quality (RSRQ) in their ap-
proach. They also take the context of their perfor-
mance measurements into consideration, e.g. the cur-
rent distance between the device and the cellower and
its moving speed, but they do not include the exact
location. As a result they do not provide location spe-
cific training data sets to their machine learning clas-
sifier like it is the case for our work. Additionally
to the information collected by the device the authors
further rely on a data set provided by a cellular net-
work provider, which offers further details about the
radio access network. Samba et al. show, that this
information in combination with the achieved data
from the end user devices improve the estimation re-
sults. However we argue that such information should
not be expected to be shared on a common basis be-
tween the network providers and vehicles. Thus a
general deployment of a predicition approach that re-
lies on such data is questionable. Furthermore the au-
thors obtain their measuring data from a crowdsourc-
ing campaign in which 30 different users performed
a total of 5700 measurements in 350 different cells.
This results in a large diversification of different loca-
tions. For our measurements we narrow our measure-
ment campaign to only a small part of the German
highway A60 to achieve a significant high number of
measurement results in a small amount of cells as de-
VEHITS 2018 - 4th International Conference on Vehicle Technology and Intelligent Transport Systems
124

scribed in Section 3.2.
Our personal contribution is now described in the
following Section 3. We present our findings regard-
ing a throughput estimation algorithm to be used in
a purely mobile context. Therefore we investigate
possibilities to combine both presented concepts to-
gether: the connectivity map with its historic data
set regarding future locations and the online esti-
mation algorithms with their measurements of latest
achieved network quality to predict the future experi-
enced throughput.
3 CONCEPT
As the main contribution of this work we want to in-
vestigate the possible performance of online through-
put estimation algorithms in a future large scale de-
ployment. Therefore we let our investigated through-
put estimation algorithms only rely upon network
quality parameters, that can be collected ”out of the
box” from currently available (October 2017) public
APIs and end customer hardware instead of relying
on expensive diagnostic toolsets or special hardware
as frequently used in the presented Related Work. The
exact setup is described in the following.
3.1 Measuring Setup
To make our measurement results and achieved
estimation performance comparable for other re-
searchers, we used Android smartphones as measur-
ing probes. Such devices are able to provide a sim-
ilar amount of different network quality parameters
in a timely granularity, that is also achieved by cur-
rent built-in communication systems, but instead are
freely available for easier comparison.
Most of the contributions presented in the Re-
lated Work investigated their personal concepts by
probing older 3G UMTS and HSDPA networks. In
contrast to them we focused our measurement cam-
paign purely on active measurements of the current
4G/LTE network. In contrast to the work of(Samba
et al., 2017), which also investigated 4G networks, we
used newer devices of the LTE category 6 (Samsung
A3) and 9 (Samsung S7), which are able to rely on
new technological features like Carrier Aggregation
or 4x4 MIMO. The measurements of those devices
were compared with a device of category 4 (Google
Nexus 5), which cannot rely on those technical fea-
tures.
To collect the required quality indicators for the
estimation algorithms, we developed an Android ap-
plication as described in our previous work (Jomrich
Table 1: Obtained measurement parameters of the different
devices for network quality estimation.
Device
type
used features for training
Samsung
A3 / S7
Signal Strength Level, Timing Advance,
RSRP, RSRQ, CQI, RSSNR, average speed
of vehicle
Nexus 5 same as A3 and S7, but no Timing Advance,
CQI and RSSNR
et al., 2017a) that logged all available network pa-
rameters, which we could obtain from current An-
droid OS systems, while performing our throughput
measurements. Those pairs of passive obtained net-
work quality parameters and active throughput mea-
surements were then used as data for our investigation
of throughput prediction with state of the art machine
learning techniques as presented in chapter 4. De-
pending on the specific device type different network
quality parameters could be obtained via the usage of
the Android API. The Samsung A3 and the Samsung
S7 devices could provide the same feature set. The
Nexus 5 device in contrast provides only a reduced
feature set as described in the Table 1.
Based on the provisioning constraints of the An-
droid OS all described network parameters were ob-
tained with a timely resolution of up to one second.
This is a rather coarse timely resolution in compari-
son to the specialized tooling software like Qualcom’s
QXDM, which is used frequently in other Related
Work and can obtain the data within only some mil-
liseconds granularity. Thus we expect less accurate
prediction results.
Similar to the Related Work of (Lu et al., 2015) we
used the UDP transport layer protocol to perform our
throughput measurements. Therefore we modified the
described application in (Jomrich et al., 2017a) to be
able to execute continuous measurements. We se-
lected the UDP protocol as our transport layer pro-
tocol, as we wanted to be able to perform our mea-
surements as quickly as possible without wasting any
costly cellular traffic data. UDP in contrast to the TCP
protocol does not rely upon protocol specific control
mechanisms like slow start and congestion control.
Thus by using UDP we could probe the upload and
download speed right from the beginning of our mea-
surement transmission. To verify, that our application
was able to congest the available cellular connection,
we used the LTE network sniffer Imdea OWL devel-
oped by (Bui et al., 2017) as a ground truth. Within
their work Bui et al. could verify that smartphone ap-
plications can reliably measure the available through-
put by decoding the LTE control channel and correlat-
ing the transmitted packets of the measurements with
the decoded results. We tested different probing set-
Cellular Bandwidth Prediction for Highly Automated Driving
125
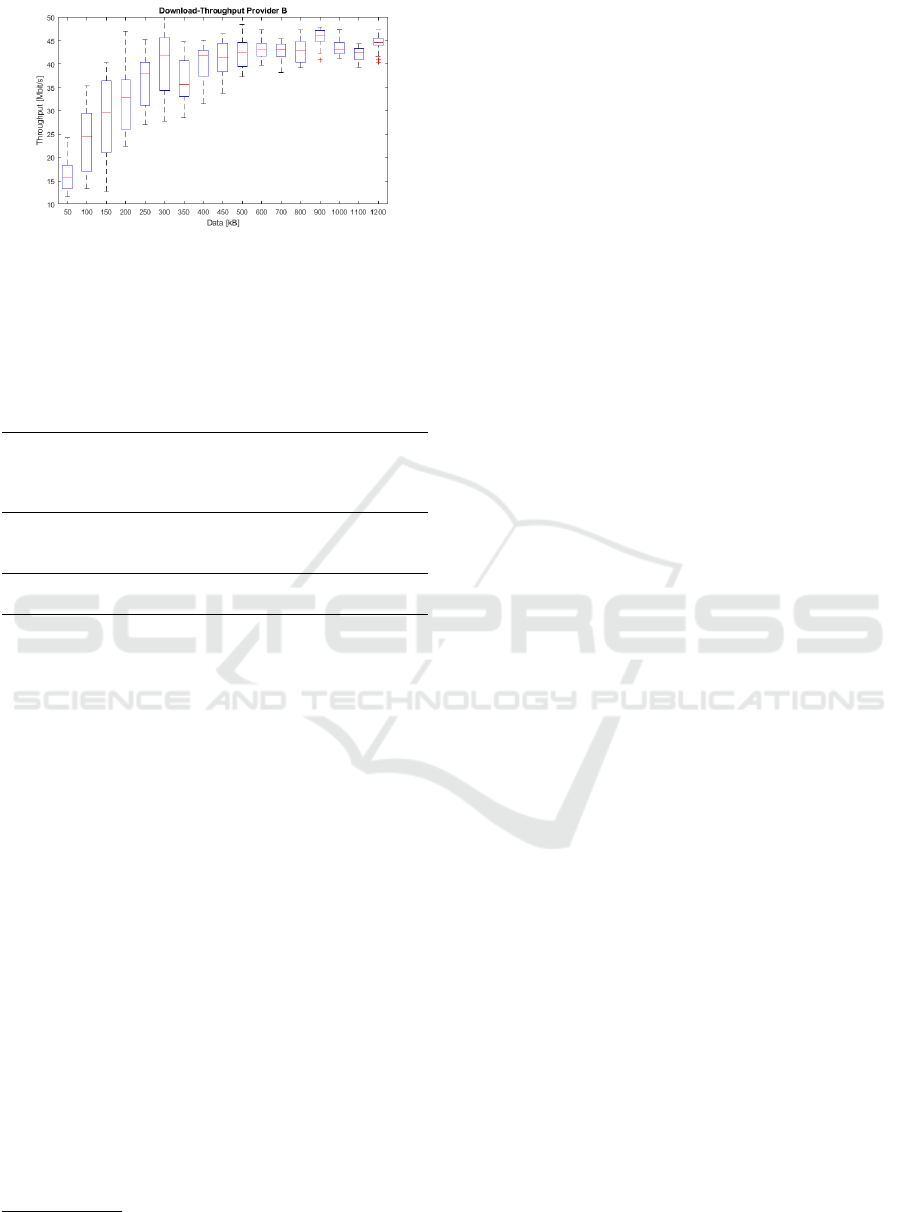
Figure 1: Investigation of the amount of data that satu-
rates the bandwidth of one single LTE cell in the download.
Within this picture the obtained results for Provider B are
shown. They are similar for Provider A.
Table 2: Measurements executed for two different providers
with three different devices of different categories.
Provider
A
Provider
B
Device Samsung
S7
(Cat. 9)
Google
Nexus
5
(Cat. 4)
Samsung
A3
(Cat. 6)
Samsung
S7
(Cat. 9)
Amount of
measure-
ments
36775 12834 9166 15513
Amount of
data [GB]
27,58 9,63 6,87 11,63
tings to conduct our measurements as data efficient
as possible. Besides data efficiency also measuring
accuracy was ensured by verification through Imdea
OWL. The achieved results of this investigation are
presented in figure 1.
As a concluding result we conducted our further
measurements throughout the testing campaign by
sending a packet train of 750 Kilobyte of data to a
dedicated server and receiving the same amount of
data via download from it. We ensured the server
to be sufficiently connected with around 500 MBit/s
of transmission speed in both directions. In total
an amount of 74.468 upload and download speed
measurements could be collected. The distribution
of the measurements is indicated by Table 3. We
collected measurements for two different providers,
which could provide 4G/LTE connectivity along our
complete test track. The collected data set will be
made publicly available on GitHub
3
. We hope this
way to provide a new benchmark data set for further
future approaches of related scientific work.
3
https://github.com/florianjomrich/
cellularLTEMeasurementsHighwayA60
3.2 Scenario Description
In contrast to most of the presented Related Work,
we focused our measurement campaign specifically
on a mobile scenario. Highly automated driving is
currently developed with a major interest regarding
the initial deployment on highways. To investigate
the possible usage of our concept for such a commu-
nication scenario, we selected a short section on the
Germany highway A60 for our test measurements as
shown in Figure 2. Throughout this track the smart-
phones have always been connected to 4G/LTE net-
work cells. At certain segments even 4G+ connectiv-
ity, which indicates the availability of Carrier Aggre-
gation, was available for the A3 and the S7 devices.
The measurement campaign was conducted for a pe-
riod of 3 weeks. Within the campaign we compared
the networks of two German providers, in the follow-
ing named A and B. As an interesting side constraint
all the cell towers of Provider A operated in the LTE
Band 20 at frequencies of 800 MHz. For provider B
the situation was contrary. Nearly all it’s cell towers
(with only one exception) operated in the LTE Band
3 at frequencies of 1800 MHz. The different cells
to which the smartphones have been connected are
colourised in Figure 2 with different colours.
3.3 Investigation of Machine Learning
Algorithms for Use in Evaluation
As an initial investigation, before executing our eval-
uation we compared different Ensemble Learner algo-
rithms with each other, regarding their overall perfor-
mance on our data set. Namely we investigated Gra-
dient Boost a boosting machine learning algorithm, as
well as the Random Forest as one of the representa-
tives for the bagging technique. Throughout our in-
vestigation we could not identify a certain advantage
off one of the algorithms over the other. Therefore
to be comparable with the newest Related Work of
(Samba et al., 2017) we decided to further rely in our
evaluation upon the Random Forest algorithm. The
presented results in the following Section 4 therefore
have been obtained by using the Random Forest re-
gression algorithm for the prediction of the through-
put value.
4 EVALUATION
We now present the obtained evaluation results gained
from our three weeks long measurement campaign.
To ensure a representative timely distribution in our
dataset we performed our test drives each day of the
VEHITS 2018 - 4th International Conference on Vehicle Technology and Intelligent Transport Systems
126
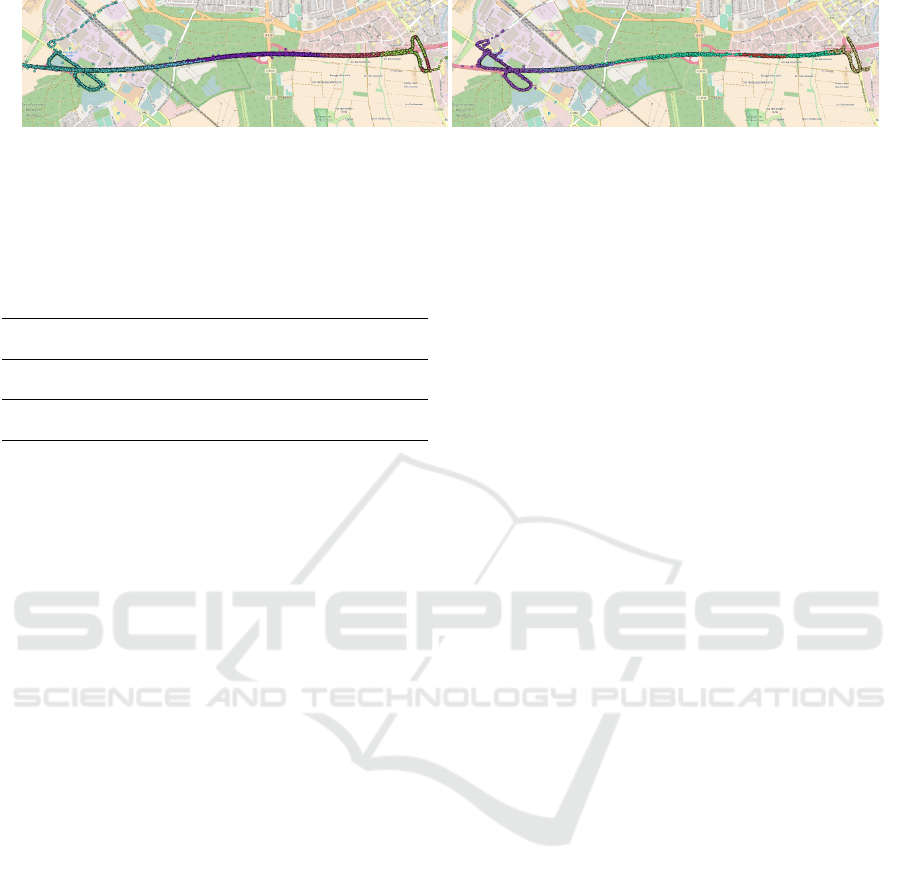
(a) Provider A (b) Provider B
Figure 2: Selected driving scenario for the measuring campaign. Measurements of different cells are coloured differently.
c
OpenStreetMap contributors.
Table 3: Median of achieved throughput values for both
providers.
Provider
A
Provider
B
Device S7 Nexus
5
A3 S7
Median upload speed
[Mbit/s]
13,40 13,47 13,48 13,37
Median download
speed [Mbit/s]
29,25 30,88 34,32 35,69
week, separated into two different time slots, a morn-
ing part (from 8 till 12 o’clock) and an afternoon part
(13 till 17 o’clock).
4.1 General View on the Collected Data
As the first step of our evaluation we did a check of
the distribution of obtained throughput measurements
in the upload and download direction. Therefore we
separated the data in further sub sets accordingly to
the three different devices for each of the two different
operators, which networks have been used in the cam-
paign. The resulting histogram plots are presented
in Figure 3. With respect due to space constraints,
we only show the results obtained for Provider A.
The plots for Provider B however are very similar
and the achieved median throughput values for the
upload and download direction of both providers is
shown in Table 3. Based on those values we could
not identify any specific advantages of the newer de-
vices with LTE category 6 (A3) and 9 (S7) compared
to the older category 4 devices (Nexus 5). The medi-
ans of the upload and download are nearly the same
for the devices used for each provider. Provider B
could only achieve a small performance advantage of
around 5 Mbit/s in the median in the download com-
pared to the same device used in Provider A’s net-
work. These findings support the statement of (Jin,
2015), in which the authors identified the providers to
compensate certain technical disadvantages of older
devices through a fair scheduling trade off between
old and new devices. Older devices get assigned
more resource blocks throughout a transmission and
therefore achieve comparable data transmissions like
newer devices.
4.2 Correlation between Training Data
Size and Prediction Accuracy
The correlation between the size of the used train-
ing data set for the machine learning approach and
the resulting prediction accuracy was one of the first
questions, which we wanted to investigate. Within all
the presented Related Work this factor has not been
discussed. It however is an important question for
scientists or companies, who want to perform simi-
lar measurements and to ensure the reliability of our
obtained results. We investigate how the prediction
accuracy is related to the actual used training data set
size and whether this correlates as well with the spe-
cific type of the device, the provider or the direction
of the data transmission. To answer this questions we
selected randomly a subset of all our measurements,
which have been conducted by the device for the cer-
tain provider and applied the Random Forest Algo-
rithm for regression on it. To ensure the significance
of these results we repeated the process of random se-
lection and algorithm application for 30 times. In Fig-
ure 4 the obtained results are presented as box plots.
Interestingly the variance and the prediction accuracy
of all the different trained models saturated between
1500 and 2000 measurements used for training, inde-
pendent of the specific device under consideration or
the provider under test. The further improvements re-
garding variance reduction and increasing the predic-
tion accuracy, which could be achieved by using more
training data (up to 10.000 measurements), were only
minor.
4.3 Comparison between Upload and
Download Prediction Accuracy
Most of the presented Related Work focused on the
prediction of the throughput in the download direction
to optimize the user experience of applications, which
are receiving data on the users device. The most
frequently used example are adaptive video streams.
Future autonomous driving vehicles however won’t
be only consumers of data. They will be provid-
ing relevant personal sensor information to central
Cellular Bandwidth Prediction for Highly Automated Driving
127
(a) Nexus Upload (b) Nexus Download (c) S7 Upload (d) S7 Download
Figure 3: Distribution of achieved throughput measurements in the network of Provider A.
backend servers. This data will then be processed
and shared between all traffic participants to further
enhance the overall safety while driving. Further-
more the passengers inside the vehicle might also re-
quest different kinds of services, which require a cer-
tain upload throughput, for example for Skype video
calls. To also support such applications we mea-
sured the achievable throughput in the upload and in
the download direction throughout our measurement
campaign.
The achieved results for the different transmission
directions are presented in Figure 4. The plots show
the achieved prediction accuracy of the Random For-
est algorithm trained for regression learning. To be
comparable with the Related Work we used the same
metric like (Samba et al., 2017), the R
2
value. R
2
is
defined as described by Formula 1, where ¯y is the av-
erage of all considered throughput measurements, y
i
is the current throughput estimation and is ˆy
i
the pre-
dicted throughput value.
R
2
= 1 −
∑
n
i=1
( ˆy
i
− y
i
)
2
∑
n
i=1
( ¯y − y
i
)
2
(1)
We have to state, that with our obtained measure-
ment data set we were not able to reproduce the over-
all achieved performance of the Random Forest Algo-
rithm’s estimation accuracy as stated by (Samba et al.,
2017). The most likely reason therefore might be the
difference in the overall transmission time between
our two different approaches. Samba et al., as stated,
conducted a download measurement by transmitting
4 MB of data. In a former work of them (Samba
et al., 2016), the authors stated that in average one
of their data transmissions took about 8 seconds of
time. Within our current work however, we wanted
to keep the data transmission time as short as possi-
ble, as due to the mobility of the vehicle the cellular
network quality is also constantly changing and in-
fluencing the obtained measurement result. Thus we
only transmitted an amount of 750 KByte of data per
measurement to still ensure a congestion of the data
channel as described in Section 3.1. In a stationary
scenario transmitting more data over a longer period
of time possibly compensates the short term fluctu-
ations of the network, when calculating the overall
throughput. Thus the machine learning might become
more reliable, as only a long term average throughput
is being used for learning, which contains less fluctu-
ation. This however might not be a feasible approach
in a pure mobile context, as investigated within our
work, in which changing quality effects due to the
mobility of the vehicle play a much more important
role. A possible trade off between those two noises
to achieve a higher precision of the throughput pre-
diction in our mobile context will be investigated by
us in future work. Another possibility to improve
the achievable performance could be to improve the
timely resolution of obtained network quality param-
eters, to get a more accurate impression of the timely
behaviour of the network (e.g by relying on QXDM).
For our current approach however this is not possi-
ble, as the interval for receiving quality parameters is
limited by the Android OS.
Still the achieved results show, as expected, that
the actual value of the obtainable download speed is
more difficult to predict, than the corresponding one
for the upload speed. This holds true for all devices
and both investigated providers. The most probable
reason therefore is the more diverse distribution of
achievable download throughput values compared to
the distribution of the upload values (see Figure 3).
Due to a wider range of possible outcome values the
prediction of the machine learning approach becomes
more difficult. This especially holds true for mod-
ern 4G networks, which achieve a higher bandwidth
than older 3G technology. Further possible reasons
might be the higher modulations schemes, which can
be used in the download direction or the usage of
the MIMO antenna technique for the download data
stream. Both factors might influence the overall con-
sistency of the signal quality during the execution of
the measurement.
4.4 Comparison between Different
Devices
Throughout our measuring campaign we performed
the throughput estimation with three different devices
VEHITS 2018 - 4th International Conference on Vehicle Technology and Intelligent Transport Systems
128
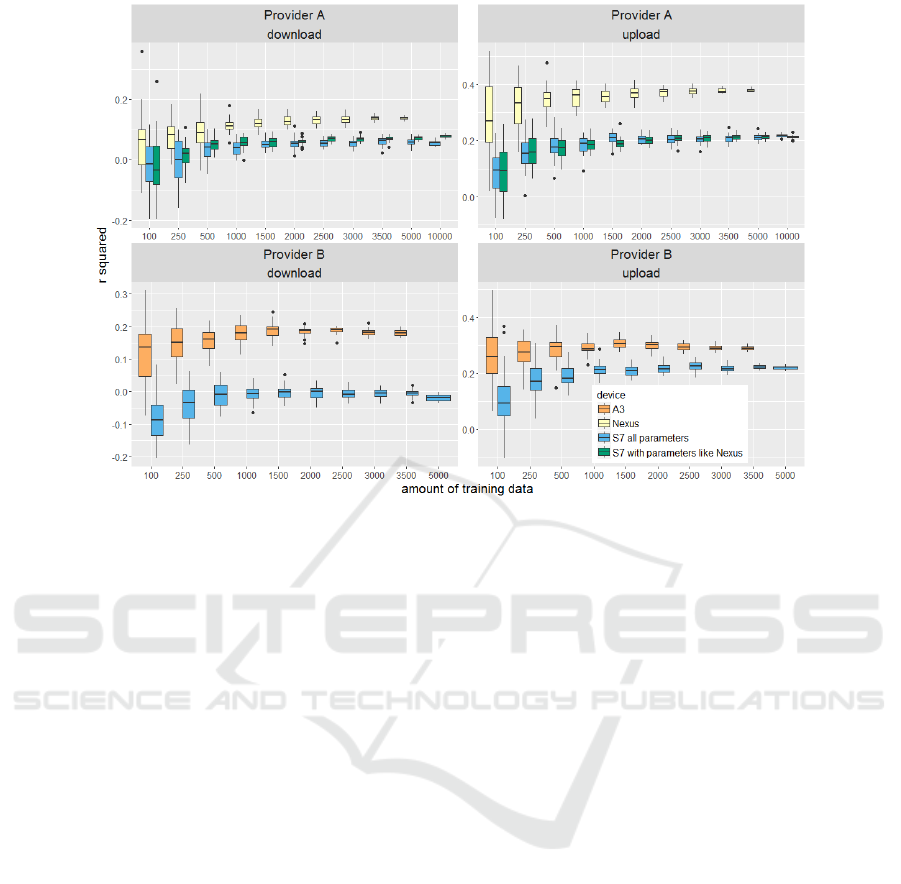
Figure 4: Comparison between the different devices for the different providers.
(Nexus 5, Samsung A3 and S7). Each device was re-
lated to a different LTE device category (4,6 and 9).
The significant amount of measurements collected by
each device (see Table 3) enables us to investigate
a comparison between them, in contrast to most of
the presented Related Work, where all devices were
considered together. Although the distribution of the
overall achieved throughput measurements are very
similar (see section 4.1) for all the devices, the pre-
diction performance of the Random Forest Algorithm
is quite different for each of them (see Figure 4). The
data provided by the Nexus 5 smartphone achieves the
highest prediction performance, although the set of
parameters, which the Nexus 5 can provide (see Table
1) is reduced. To investigate the possible influence of
those neglected network parameters (e.g. the Channel
Quality Indicator - CQI), we investigated the perfor-
mance of the estimation algorithm based on a training
data set of the S7 device, where those parameters have
not been considered for training (see Figure 4). The
obtained results therefore however are very similar to
the full set of parameters for the S7. The performance
of the Nexus 5 device still could not be reached. Most
surprisingly the performance of the throughput esti-
mation based on the measurements obtained from the
Samsung S7 device also performed worse in compar-
ison to the achieved results of the Samsung A3 de-
vice. Even though both devices provided us the exact
same set of network quality parameters. The possible
influence of Carrier Aggregation can only be consid-
ered for the comparison between the Nexus 5 device
and the S7. Still it would only explain the difference
for the download direction, as in the upload direction
no Carrier Aggregation is used. In contrast the A3
and the S7 both relied on this technology within our
measurements. In conclusion it can be stated, that the
specific hardware built into each device seems to play
a very important role in the achievable overall per-
formance of the estimation, although the overall ob-
tained measured throughput is nearly the same. An
investigation, if a longer throughput measurement (as
described in Section 4.3) can reduce these device de-
pendent effects, shall be conducted in future work.
4.5 Influence of Local Training Data
Compared to Global Training Data
As a further idea, which we propose in this work, we
investigated if the performance of an online through-
put prediction algorithm could be improved through
the usage of cell tower specific/geo-referenced train-
ing data. Such a functionality for example could be
realized through a connectivity map. Based on the
large scale historical data contained in the map, it
could provide specifically trained Ensemble Learners
for each cell tower along the path of the vehicle to
be used by the throughput estimation algorithm. In
our opinion, instead of only relying on a generalized,
non-geo referenced training set, this might possibly
increase the algorithms performance. To examine this
Cellular Bandwidth Prediction for Highly Automated Driving
129

idea, we generated decision models based on the data
specifically obtained from the eight cells, in which
we could gather the most measurements. Those eight
cells split up into four cells per provider. All those
measurements have been collected with a Galaxy S7
as measuring device. Those cell tower specific de-
cision models were than compared to decision mod-
els of equal size, which have been generated form
data obtained from all the other cells in which we
conducted measurements. For performance compari-
son both decision models (locally trained and globally
trained) were than tested on separated test data, which
was measured in the cell tower currently under inves-
tigation. We ensured the ratio between training data
size and testing data size to be 70:30. Again we re-
peated the experiment for 30 times with randomly se-
lected measurement sub sets to ensure the significance
of our obtained results. This time we calculated the
mean absolute error between the predicted throughput
value and the actual tested throughput value as met-
ric of comparison. Due to space we present only the
plots obtained for the four cells of Provider A. The re-
sults for Provider B were similar, but due to a smaller
amount of collected measurements per cell probably
not as representative. We certainly agree that by com-
paring only eight network cells with each other no
generalisation for the whole LTE network is possible.
However our resulting graphs show some visible ten-
dencies, which might become even more significant if
a more precise measuring approach or network qual-
ity parameters of a finer timely resolution can be used
in future work. As tendency it is visible, that in the
cells where the Random Forest algorithm performed
best or close to it, the decision tree with local training
data could improve the overall estimation accuracy
significantly. For cells, in which the algorithm did
not perform very well in comparison, the influence
was not significant. For one of those cells (cell D)
it even performed a bit worse in the upload direction.
The influences were more visible for the upload direc-
tion. This probably correlates again with the poorer
prediction performance, which the Random Forest al-
gorithm could achieve for the download speed based
on our collected measurement data set as discussed in
section 4.3.
In conclusion we state that our obtained results show
potential, that justifies further personal research re-
garding it in future work.
5 CONCLUSION AND FUTURE
WORK
In this paper we investigate the possible performance
of online throughput estimation algorithms for the
currently deployed 4G/LTE cellular network to ensure
a reliable connectivity quality for services required in
the context of highly automated driving vehicles. We
especially wanted to examine the possible applicabil-
ity of those algorithms in a large scale future deploy-
ment on existing communication hardware currently
built into the vehicles. Therefore we base our perfor-
mance estimates on a data set, which is collected by
using Android smartphones as comparable and low
cost hardware, that can be used ”out of the box” with-
out the requirement of any further special tooling or
equipment. We obtained a measurement data set of
over 74.000 throughput measurement values for the
upload and the download direction with correlated
network quality parameters over a period of three
weeks. This data set will be made publicly available
to the community for further investigation in future
work and as a support of other related research. Fur-
thermore we give a broad overview of Related Work
in the areas of connectivity maps and online through-
put estimation algorithms to enhance the overall ex-
perienced connection quality in vehicular communi-
cation scenarios. In addition we examine the idea to
combine the capabilities of both techniques together
by training the used Random Forest machine learn-
ing algorithm with localized training data, in compar-
ison to non-geographically referenced global training
data. In contrast to Related Work we specifically fo-
cused our measurement campaign of the cellular net-
work on an automotive and mobile scenario. Based
on the obtained results we can show, that the through-
put estimation in a mobile context is rather difficult
compared to a throughput estimation predicted for
a stationary scenario, as already performed in Re-
lated Work (Samba et al., 2016). A possible reason
therefore might be the contradicting influence of two
different noises. The general performance fluctua-
tion within the network can be reduced by conduct-
ing measurements over a longer period of time. Un-
fortunately in our mobile communication context this
introduces additional fluctuation through the move-
ment of the vehicle and the correlating changing net-
work quality. A possible tread off between those two
different noises to obtain better performance results
shall be investigated in future work. Furthermore we
could showcase the influence of different measure-
ment devices on the overall obtained estimation re-
sults for the 4G/LTE productive networks of two Ger-
man providers. For future work we will extend the
VEHITS 2018 - 4th International Conference on Vehicle Technology and Intelligent Transport Systems
130
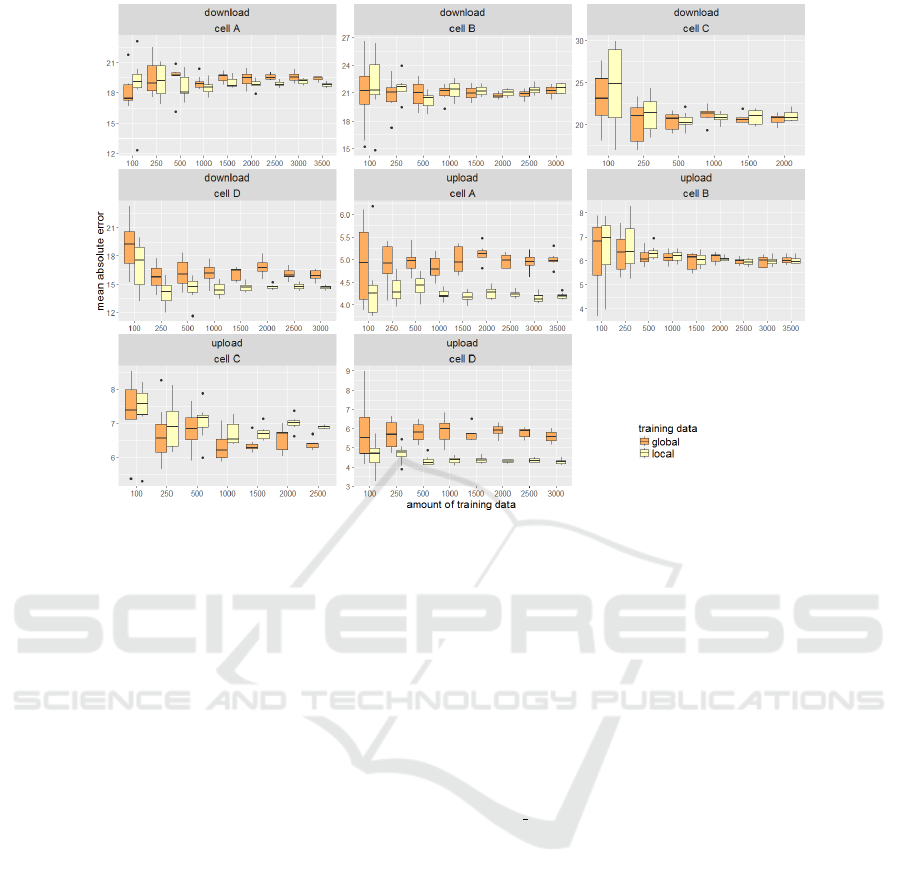
Figure 5: Comparison of the performance of local vs global training data sets of the same size.
presented work by investigating the performance of
currently deployed communication hardware within
the vehicles themselves and compare those achieved
results with our presented results. By continuing the
collection of measurement data also the investigation
of timely aspects like changing network load over the
day and provider specific traffic scheduling shall be
investigated. Therefore normalisation techniques as
described in (Gozalvez and Coll-Perales, 2013) shall
be taken into consideration. Furthermore a deeper in-
vestigation of new technological effects like the over-
all influence of Carrier Aggregation is necessary. As
the Android OS only indicates the availability of this
LTE-Advanced feature, but not its actual usage, it
is currently not possible to get further details to im-
prove the prediction accuracy. Thus our current work,
which only relies on the public available Android API
shall be enhanced in future with more in depth analy-
sis features.
REFERENCES
Bui, N., Michelinakis, F., and Widmer, J. (2014). A model
for throughput prediction for mobile users. In Euro-
pean Wireless 2014; 20th European Wireless Confer-
ence; Proceedings of, pages 1–6. VDE.
Bui, N., Michelinakis, F., and Widmer, J. (2017). Fine-
grained LTE radio link estimation for mobile phones.
Gozalvez, J. and Coll-Perales, B. (2013). Experimental
evaluation of multihop cellular networks using mobile
relays [accepted from open call]. IEEE Communica-
tions Magazine, 51(7):122–129.
Here (2015). Vehicle sensor data cloud ingestion interface
specification.
Ide, C., Nick, M., Kaulbars, D., and Wietfeld, C. (2016).
Forecasting cellular connectivity for cyber-physical
systems: A machine learning approach. In Nigge-
mann, O. and Beyerer, J., editors, Machine Learning
for Cyber Physical Systems, pages 15–22. Springer
Berlin Heidelberg. DOI: 10.1007/978-3-662-48838-
6 3.
Jin, R. (2015). Enhancing upper-level performance from
below: Performance measurement and optimization in
LTE networks.
Jomrich, F., Grau, M., Meuser, T., Nguyen, T. A. B.,
B
¨
ohnstedt, D., and Steinmetz, R. (2017a). Iccomqs in-
telligent measuring framework to ensure reliable com-
munication for highly automated vehicles. In Pro-
ceedings of 2017 IEEE Vehicular Networking Confer-
ence (VNC). SCITEPRESS Science and Technology
Publications, Lda.
Jomrich, F., Sharma, A., R
¨
uckelt, T., Burgstahler, D.,
and B
¨
ohnstedt, D. (2017b). Dynamic map update
protocol for highly automated driving vehicles. In
Oleg Gusikhin, M. H. and Pascoal, A., editors, Pro-
ceedings of the 3rd International Conference on Vehi-
cle Technology and Intelligent Transport Systems (VE-
HITS 2017), volume 3rd, pages 68–78. SCITEPRESS
Science and Technology Publications, Lda. Full Pa-
per.
Kamakaris, T. and Nickerson, J. (2005). Connectivity
Cellular Bandwidth Prediction for Highly Automated Driving
131

maps: Measurements and applications. pages 307–
307. IEEE.
Kelch, L., Pogel, T., Wolf, L., and Sasse, A. (2013). CQI
maps for optimized data distribution. In Vehicular
Technology Conference (VTC Fall), 2013 IEEE 78th,
pages 1–5. IEEE.
Lee, J., Kim, Y., Kwak, Y., Zhang, J., Papasakellariou, A.,
Novlan, T., Sun, C., and Li, Y. (2016). Lte-advanced
in 3gpp rel -13/14: an evolution toward 5g. IEEE
Communications Magazine, 54(3):36–42.
Liu, Y. and Lee, J. Y. (2015). An empirical study of
throughput prediction in mobile data networks. In
Global Communications Conference (GLOBECOM),
2015 IEEE, pages 1–6. IEEE.
Lu, F., Du, H., Jain, A., Voelker, G. M., Snoeren, A. C.,
and Terzis, A. (2015). CQIC: Revisiting cross-layer
congestion control for cellular networks. pages 45–
50. ACM Press.
Margolies, R., Sridharan, A., Aggarwal, V., Jana, R.,
Shankaranarayanan, N. K., Vaishampayan, V. A., and
Zussman, G. (2016). Exploiting mobility in propor-
tional fair cellular scheduling: Measurements and al-
gorithms. IEEE/ACM Trans. Netw., 24(1):355–367.
Nagel, R. and Morscher, S. (2011). Connectivity Prediction
in Mobile Vehicular Environments Backed By Digital
Maps. INTECH Open Access Publisher.
P
¨
ogel, T. and Wolf, L. (2012). Prediction of 3g net-
work characteristics for adaptive vehicular connectiv-
ity maps (poster). In Vehicular Networking Confer-
ence (VNC), 2012 IEEE, pages 121–128. IEEE.
P
¨
ogel, T. and Wolf, L. (2015). Optimization of vehicular
applications and communication properties with con-
nectivity maps. In Local Computer Networks Confer-
ence Workshops (LCN Workshops), 2015 IEEE 40th,
pages 870–877. IEEE.
Samba, A., Busnel, Y., Blanc, A., Dooze, P., and Simon, G.
(2016). Throughput prediction in cellular networks:
Experiments and preliminary results. In CoRes 2016.
Samba, A., Busnel, Y., Blanc, A., Dooze, P., and Simon, G.
(2017). Instantaneous throughput prediction in cel-
lular networks: Which information is needed? In
2017 IFIP/IEEE International Symposium on Inte-
grated Network Management (IM). IEEE.
Wietfeld, C., Ide, C., and Dusza, B. (2014). Resource
efficient mobile communications for crowd-sensing.
pages 1–6. ACM Press.
Xu, Q., Mehrotra, S., Mao, Z., and Li, J. (2013). PRO-
TEUS: network performance forecast for real-time,
interactive mobile applications. In Proceeding of
the 11th annual international conference on Mobile
systems, applications, and services, pages 347–360.
ACM.
VEHITS 2018 - 4th International Conference on Vehicle Technology and Intelligent Transport Systems
132
