
An Interactive Story Map
for the Methana Volcanic Peninsula
Varvara Antoniou
1
, Paraskevi Nomikou
1
, Pavlina Bardouli
1
, Danai Lampridou
1
, Theodora Ioannou
1
,
Ilias Kalisperakis
2
, Christos Stentoumis
2
, Malcolm Whitworth
3
, Mel Krokos
4
and Lemonia Ragia
5
1
Department of Geology and Geoenvironment, National and Kapodistrian University of Athens,
Panepistimioupoli Zografou, 15784 Athens, Greece
2
up2metric P.C., Engineering - Research - Software Development, Michail Mela 21, GR-11521, Athens, Greece
3
School of Earth and Environmental Sciences, University of Portsmouth, Burnaby Road, Portsmouth PO1 3QL, U.K.
4
School of Creative Technologies, University of Portsmouth, Winston Churchill Avenue, Portsmouth PO1 2DJ, U.K.
5
Natural Hazards, Tsunami and Coastal Engineering Laboratory, Technical University of Crete, Chania, Greece
{ilias, christos}@up2metric.com, {malcolm.whitworth, mel.krokos}@port.ac.uk, lragia@isc.tuc.gr
Keywords: GIS Story Map, Geomorphology, Methana Peninsula, Greece, Volcano, Geotope, Hiking Trails.
Abstract: The purpose of this research is the identification, recording, mapping and photographic imaging of the special
volcanic geoforms as well as the cultural monuments of the volcanic Methana Peninsula. With the use of
novel methods the aim is to reveal and study the impressive topographic features of the Methana geotope and
discover its unique geodiversity. The proposed hiking trails along with the Methana’s archaeology and history,
will be highlighted through the creation of an ‘intelligent’ interactive map (Story Map). Two field trips have
been conducted for the collection of further information and the digital mapping of the younger volcanic flows
of Kammeni Chora with drones. Through the compiled data, thematic maps were created depicting the lava
flows and the most important points of the individual hiking paths. The thematic maps were created using a
Geographic Information System (GIS). Finally, those maps were the basis for the creation of the main Story
Map. The decision to use Story Maps was based on the numerous advantages on offer such as user-friendly
mapping, ease of use and interaction and user customized displays.
1 INTRODUCTION
Recent advancements in digital Geographic
Information Systems (GIS) technologies can provide
new opportunities for immersively engaging public
audiences with complex multivariate datasets.
Story Maps can be not only robust but also
versatile tools for visualising spatial data effectively
and when combined with multi-media assets (e.g.
photos or videos) and narrative text, they can provide
support for scientific storytelling in a compelling and
straightforward way.
Thereby, Story Maps can be used in order to
disseminate and make scientific findings easy to
access and understand to broader non-technical
audiences (Janicki, J. et al., 2016; Wright, D.J. et al.,
2014).
The aim of the present research is to identify,
record, map and photographically image the special
volcanic geomorphs as well as the cultural
monuments of the Methana Peninsula (East
Peloponnese, Greece).
Methana peninsula is composed by 32 volcanic
craters with rough topography, belonging to the
western part of the Hellenic Volcanic Arc. Using
Story Maps along with novel methods and research
tools it is planned to reveal and highlight the peculiar
geomorphs of the Methana geotope and discover its
unique geodiversity.
Adopting Story Maps for this work offers a
number of advantages as compared to traditional
methods: friendly mapping, the ease of use and
understanding of the provided information, the
increased interactivity comparing to analogue or
simple web maps, the customized display based on
the user’s needs, the ability to import different kind
of media (images and videos) and ultimately the
ability to add explanatory text covering a wide range
of heterogeneous information.
68
Antoniou, V., Nomikou, P., Bardouli, P., Lampridou, D., Ioannou, T., Kalisperakis, I., Stentoumis, C., Whitworth, M., Krokos, M. and Ragia, L.
An Interactive Story Map for the Methana Volcanic Peninsula.
DOI: 10.5220/0006702300680078
In Proceedings of the 4th International Conference on Geographical Information Systems Theory, Applications and Management (GISTAM 2018), pages 68-78
ISBN: 978-989-758-294-3
Copyright
c
2019 by SCITEPRESS – Science and Technology Publications, Lda. All rights reserved

2 STUDY AREA
The Methana volcanic peninsula (Methana Volcano)
is located at the Western Saronic Gulf, approx.
163Km from Athens, covering an area of 50Km².
Methana Volcano is at the western part of the Aegean
volcanic arc extending from Saronic Gulf up to Kos-
Nisyros volcanic field at the eastern part (Fig. 1). The
Aegean volcanic arc belongs to the Hellenic Orogenic
Arc, which is formed along the convergent plate
boundary of the northwards subducting African plate
underneath the active margin of the European plate
(Nomikou et al., 2013). The peninsula of Methana has
the longest recorded volcanic history of any volcanic
centre in the Aegean Volcanic Arc, consisting of 30
volcanic cones. Particularly noteworthy are the
historical references regarding the volcanic activity of
the submarine volcano Pausanias, lying offshore the
northwest part of Methana peninsula (Pavlakis et al.,
1990), in the 3rd century BC.
Throughout Methana peninsula there is a well-
developed network of hiking trails, passing through
historic settlements, small churches, hot springs and
unique geomorphological features attributed to the
volcanic history (lava formations) and the complex
tectonic regime of the area (Pe-Piper and Piper,
2013). The overall length of the hiking network is
approximately 60Km, and based on the present study
the hiking distances range between 0.5Km up to
5Km. Moreover, the trails are rated into different
difficulty levels and in several cases appropriate
equipment is needed.
Volcanic activity in the area is considered to have
begun in the late Pliocene (Gaitanakis and Dietrich,
1995), and the last eruption took place in 230 BC
giving andesitic lava, at Kammeni Hora, as recorded
by the ancient geographer Strabo (Georgalas, 1962).
The Quaternary volcanic rocks on Methana
consist of domes and flows radiating from the central
part of the peninsula, overlying older, undated
volcanic rocks (inferred Pliocene or early Pleistocene
in age). At a map scale, many of the domes are
elongated in an east–west or northeast–southwest
direction. The volcanic style and rate of eruption are
closely related to periods of change in regional
tectonic style (Pe-Piper and Piper, 2013).
Moreover, Pe-Piper and Piper (2013) deciphered
the volcanological evolution of the Volcano in great
detail based on geochemical, geochronological
analyses and field observations. The following
volcanic history has been identified (Fig. 2):
Phase A. Late Pliocene. Small domes of andesite
and dacite were extruded on N–S-striking faults in
eastern and southern Methana. Either
synchronously or later, a larger volcanic edifice
grew somewhere near the present centre of the
peninsula.
Phase B. Erosion of the central edifice to form the
volcanoclastic apron, perhaps associated with
faulting and uplift.
Phase C. Eruption of basaltic andesite now
preserved in northern Methana around
Kounoupitsa, at Ag. Andreas and Akri Pounda. A
series of explosive Plinian eruptions deposited in
the northern and eastern parts of the
volcanοclastic apron and at Akri Pounda. Erosion
of the central edifice and volcanοclastic
deposition on the apron continued. The age of
phase C is poorly constrained — the 1.4 ± 0.3 Ma
date on a dome in northern Methana is only
tentatively correlated with this phase.
Phase D. Andesite flows in the north-western part
of the peninsula and dacites in the south show
some geochemical similarities to phase C (e.g.
high TiO
2
content), but overlie the volcanoclastic
apron and its associated erosion surface in eastern
Methana. Imprecise radiometric dates range from
0.5 to 0.9 Ma.
Phase E. The north-western dacite volcanoes
were formed and are dated at 0.6 ± 0.2 Ma in this
study.
Phases F and G. These phases were characterised
by the eruption of the central andesite volcanoes
and the E–W fissure dacites. Some explosive
pyroclastic eruptions preceded major andesite and
dacite eruptions. Available radiometric ages from
phase G cluster between 0.29 and 0.34 Ma.
Phase H. Eruption of the Kammeni Hora flows,
probably within the last 0.2 Ma, with the most
recent eruption in historic times.
2.1 Geomorphology
Methana peninsula is characterized by rough
topography, generated by the complex regional
tectonic regime in combination with the volcanic
activity. The mountainous relief of the peninsula, 740
masl at its highest point, falls to the sea with no
lowland plain. Abrupt and sudden changes in slope
gradient alternate with flat basinal areas (Fig. 3) filled
by Quaternary sediments, where at the same time
volcanic agglomerates commonly fill depressions
between domes (James et al.,1994). Moreover, the
volcanic landforms are dissected by stream gullies,
reflecting the intense erosion. This rugged terrain,
with the well-developed drainage system and the
steep slopes, is prone to landslides and rockfalls
induced by geomorphologic and geologic controls.
An Interactive Story Map for the Methana Volcanic Peninsula
69
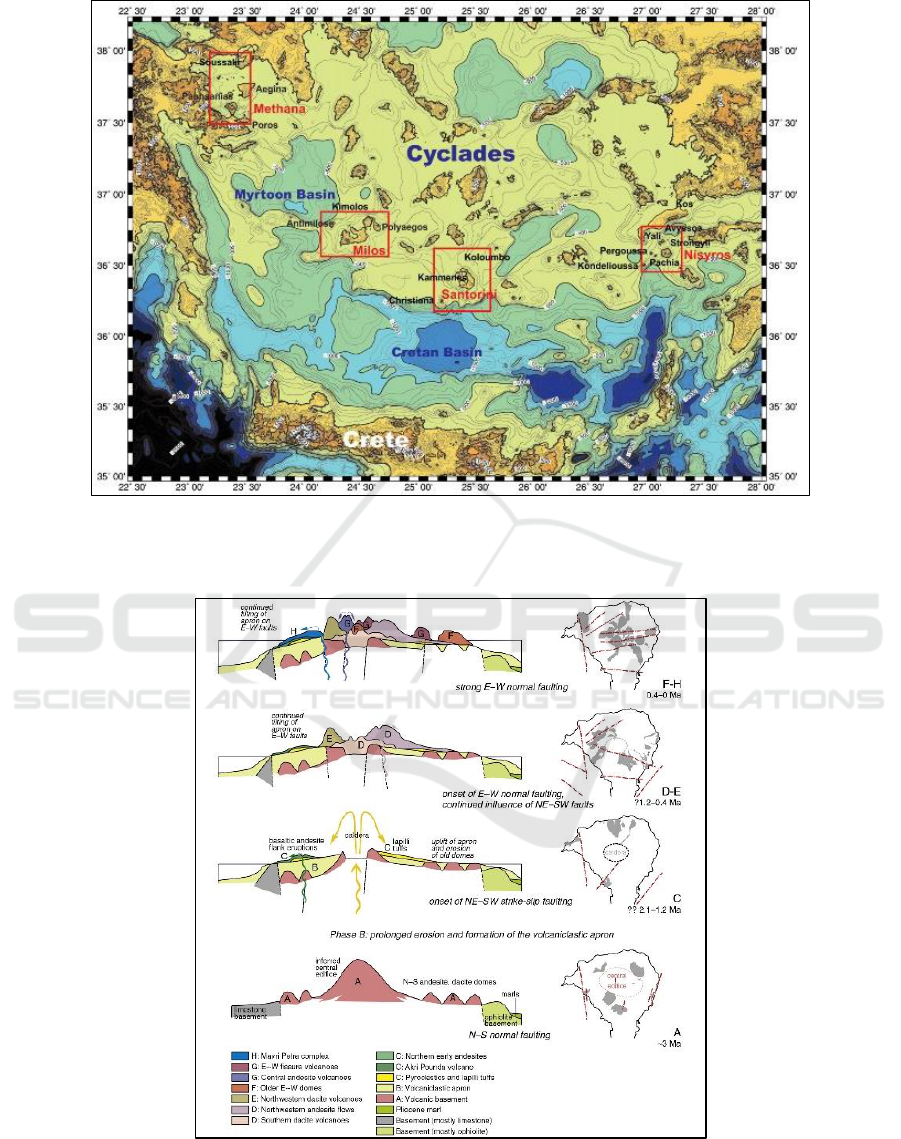
Figure 1: Topographic map of the southern Aegean Sea combining onshore and offshore data. The four modern volcanic
groups are indicated within red boxes together with the names of the main terrestrial and submarine volcanic centers along
the volcanic arc (Nomikou et al., 2013).
Figure 2: Schematic cross-sections (E–W or SE–NW) and maps of Methana, showing inferred relationship of volcanic
stratigraphy to evolution of regional fault patterns. Cross sections illustrate stratigraphy; no representation of the magmatic
plumbing system is attempted (Pe-Piper and Piper, 2013).
GISTAM 2018 - 4th International Conference on Geographical Information Systems Theory, Applications and Management
70
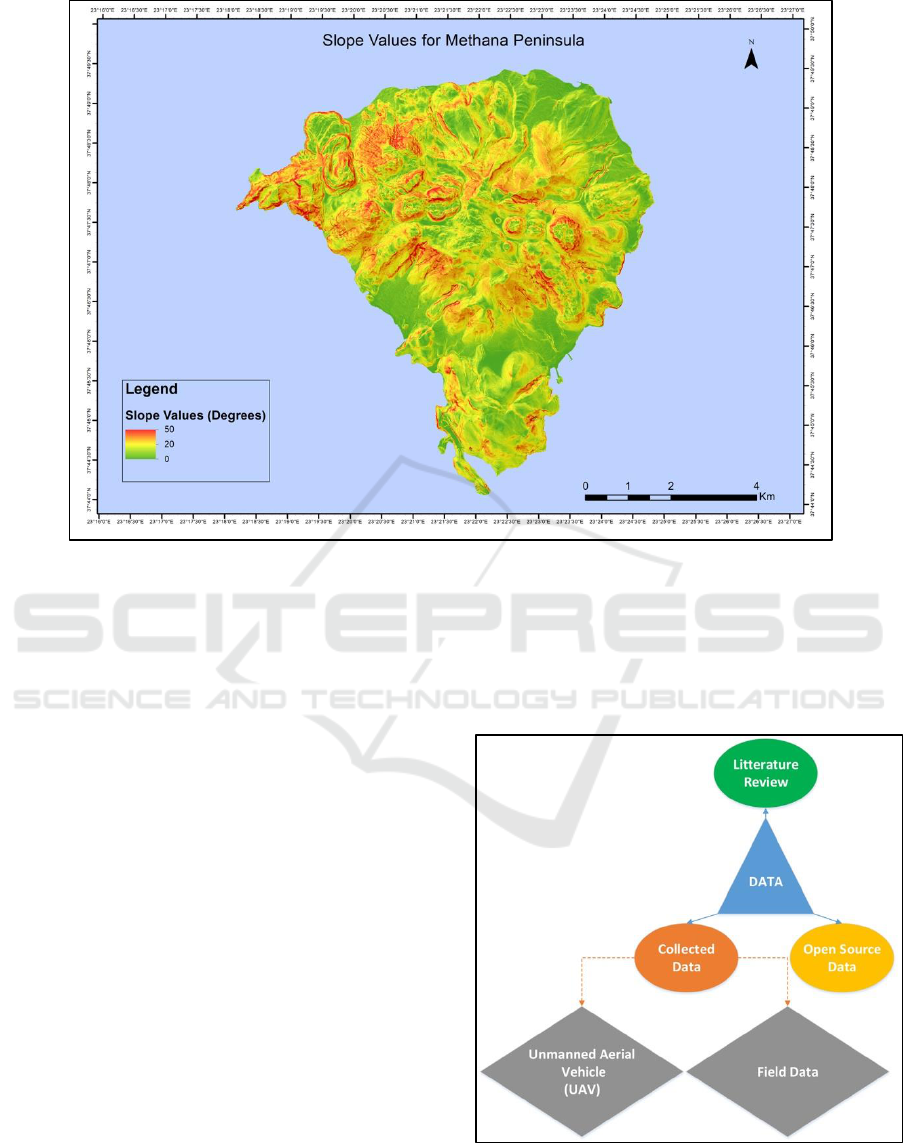
Figure 3: Morphological Map of Methana peninsula.
3 DATA COLLECTION
To tackle the challenge of creating the Story Map of
Methana volcanic peninsula, different types of
datasets have been collected (Fig. 4). All the available
literature regarding the geology, geodiversity,
archaeology and biodiversity has been compiled and
geospatial data have been downloaded from open
source portals. Moreover, two field trips took place in
September in order to acquire field data.
3.1 Field Trips
Two field trips have taken place in order to collect
new photographic material, to trace paths and find
places of special interest, attaching representative
photographs or videos, etc. In order to collect all these
new data, up – to – date technology has been used
which is the Collector for ArcGIS software and GPS.
Furthermore, an aerial campaign with an unmanned
aerial vehicle (UAV) was conducted. A commercial,
off-the-shelf quadrocopter (DJI Phantom 4 Pro Plus)
was used with a 21 MP digital RGB camera from
University of Portsmouth and up2metric Company.
Flights were performed at different areas of interest,
over the City of Methana, the Kammeni Chora village
and the volcanic formations at the western part of
Methana. There, video sequences and images at
constant time intervals were captured, to guarantee a
higher than 80% image overlap (Fig. 5).
Figure 4: Chart showing the different types of datasets used
in this study.
An Interactive Story Map for the Methana Volcanic Peninsula
71
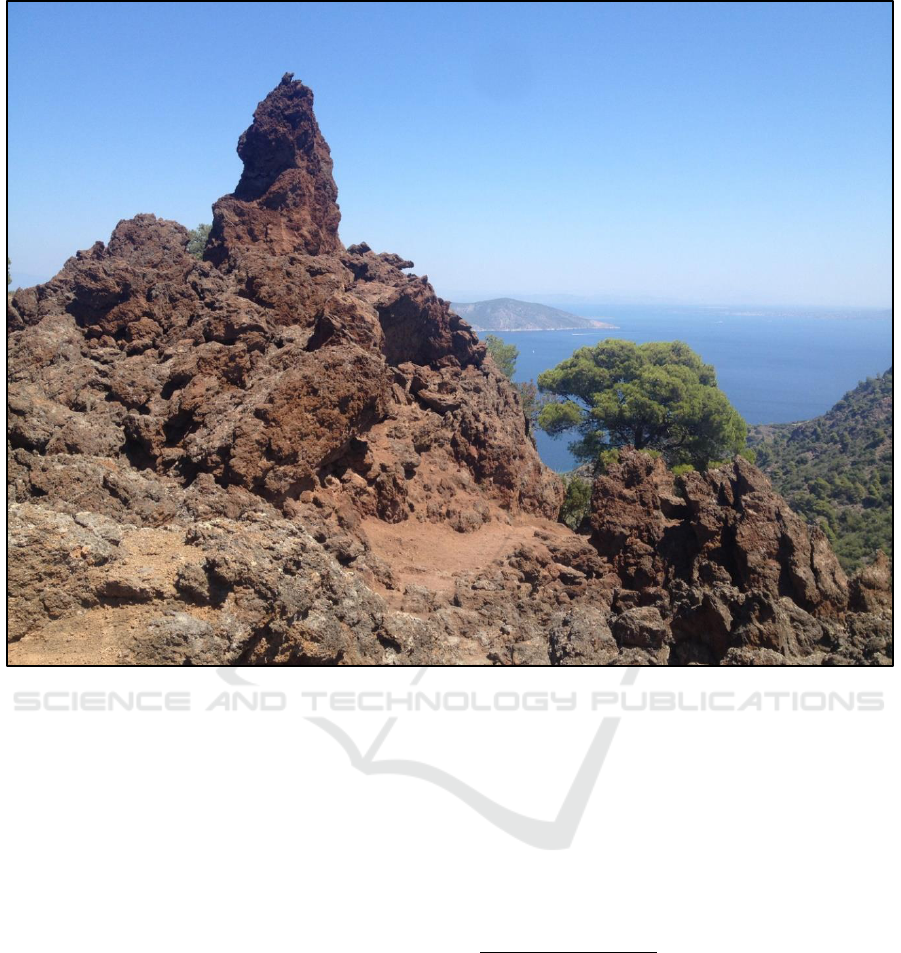
Figure 5: Photo taken during the fieldtrips capturing Methana Volcano.
4 METHODOLOGY
4.1 References
For the present research, a geo-database was created,
which is the systematic collection of the existing
information for the study area into a user – friendly
and functional system in order to support effective
ways for data visualisation. Specifically, our database
was divided into two subsets of data. The first subset
consists of the available data files for the area
(bibliography, topographic map, geological – tectonic
structure etc.). Those that were in analogue form were
converted into digital form, in order to make further
use of them. This subset also includes the vector data
files that have been designed for the data collection in
the field work. The second subset consists of the data
files that resulted from the processing of the
aforementioned, or their modification with new field
data, and these are the files that thematic maps were
based on. These files were gradually transformed into
a format suitable for online use (feature or image
services) and easily applied to the Story Map.
4.2 Field Data Collection
A Geographical Information System, ArcGIS
platform from ESRI Company, with both desktop and
online applications, was used to accomplish this study
(https://www.esri.com/). The creation of information
layers, including existing and new data, has been
performed through ArcMap v.10.5.1 software
(“ArcGIS for Desktop – ArcMap,” n.d.). In addition,
ArcGIS Online (“ArcGIS Online - ArcGIS Online
Help,” n.d.) has been used in order to construct the
online map (webmap) on which collected data would
be presented. Finally, Collector for ArcGIS,
(“ArcGIS Collector,” n.d.), both compatible for
Android and iOS software, has been used for the data
collection. This application supports functionality, to
collect and update spatial and descriptive data
through mobile devices (tablets or smartphones).
More specifically, these advantages are:
GISTAM 2018 - 4th International Conference on Geographical Information Systems Theory, Applications and Management
72

Convenient collection of points, lines and
elements that cover a large area.
Data collection and update using the map or the
GPS signal.
Photos and videos attachments confirming the
collected descriptive data.
Capability to download maps in a mobile device
and use of them even with no internet access.
Capability of monitoring specific areas and report
composition about them.
In more detail, the methodology unfolds as
follows (Fig. 6):
Firstly, collection and organization of existing
vector and grid data was carried out as well as their
spatial and descriptive analysis, if necessary. For this
purpose, a geodatabase has been created via ArcMap
v.10.5.1 software, in which all information layers that
would also appear on the online map have been
added, including the editable ones.
Each of the information layers hosts apart from
the type of the spatial information all the necessary
fields for the descriptive information. This
information would be either the already existing one
or the one that would be collected during field work.
The pre-existing information layers include
coastline, settlements, geological formations (Fig. 7)
and tectonic structures of the island. Two editable
information layers have been created, for the field
data collection (Fig. 8). One point and one polyline
vector file, which apart from spatial information they
will also include descriptive information and photos
or video for each collected feature.
In the second part of this study, information layers
were uploaded in the online platform of ArcGIS and
have been converted to feature services, a file type
that can show information online
(https://goo.gl/mBTiKF).
In the next step, a webmap and the individual
parameters for each of the information layers, e.g. its
symbol and the appearance or not of tags and pop-up
menus etc., have been created (DiBiase et al., 1992;
Newman et al., 2010). Moreover, a refresh interval
for the information layer regarding data collection has
been defined. Specific symbols for each user group
have been created, so that each group can directly be
identified. Imagery, which is available from ArcGIS
platform, was assigned to be the background of the
above information layers.
In this research, GIS technology was used only to
collect, analyse and visualize data, using desktop and
online interactive techniques, because its main aim
was to disseminate this way of data presentation to
the public, combining scientific information about the
volcanic peninsula with archaeology and history.
4.3 UAV Survey
The acquired video samples were used to create small
demonstration videos and panoramic photos. Still
images, captured at constant time intervals to
guarantee a higher than 80% overlap, were also used
to generate photogrammetric 3D textured models. For
the latter, the drone camera was calibrated and all
images were oriented with a standard Structure-
From-Motion (SFM) approach. This procedure
includes the establishment of sparse multi-image
point correspondences. This is achieved by 2D
feature extraction and matching among images,
employing feature descriptors at multiple image
scales. The point correspondences were filtered
through standard RANSAC outlier detection and all
mismatched points were identified and eliminated.
Image orientations were initialized through closed
form algorithms and finally optimal estimations of
exterior and interior orientation parameters were
computed through a standard self-calibrating bundle
adjustment solution.
After image orientation, dense point clouds were
generated by means of dense stereo and multi-image
matching algorithms. Through 3D triangulation, the
3D point clouds were converted to 3D mesh models.
Photorealism was finally achieved by computing
texture for each 3D triangle via a multi-view
algorithm, using a weighted blending scheme.
Photorealistic texture was estimated by means of
interpolation, using all images which view each
particular surface triangle (Fig. 9). The
photogrammetric processing was performed using the
Pix4DMapper commercial software, assisted by own
developed algorithms for dense stereo matching
(Stentoumis et al., 2014) and the refinement of the 3D
model’s texture (Karras et al., 2007).
5 STORY MAP
In order to compose this Story Map, all the available
information was uploaded to the online platform.
Users have the possibility to either using a private
server or uploading information directly to ArcGIS
Online. The latter approach was followed during the
deployment of this Story Map (Fig. 10).
An Interactive Story Map for the Methana Volcanic Peninsula
73
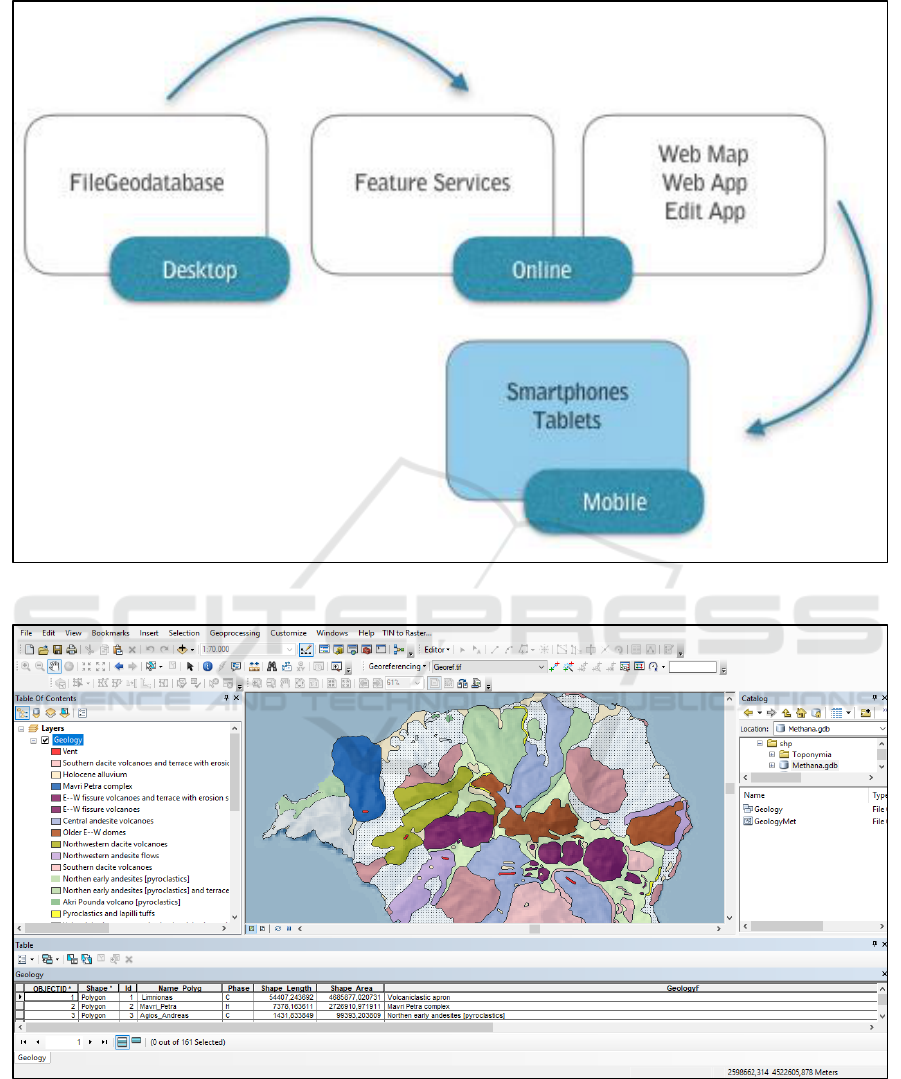
Figure 6: Workflow to be followed in order to use mobile devices for collecting data via Collector for ArcGIS application.
Figure 7: Screenshot of ArcGIS Desktop 10.5.1, which shows the geological information (spatial and descriptive) for the area.
GISTAM 2018 - 4th International Conference on Geographical Information Systems Theory, Applications and Management
74
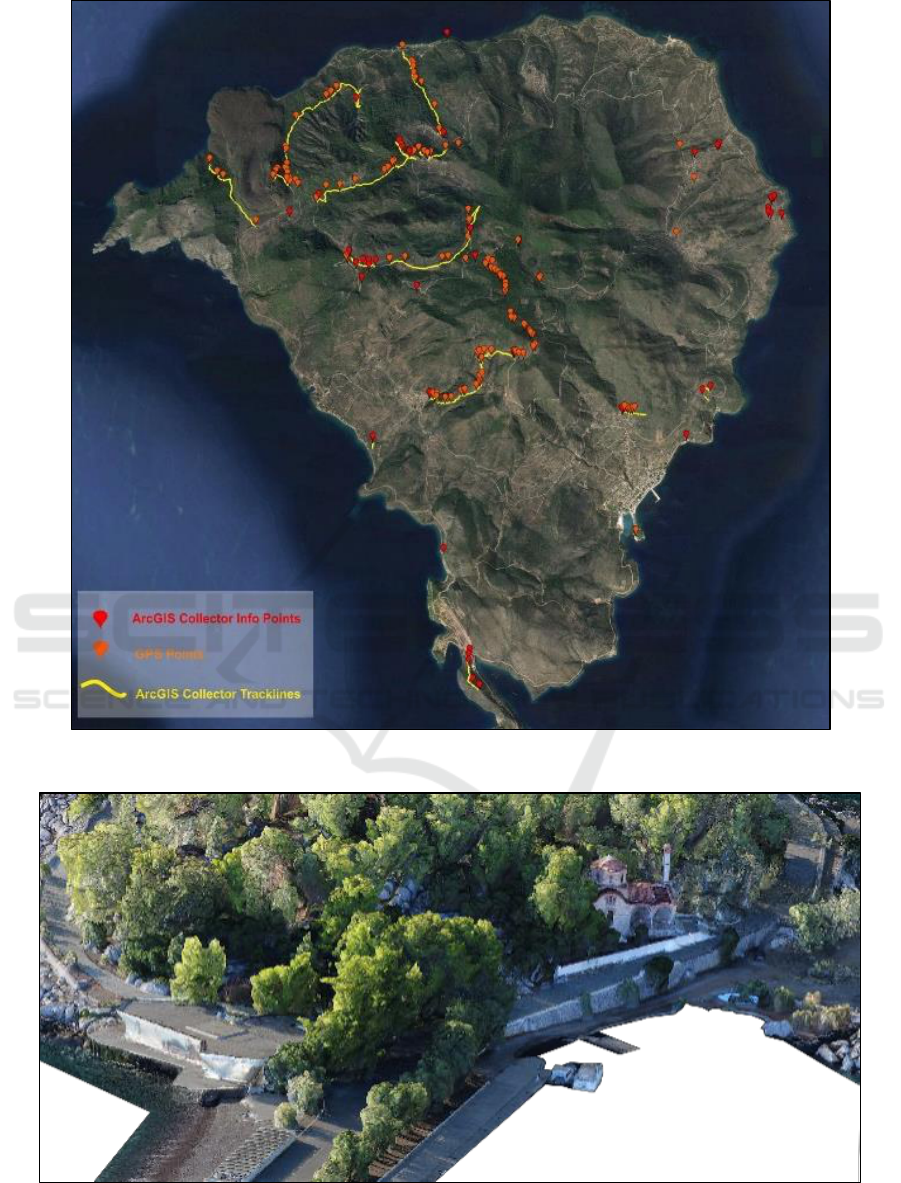
Figure 8: Screenshot which shows data that have been collected during field trips.
Figure 9: Photogrammetric 3D image of Nisaki (Methana peninsula).
An Interactive Story Map for the Methana Volcanic Peninsula
75
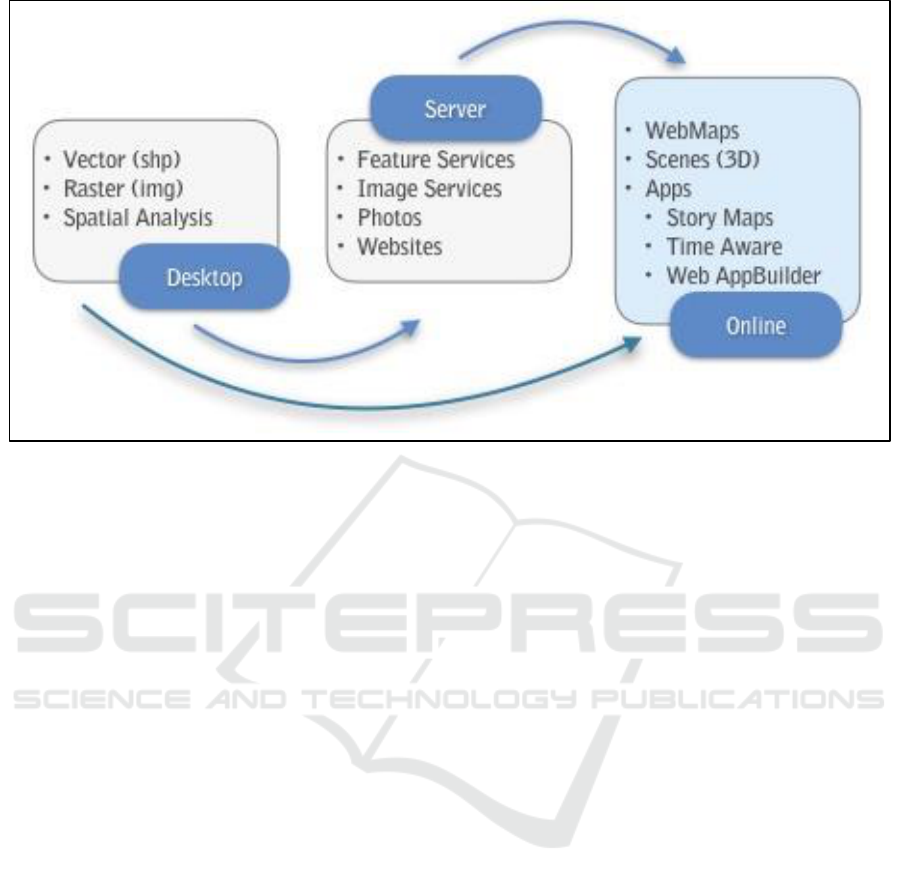
Figure 10: Workflow highlighting the procedure followed to produce a Story Map (Antoniou, 2015).
A certain template, called Story Map Series was
implemented, to present the available information.
Story Map Series comes with three layout options:
tabbed, side accordion and bulleted. The first one was
selected for the main Story. Web maps, narrative text,
images, tables, video, external websites, scenes which
correspond to 3D presentation of data were used.
Also, other Story maps and apps were embedded,
such as Story Map Shortlist, Story Map Series-Side
Accordion and Time Aware. Finally, Story Map
Cascade was used as a home page (Fig. 11).
Thematic maps were created in ArcGIS online
and were based on the collected data, the fieldwork
and literature review, depicting the most important
and unique points. More specifically:
First tab using Story Map Series-Side Accordion,
gives general information about Methana peninsula,
containing the geographical position and
geomorphology and a brief description of the area’s
points of interest. Text is accompanied by webmaps
showing the spatial distribution of these having as
basemap, imagery from ESRI’s basic gallery maps
(Fig. 12).
Second tab presents the geological setting of the
peninsula. Text explains the volcanic activity of the
area and in addition an embedded Time Aware
application presents the geological-volcanic
evolution of the island. As basemap, a 5m-hillshade
of the area was used and a Scene (3D presentation)
was created.
Next three tabs present the main hiking trails in
the area. Story Map Tour application was embedded
in each one of them. Text describes the morphology
of the path and gives detail information for every
point of interest and a webmap gives the spatial
distribution of them. Users are able to select either a
point in the map or a photo - video from the carousel
and gather further information.
Last tab, indicates the Research Team responsible
for the creation of this Story Map.
Finally, in order to give users, the ability to choose
the language they prefer, a Story Map Cascade was
used to be Story Map’s home page.
6 CONCLUSIONS
The use of Story Map has plenty of advantages since
it presents useful and attractive information about the
study area. The use of explanatory text and the
incorporation of multi-media helps the end user to
engage in scientific knowledge transfer and provides
a better understanding of Methana’s volcanic
geodiversity.
The user of the Story Map can navigate easily
through the content, by pop - ups, swipe up and down
and through slides. As it is user - friendly, the
interface can be customized according to the user’s
display screen (mobile phones, computers or tablets)
and every single user has the ability to customize the
application to his needs (for example, unveiling
specific volcanic cone).
GISTAM 2018 - 4th International Conference on Geographical Information Systems Theory, Applications and Management
76
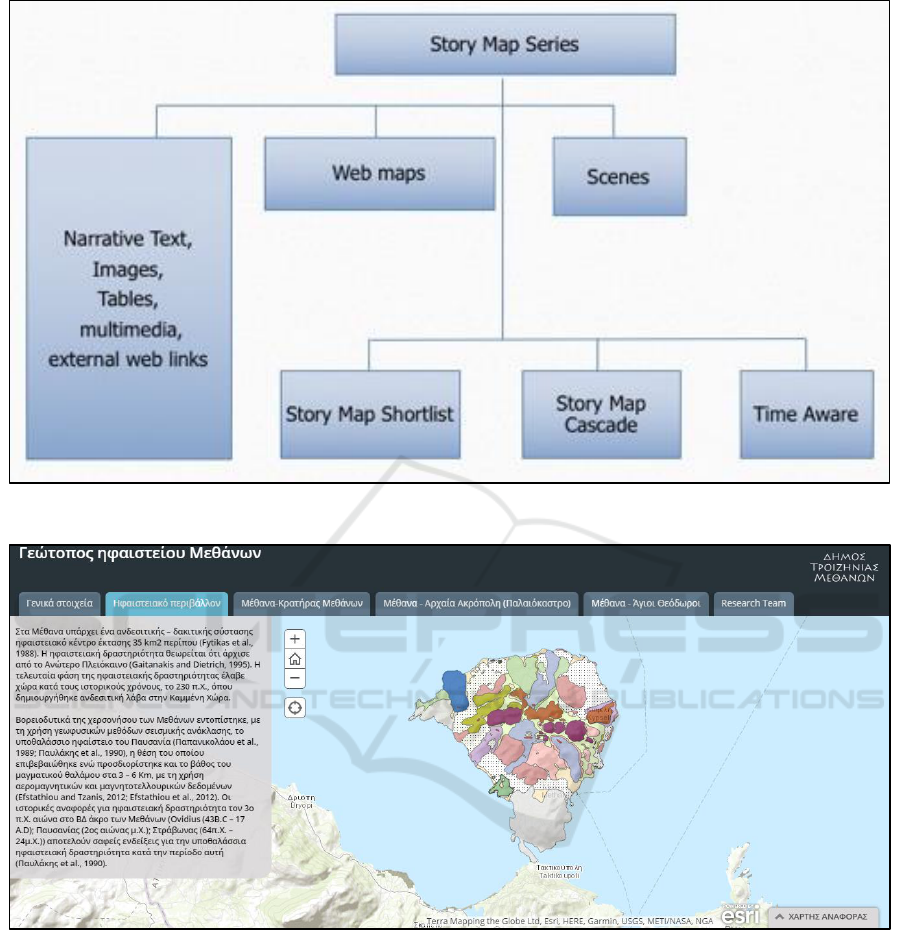
Figure 11: Methana Volcano Story Map structure.
Figure 12: Representative Screenshot of the Story Map.
In conclusion, Methana Volcano Story Map
portrays a good example of a web map, while
providing information to a wide audience, developing
the interest and possibly motivating the public to
learn more (or even to visit) about the display area.
ACKNOWLEDGEMENTS
This work was supported and funded by the
Municipality of Troizinia - Methana in the framework
of the Applied Research Program ‘Evaluation and
exploitation of the geotope of the Methana Volcano”
of National and Kapodistrian University of Athens.
An Interactive Story Map for the Methana Volcanic Peninsula
77

REFERENCES
Antoniou, V., 2016. Development of modern, online-
interactive applications using WebGIS for processing
and mapping geoenvironmental information and real
time field data, to prevent and manage natural
disasters. Master Thesis, National and Kapodistrian
University of Athens, 138p.
“ArcGIS Collector.” n.d. https://goo.gl/KoBxzn (accessed
3/1/2018).
“ArcGIS for Desktop – ArcMap.” n.d.
https://goo.gl/OPVwsG (accessed 3/1/2018).
“ArcGIS Online - ArcGIS Online Help.” n.d.
https://goo.gl/rJUyYn (accessed 3/1/2018).
DiBiase, D., MacEachren, A.M., Krygier, J.B. and Reeves,
C., 1992. “Animation and the Role of Map Design in
Scientific Visualization.” Cartography and
Geographic Information Systems, 19 (4): 201–2014.
Gaitanakis, P. and Dietrich, A.D., 1995. Geological map of
Methana peninsula, 1:25 000, Swiss Federal Institute of
Technology, Zurich.
Georgalas, G., 1962. Catalogue of the Active Volcanoes of
the World, Including Solfatara Fields. Part 12: Greece.
International Association of Volcanology, Rome,40pp.
James, P. A., Mee, C. B. and Taylor, G. J., 1994. Soil
Erosion and the Archaeological Landscape of Methana,
Greece. Journal of Field Archaeology, 21(4), p.395.
Janicki, J., Narula, N., Ziegler, M., Guénard, B., and
Economo, E. P., 2016. Visualizing and interacting with
large-volume biodiversity data using client–server web-
mapping applications: The design and implementation
of antmaps.org. Ecological Informatics, 32, 185–193.
Karras, G., Grammatikopoulos, L., Kalisperakis, I. and
Petsa, E., 2007. Generation of orthoimages and
perspective views with automatic visibility checking
and texture blending. Photogrammetric Engineering
and Remote Sensing, 73(4), 403-411.
Newman G., Zimmerman D., Crall A. Laituri M., Graham
J. and Stapel L., 2010. User-friendly web mapping:
lessons from a citizen science website, International
Journal of Geographical Information Science, 24, 12,
1851- 1869.
Nomikou, P., Papanikolaou, D., Alexandri, M., Sakellariou,
D. and Rousakis, G., 2013. Submarine volcanoes along
the Aegean Volcanic Arc. Tectonophysics, 507-508,
123-146.
Pe – Piper, G. and Piper, D., 2013. The effect of changing
regional tectonics on an arc volcano: Methana, Greece,
Journal of Volcanology and Geothermal Research,
260, 146 – 163.
Pavlakis, P., Lykousis, V., Papanikolaou, D. and Chronis,
G. 1990. Discovery of a new submarine volcano in the
western Saronic Gulf: the Paphsanias Volcano. Bulletin
of the Geological Society of Greece, 24, 59-70.
“Pix4DMapper” n.d. https://pix4d.com/ (accessed
3/1/2018).
Stentoumis, C., Grammatikopoulos, L., Kalisperakis, I. and
Karras, G., 2014. On accurate dense stereo-matching
using a local adaptive multi-cost approach. ISPRS
Journal of Photogrammetry and Remote Sensing, 91,
29-49.
Wright, D.J., Verrill, A., Artz, M. and Deming, R, 2014.
Story maps as an effective social medium for data
synthesis, communication, and dissemination, Eos,
Trans. AGU, 95, Fall Meet. Suppl., Abstract IN33B-
3773.
GISTAM 2018 - 4th International Conference on Geographical Information Systems Theory, Applications and Management
78
