
Survey of Public Transport Routes using Wi-Fi
Jo
˜
ao Ribeiro
1,3
, Andr
´
e Z
´
uquete
2,3,4
and Susana Sargento
2,3
1
University of Aveiro, Portugal
2
DETI / University of Aveiro, Portugal
3
Institute of Telecommunications - Aveiro, Portugal
4
Institute of Electronics and Informatics Engineering of Aveiro, Portugal
Keywords:
Origin-destination Matrix, 802.11, Wi-Fi, Public Transportation.
Abstract:
An important aspect in improving public transport efficiency is collecting information regarding travelers’
routes, usually represented as an Origin Destination (OD) matrix. Most public transportation systems im-
plement fare collection systems that can provide the accurate origins of travelers’ routes but not accurate
destinations. In this paper we look at Wi-Fi, more specifically 802.11 data-link layer, as a candidate to provide
OD matrix estimations. We present a system and an algorithm capable of collecting information, comple-
mented with positioning and time, regarding Wi-Fi capable devices inside a bus. A system is also presented
to implement this concept using minimal requirements. An implementation of this system was deployed in
a public bus to collect data for several months. This resulted on over 71929 traveler routes collected in 127
different days. This data was contextualized and mapped to an OD system in order to demonstrate how it can
be used to generate OD matrix estimations.
1 INTRODUCTION
To better understand the necessities of the end-user
it is crucial for the providers of transportation ser-
vices to have access to data regarding the use of
their services, typically represented as Origin Desti-
nation (OD) matrices (Ashok and Ben-Akiva, 1993).
In some systems part of this data can be easily ac-
quired (by the purchase of tickets for example), how-
ever in most cases, particularly in transports that do
not control when users leave them, it is difficult to
accurately know how end users actually exploit the
services.
Transportation systems tend nowadays to use to-
kens that can be used to purchase several services.
For example, Radio-Frequency Identification (RFID)
cards can be used to purchase several trips to different
locations. The wide variety of possible destinations
requires the system to generalize the services, such as
grouping possible origin and destinations by area.
This poses a problem, since users will always use
their card on entering a transportation vehicle, in or-
der to pay for the trip, but they usually do not need
to use it on exit (except in some rare cases), making
therefore difficult to accurately know where they left
the vehicle. This is particularly relevant on public bus
transportation systems, which are required to provide
a wide variety of possible origins and destinations.
This work attempts to solve this issue by propos-
ing a system that is able to provide accurate OD ma-
trices by indirectly gathering the routes used by bus
travelers using a nowadays popular communication
technology, Wi-Fi.
The system that we developed collects all kinds
of Wi-Fi communications, in all channels, that occur
in the vicinity of a bus. It uses the MAC (Medium
Access Control) addresses of Wi-FI communications
to identify potential travelers. Each collected com-
munication is first analyzed, in order to evaluate its
suitability, and suitable samples are recorded together
with the time and location of their collection. Trav-
eling paths are formed by two collected samples, one
where the device first appeared, the other where the
device was listen for the last time. The collected
paths are then uploaded to a central repository, upon a
proper anonymization. Therefore, no tracing of peo-
ple is possible using the data stored in the central
repository.
Since the system is prone to several types of false
positives (i.e., to include people standing outside the
bus), we developed many strategies for filtering them
out. One of them was to stop the collection process
168
Ribeiro, J., Zúquete, A. and Sargento, S.
Survey of Public Transport Routes using Wi-Fi.
DOI: 10.5220/0006708001680177
In Proceedings of the 4th International Conference on Vehicle Technology and Intelligent Transport Systems (VEHITS 2018), pages 168-177
ISBN: 978-989-758-293-6
Copyright
c
2019 by SCITEPRESS – Science and Technology Publications, Lda. All rights reserved

whenever the bus speed is below a given threshold
(because otherwise it would enable people outside the
bus to be listen for a long time). The other strat-
egy consisted in filtering the collected paths in order
to discard paths too short in time or distance (which
could yield sporadic proximities of cars and buses).
Still, we have no means to prevent a person with more
than one Wi-Fi enabled device to be counted as more
than one, nor can we count people not carrying a Wi-
Fi enabled device.
The system also included a strategy, Fake Network
Advertisement (FNA), which was meant to force the
discovery of otherwise undetectable devices (i.e., de-
vices with an enabled Wi-Fi interface but not sending
any frames). In the real deployment scenario it proved
to work, but its benefits are small (about 2% more de-
vices were discovered because of FNA).
A prototype of the collecting system was devel-
oped, using a RaspberryPi and an external GPS sen-
sor. The collector was deployed on a Porto city bus
for some months. From the collected data, and upon
their filtering, we could find some similar occupancy
levels on some week days, which enables us to con-
clude that the results obtained are probably legitimate,
i.e. in average they yield a percentage of the exact
population traveling in the bus. We tried to get the
ticket validation data for further asserting the quality
of our observations, but it was not possible.
2 RELATED WORK
Abedi et al. (Abedi et al., 2013) performed a study to
evaluate Wireless Local Area Network (WLAN) tech-
nologies, Wi-Fi and Bluetooth, as a way of detecting
devices used by people. The authors performed stud-
ies regarding discovery time and popularity of use.
Wi-Fi surpassed Bluetooth on both metrics, register-
ing an average discovery time of 1.4 seconds, while
Bluetooth registered 10.6 seconds. On the popular-
ity test, Wi-Fi was responsible for 92% of the total
amount of devices detected by both WLAN technolo-
gies.
Musa et al. (Musa and Eriksson, 2012) used sim-
ilar concepts to track devices inside moving vehicles.
Their approach included interesting techniques to in-
crease the amount of data received. These techniques
are mostly aimed at increasing the rate of frames re-
ceived from devices as opposed to our objective, in-
creasing the amount of devices detected. A variation
of one of those techniques, Popular SSID AP Emu-
lation, is the FNA implemented in our system. While
they implemented their with a fully functional AP, our
system only emitted beacon frames to tease otherwise
silent devices.
Kostakos et al. (Kostakos et al., 2010) proposed a
solution to obtain the Origin Destination (OD) matrix
by using Bluetooth technology. This solution could
accurately determine a user’s origin and destination
on a trip. However, the percentage of detected pas-
sengers was low, approximately 9.7% travelers were
detected. The authors state that the low amount of
travelers detected is due to the fact that a traveler is
required to have a device with Bluetooth active and
set to discoverable mode, which according to (O’Neill
et al., 2006) only 7.5% of individuals do.
Bullock et al. (Bullock et al., 2010) deployed a
tracking system at the new Indianapolis international
Airport to measure passenger transit times between
security checkpoints. This work is also based on
Bluetooth, and it also exhibited a low success rate:
only 5% to 6.8% of individuals were detected.
Abedi et al. (Abedi et al., 2013) discuss some
practical challenges in the collection and monitoring
of crowd data, but they were concerned with people
moving in open areas, and not with people traveling
inside a transportation vehicle.
Shlayan et al. (Shlayan et al., 2016) proposed a
system using Bluetooth and Wi-Fi technology in or-
der to estimate the OD matrix and wait-times. The
authors performed 2 pilot tests of the system in New
York, one at the Atlantic Avenue Subway Station
(aimed at subway systems) and another at the Port
Authority Transit Facility (aimed at pedestrian flows).
The approach chosen by the authors was different
than ours: they relied on positioning Bluetooth and
Wi-Fi sensors in stations, and not in transportation ve-
hicles as in our system. Similarly to (Kostakos et al.,
2010), the results show a small amount of devices de-
tected by Bluetooth: less than 4% of all detected de-
vices in 2 separate tests. Therefore, they concluded
that Wi-Fi is a far more viable alternative.
This particular study only considered network
probing requests in Wi-Fi (which can limit the sample
size of obtained results) and encryption was necessary
to anonymize the records (due to the nature of the im-
plemented system architecture). On the contrary, we
used all kinds of Wi-Fi communications to infer the
presence of a personal device and our records are not
encrypted, since they are fully anonymized once they
leave the collecting device.
3 PROPOSED SOLUTION
The proposed system architecture aims to create a
client-server system in which the client is a collector
module responsible for collecting data regarding trav-
Survey of Public Transport Routes using Wi-Fi
169

data collector
server
AP
traveler devices
Figure 1: System architecture.
eler routes in a public transportation system, along
with the module’s geographic position history to fa-
cilitate data analysis. The collector is also responsible
for relaying this information to a central server. The
server is responsible for processing, storing, export-
ing and presenting such data.
The Data Collector is formed by three major mod-
ules:
Capture Module: it implements the capture process,
being responsible for capturing frames and gener-
ating traveler routes using this information;
Control Module: it is responsible for assessing the
status of the vehicle in which the Data Collector
is deployed, and controlling the execution of the
Capture module.
FNA Module: it is responsible for advertising fake
networks, in order to detect otherwise silent de-
vices.
The server is also formed by two major modules:
Storage Module: it implements the reception of data
gathered by several Data Collectors and its storage
in a persistent repository;
Analysis Module: it implements a data analysis in-
terface, in order to extract relevant information
and conclusions from the collected data.
3.1 Capture Algorithm
The proposed solution is centered on a capture algo-
rithm, implemented by the Capture module, that is
able to detect devices with 802.11 Wi-Fi capabilities
and use that information, along with Global Position-
ing System (GPS) information, to produce travelers’
route records.
The algorithm relies on detecting devices with an
enabled Wi-Fi interface by capturing frames in all of
the available Wi-Fi channels (by sequentially hopping
through them all) and identifying them by MAC ad-
dress (either source or destination addresses). De-
vices’ detection is coupled with a time-stamp which
allows the algorithm to estimate when a device has
entered and left the bus (first and last detections, re-
spectively).
This detection algorithm is complemented by an-
other one, implemented by the Control module, which
is also able to suspend the capture of frames to prevent
the detection of devices outside the bus. The capture
process is suspended during situations in which we is
likely to detect an high amount of devices outside of
the bus (e.g. when the bus speed is below a set thresh-
old). With this strategy we are able to avoid a massive
detection of people around bus stations, or otherwise
close to the bus when it is stopped in a traffic jam,
stopped in a traffic light or when it moves at a speed
close to the one of pedestrians.
When a device is no longer detected for a set
amount of time, if it fulfills a set of requirements (see
Section 3.1.1) then a traveler route record is generated
containing the time and GPS position of first and last
detections. Otherwise, it is discarded.
In order to describe the capture algorithm two con-
cepts must be defined:
Iteration: One iteration of the algorithm represents
the capture and processing of frames in a single
Wi-Fi channel;
Run: One run of the algorithm represents several it-
erations of the algorithm being performed (along
different Wi-Fi channels) followed by a memory
update. A run can be classified as a complete run
or a partial run. A complete run implies that an
iteration was performed for every Wi-Fi channel,
while a partial run implies that one or more iter-
ations were performed (this happens when a stop
order is received). If a stop order is received mid-
way through an iteration, it is completed, but no
further iterations will be performed on the current
run.
The algorithm uses the following set of tables:
Candidates: This table stores records that represent
devices that have not yet been deemed to have left
the bus by the capture algorithm (ongoing routes);
Exclusion: This table stores records that represent
Wireless Local Area Network (WLAN) networks
(and their advertising Access Point (AP)) col-
lected in a recent amount of time. The records
contained in this table have a Time To Live (TTL)
constraint, meaning that they are only valid for a
period of time.
The capture algorithm was designed as a finite state
machine, as represented by Figure 2, with the follow-
ing relevant states:
VEHITS 2018 - 4th International Conference on Vehicle Technology and Intelligent Transport Systems
170
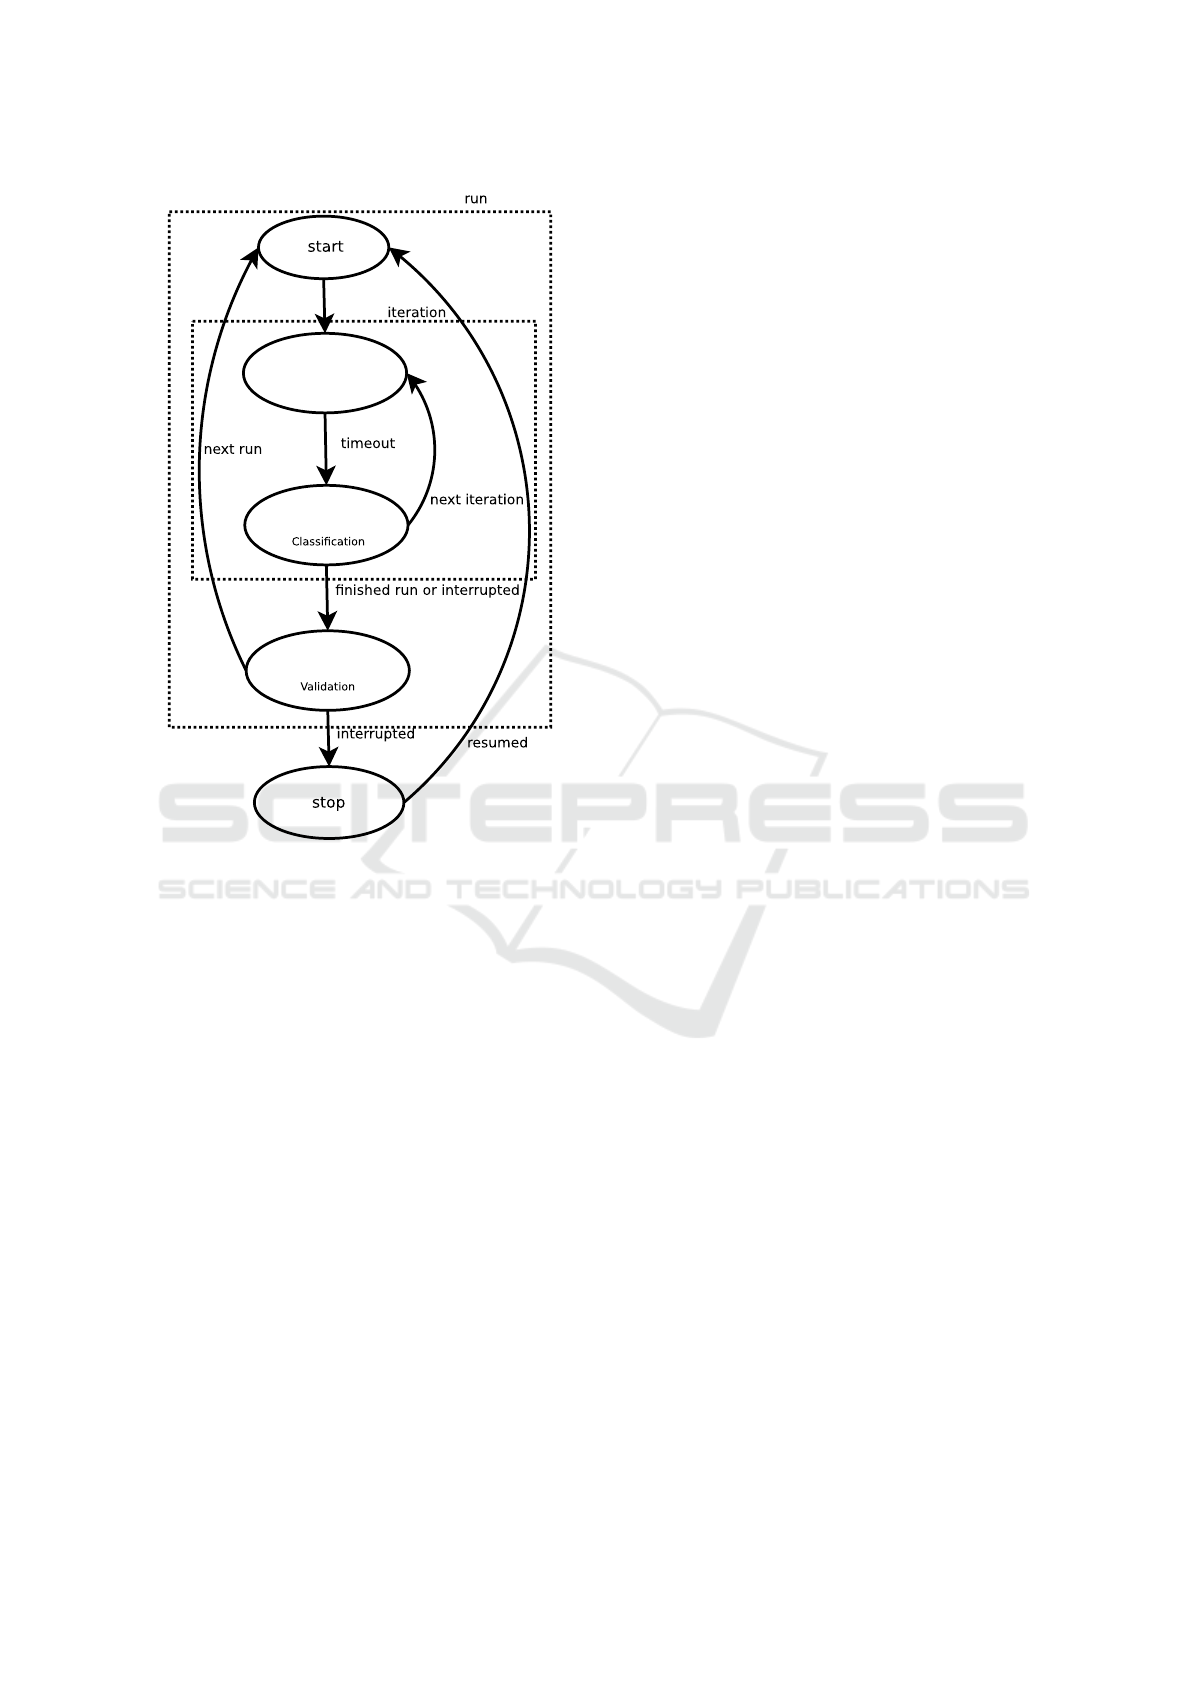
Frame capture
Frame processing
Memory update
Figure 2: Finite state machine of the capture algorithm.
Frame Capture: The Capture module captures
frames in a particular Wi-Fi channel for a given
fixed period (the iteration period);
Frame Processing: The frames collected in the pre-
vious stage are classified as originating from a sta-
tion (personal device) or AP (Access Point). By
default, all frames are assumed to be from sta-
tions, except for frames that are exclusively send
by APs (e.g. beacons, probe responses, etc.). De-
pending on the classification, the MAC address
and other relevant information (time-stamp and
location, for stations) are stored on temporary ta-
bles;
Memory Update: The temporary tables populated
during the previous stage are used to update the
Candidates and Exclusion tables. The Exclusion
table is enriched with the new APs detected, while
the Candidates table is enriched with all new de-
tected devices that are not already referred in the
Exclusion table (thus, they are likely to be sta-
tions). The Candidates table is then used to clas-
sify devices as inside or outside of the bus.
3.1.1 Validation Rule
The validation rule refers to the decision process, dur-
ing the Memory Update stage, used to decide if a de-
vice has left the bus. Upon such decision, the rule
also decides if the device’s record is not a potential
false positive, in which case it should be discarded.
If not, which means it is worth keeping it, its MAC
address is remove for protecting the privacy of the de-
vice’s owner and the record is queued to be uploaded
to the server for being stored.
The validation rule is based on the elapsed time
since the last detection of a device. However, we can-
not use directly the real elapsed time. In fact, if the
detection process is halted for some time due to the
slow traveling speed of the bus (e.g. while in a traffic
jam), a device could wrongly be considered to have
left the bus. In such case, single travelers’ paths could
be decomposed in many, smaller paths (possibly dis-
joint) just because of the interference of the bus speed
on the collection algorithm. To solve this problem, we
use a corrected real time, which is the real time sub-
tracted by an amount equal to the sum of all intervals
during which the Capture module remained stopped.
Or, on another perspective, the corrected real time is
total execution time of the Capture module executed.
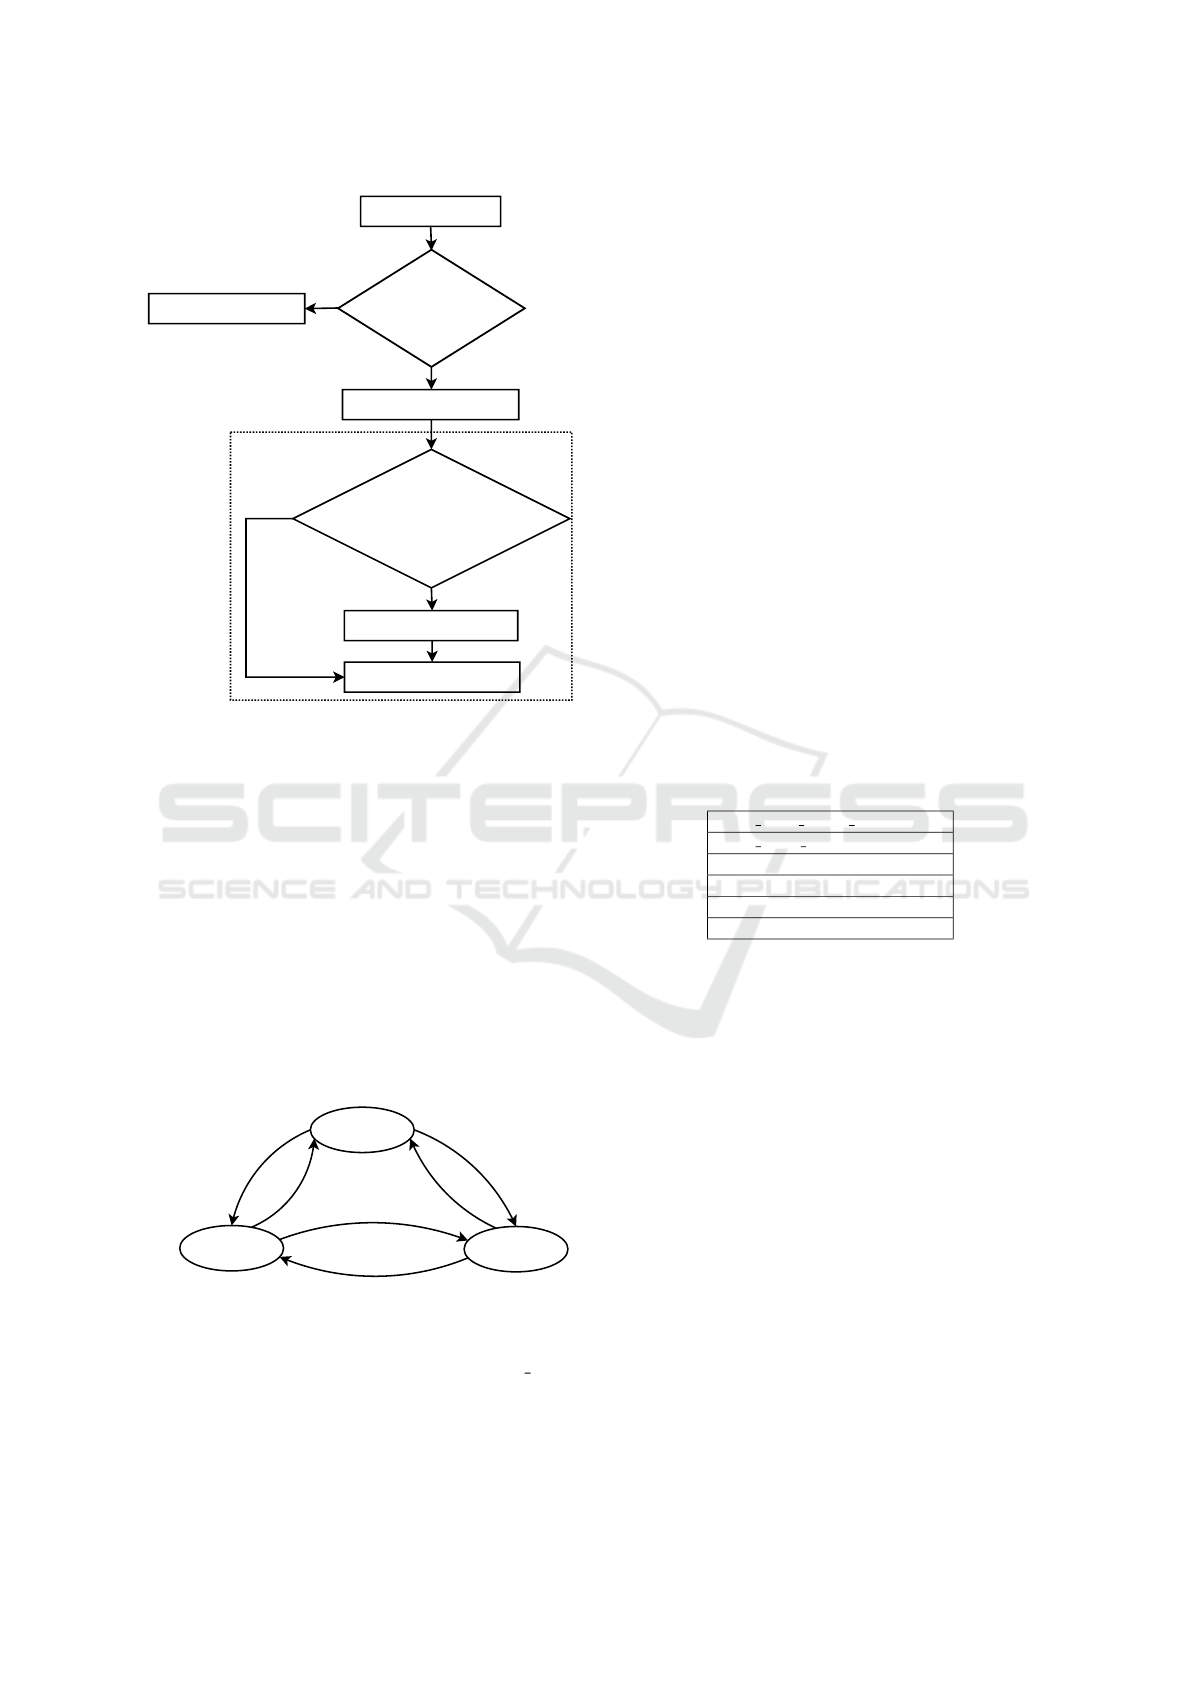
The complete decision process taken by the valida-
tion rule, using this corrected real time, is displayed
in Figure 3.
To rule out false positives, the validation rule is
also based on the likelihood of the record being gen-
uine or relevant for transportation planning. A short
traveling distances for a device is a relevant hint for
considering the device has being a false positive, i.e.
a device that is outside the bus. Furthermore, short
traveling distances are usually not critical for trans-
portation planning, since they represent a use of the
bus that can easily be replaced by a walk (except if
considering disabled or otherwise impaired people).
Therefore, the validation rule measures the linear dis-
tance between the two locations of the record, the one
where it was first created and the one where it was up-
dated for the last time, and deletes it if the distance is
below a given threshold.
Finally, the validation rule discards all records that
contain an amount of detections blow a given thresh-
old. A natural minimum for this threshold is 2, be-
cause we cannot establish a path with a single point.
We could not find any reasonable scenarios for using
thresholds higher than 2.
Survey of Public Transport Routes using Wi-Fi
171
NO
YES
YES
NO
validation
candidate device
time spent
executing since
last detection > T
device still in the bus
device has left the bus
amount of detections > N &
distance(origin,destination)>D
send route to server
delete record
Figure 3: Validation rule decision flowchart, using a thresh-
old T for deciding whether or not a device has left the bus,
the threshold D for the distance between the first and the last
locations and the threshold N for the number of detections
of the device.
3.2 Control Module
The capture algorithm supports suspension in order
to disable the capture of frames in situations in which
a relevant share of the devices detected are outside
of the bus. This happens when the bus is stopped or
traveling at low speeds; therefore, the Control module
controls the execution of the Capture module based on
the bus’ current speed, obtained by GPS, as depicted
in Figure 4
GPS fix
speed>=threshold
GPS fix
speed<threshold
speed>=threshold
speed<threshold
no GPS
signal
no GPS
signal
IN_TRIP
STOPPED
UNK_STATUS
Figure 4: Finite state machine of the Control module, that
controls the execution of the Capture module.
Whenever the Control module enters the IN TRIP
state, the Capture module is signaled to execute.
When the remaining states are entered, that module’s
execution is suspended.
3.3 Fake Network Advertisement (FNA)
Module
Fake Network Advertisement (FNA) defines a strat-
egy developed to capture frames from passive de-
vices. These are devices that do not pro-actively
search for known networks (i.e., for networks preset
in the devices) and that, because of such behavior, are
likely to remain silent until listening for the advertise-
ment of those networks. This strategy consists on ad-
vertising a set of predefined authentication-free Wi-Fi
networks which represent hot-spots that can be found
in many places. Users tend to have these networks’
configurations saved in their devices due to previous
associations on different APs of the same networks
(advertising the same Service Set Identifier (SSID)).
Therefore a passive device which stays silent, but has
previously been associated to those networks, will
tend to send a probe request or authentication request
to those specific SSIDs when they are advertised and
result in being detected by the collector, which oth-
erwise would not happen. Upon the reception of the
probe request or authentication request, the collector
will not respond to the device.
Table 1: Open Wi-Fi networks that can be used for FNA.
FON ZON FREE INTERNET
NOS WIFI FON
MEO-WiFi
MEO-WiFi-Premium
Cabovisao WiFi
Go Wi-Fi Free & Fast
Table 1 displays some of the networks that can be
advertised using FNA, representing popular hot-spots
in Portugal.
This strategy cannot interfere with legitimate APs
advertising hot-spot networks, therefore the advertise-
ment of a network is only performed if there is no
record of an AP advertising the same network in the
Exclusion table.
The FNA module advertises these networks in par-
allel with the execution of the capture algorithm; the
networks are advertised using the same interface used
to capture frames. This increases the chances to de-
tect passive devices, while slightly decreasing the to-
tal time devoted to capturing frames.
This FNA module is also responsible for the main-
tenance of the records in the Exclusion table. This
mainly consists on deleting records that have sur-
passed a given lifetime threshold.
In order to implement the FNA, it is required to
use an 802.11 Wi-Fi adapter that is capable of sending
frames while in monitor mode (the one that needs to
VEHITS 2018 - 4th International Conference on Vehicle Technology and Intelligent Transport Systems
172
be used for capturing all frames transmitted in a single
channel).
4 IMPLEMENTATION
4.1 Data Collector
We developed a prototype Data Collector using a
RaspberryPi Model b+, a GPS receiver, a power con-
verter and a couple of Wi-Fi Universal Serial Bus
(USB) dongles. One of the Wi-Fi interfaces will be
used to capture 802.11 frames and the other will be
used to connect to an AP, responsible for providing
Internet connectivity to travelers, in order to send the
data to the server.
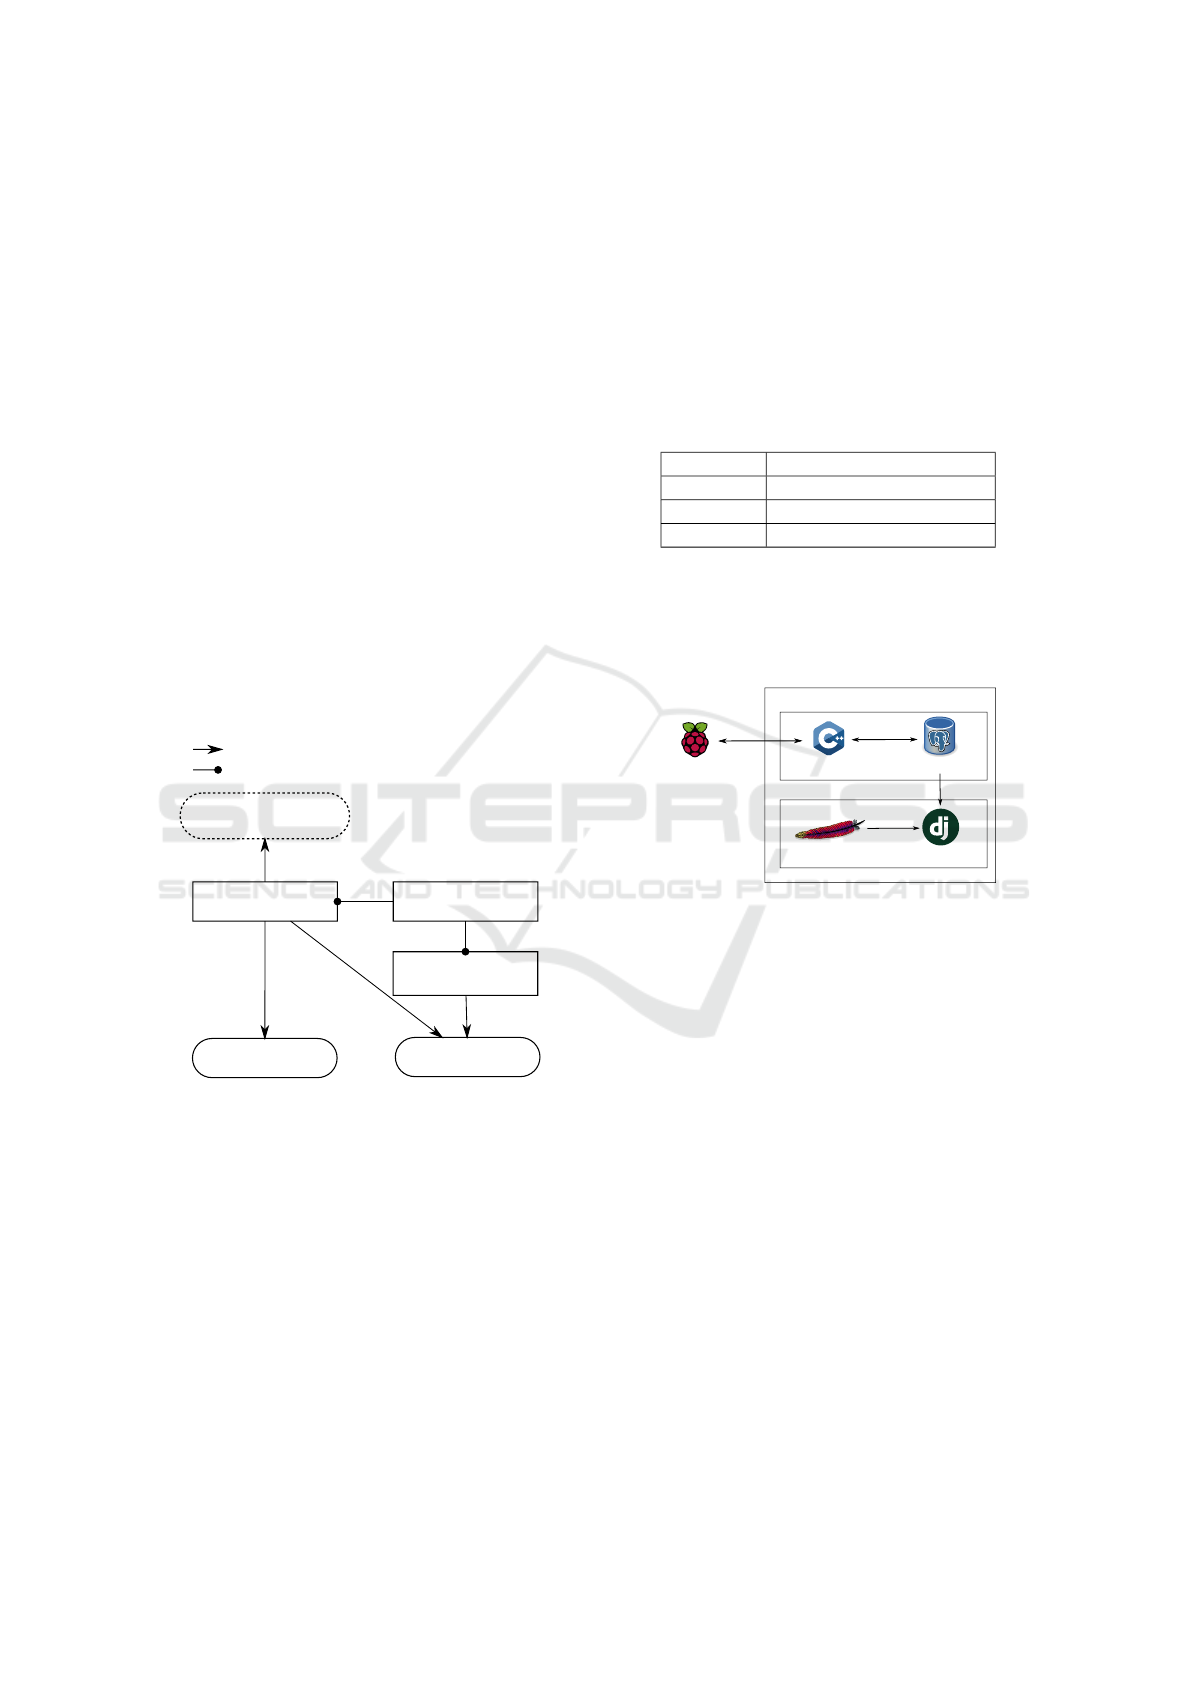
In order to create a Data Collector that encapsu-
lates all of the requirements and modules described,
we developed a concurrent system in which the sev-
eral required activities cooperate. A simplified ver-
sion of the Data Collector’s software architecture is
displayed in Figure 5.
Capture Module
capture algorithm
Exclusion
AP detections
Candidates
incomplete routes
Temporary Tables
Device detections
AP detections
Control Module
execution controller
FNA Module
FNA
Exclusion management
x
y x writes/reads from y
x allows/suspends the execution of y
x
y
Figure 5: Simplified Data Collector software architecture.
Figure 5 represents the software architecture of
the collector module. The rectangles represent mod-
ules that operate concurrently (each with an execution
thread), the solid ovals represent record tables which
are accessed by multiple modules and require multi-
ple exclusive access properties in order to maintain
data consistency. The dashed oval represent tables of
records only accessed by one module, which therefore
do not require synchronized accesses.
Not represented in Figure 5, but still present in the
system, is the availability of the current GPS position
for all of the entities of the system.
In our implementation we also created a separate
module to send the data collected to the central server.
Records ready to be sent are placed into a buffer, and
the buffer is flushed to the server upon a minimum
set of records present on it. In our Data Collector
we defined the time interval for the capture of 802.11
frames as 1 second, which, in most cases, is enough
to capture beacons from nearby APs and traffic from
active station devices.
Our implementation of the validation rule uses the
values displayed in Table 2.
Table 2: Validation input parameters values.
Parameter Value set
T 600 seconds (10 minutes)
N 1 detection
D 100 meters
Our implementation also uses a lifetime of 5 min-
utes for the records in the Exclusion table.
4.2 Server
data collector
server daemon
postgresql database
django Web serverApache2 HTTP server
Server
Storage module
Analysis module
Figure 6: Server implementation overview.
Our system relies on a central server to store the data
collected. The data from a Data Collector is received
by a server daemon and then stored in a postgresql
database, as displayed in Figure 6.
In order to capitalize on the data generated by
Data Collector, a Web interface developed with
Django on top of an Apache HTTP server was also
developed and deployed on the central server.
This interface connects with the database and is
able to use its data to present several views relatively
to the information gathered.
One of the functions of the Web interface is the
ability to represent the course that the bus performed
in a defined period of time, as displayed in Figure 7.
This course is generated by uniting some of the GPS
records obtained from a Data Collector into a line, and
displaying them on a street map.
Another function of the Web interface is presented
in Figure 8. It consists on the graphical representation
of the bus load in a given defined period of time. The
bus load for a time instant is calculated by adding the
amount of routes with an origin time before such in-
stant and a destination time posterior to such instant.
Survey of Public Transport Routes using Wi-Fi
173
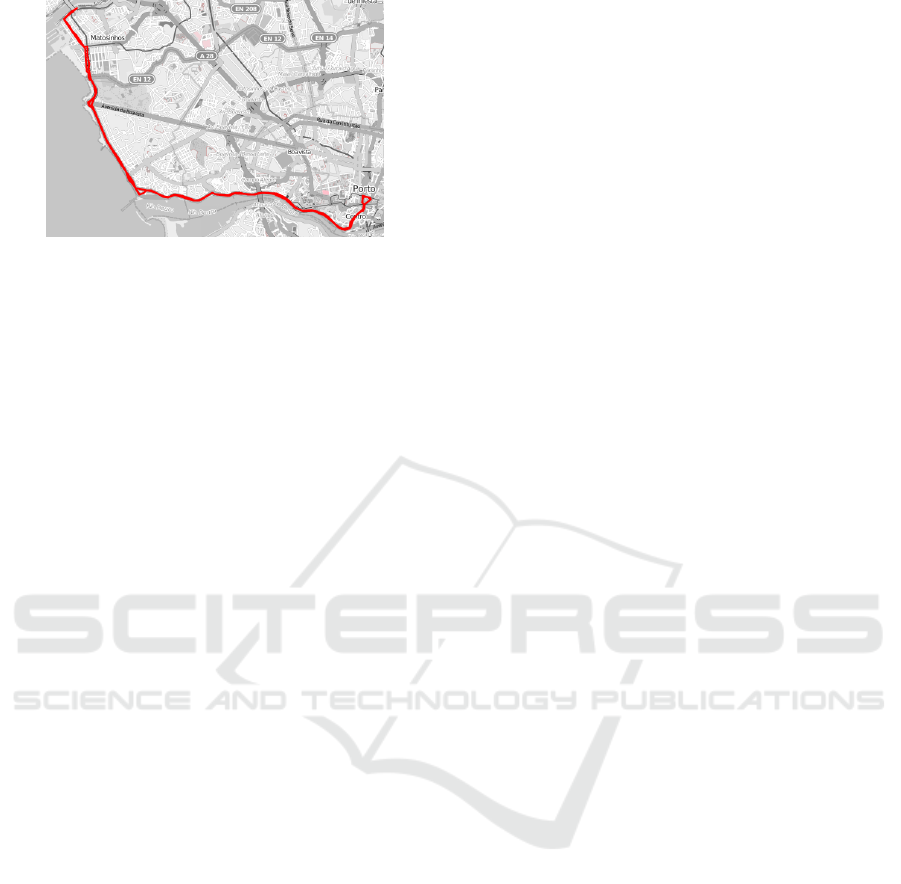
Figure 7: Bus route 500 displayed on the Web interface.
5 CONTEXTUALIZATION OF
COLLECTED DATA
To be able to generate Origin Destination (OD) matri-
ces we must first develop a strategy to contain the geo-
graphical parts of the data collected to a finite coordi-
nate system, the bus networks’ stops. To do this, there
must be established a mapping of which bus lines the
bus has performed during time intervals. This infor-
mation can then be used to generate an OD matrix for
every time the bus has performed the full length of
a bus line. These matrices can then be manipulated
using simple algebra to fit the bus network planners’
requirements.
To generate an OD matrix for a given run, we look
at each traveler route record whose origin and des-
tination times are contained within the time interval
in which the bus has performed a complete line. For
each of these records an estimation of origin station
and destination station is performed, using a strategy
that is graphically presented in Figure 9.
To do this estimation we first have to infer, from
the collected records, the time at which the bus was
at each stop of the bus route during the run. For this
inference we used the GPS positions of all the stops
used in the bus network. Then, from the time of the
first detection we assume that the traveler’s origin is
the stop that was last passed. Similarly, from the time
of the last detection we assume that the traveler’s des-
tination is stop that was passed next.
This allows us to map the origin and destination
of every detected traveler to this specific bus network
stops and ultimately generate a contextualized OD
matrix.
6 RESULTS OBTAINED IN A
REAL DEPLOYMENT
The Data Collector was deployed on a bus
of the Porto Public Transport Society (STCP)
(http://www.stcp.pt/) public bus transportation net-
work. A total of 71356 traveler routes were collected
in the time period between June 22, 2017 and Octo-
ber 28, 2017. From the collected data We verified that
probably not all of its records represented devices in-
side the bus (at times the bus load was much superior
to the bus capacity), so filtering was applied.
6.1 Filter Analysis
After an analysis of the data collected we verified that
in some instants an absurd amount of individuals were
detected in the bus, mostly likely representing devices
outside the bus. This is due to the capture algorithm’s
inability to differentiate devices inside the bus and
outside the bus with complete certainty. The capture
algorithm just assumes that if a device is detected long
enough while some distance has been traveled, then
the device is inside the bus.
Filtering was used as an attempt to discard those
records. In light of this two types of filtering were
used:
Distance Filtering: records with a straight line dis-
tance between origin and destination below D are
not considered;
Time Filtering: records with a time difference be-
tween origin and destination below T are not con-
sidered.
This filtering is similar to the one already performed
by the Data Collectors, but in this case we were able
to experiment with higher thresholds.
Upon this decision, we decided to assess the im-
pact that different values of time and distance filters
would have in the data collected. Table 3 represents
represents the impact that some selected filter values
have on the total amount of traveler routes obtained.
We can see a big decrease in the total amount of
traveler routes detected when a filter of 1000 meters
and 300 seconds is applied. This indicates that there
is a high amount of detected devices that were outside
the bus. These are mostly detected during short peri-
ods of time and have a small distance between origin
and destination points.
The usage of this technique can also result in dis-
carding some devices that were inside the bus, but we
considered that those records do not have much rele-
vance to the information we want to acquire. A trav-
eler that will use a bus to travel less than 1000 meters
VEHITS 2018 - 4th International Conference on Vehicle Technology and Intelligent Transport Systems
174
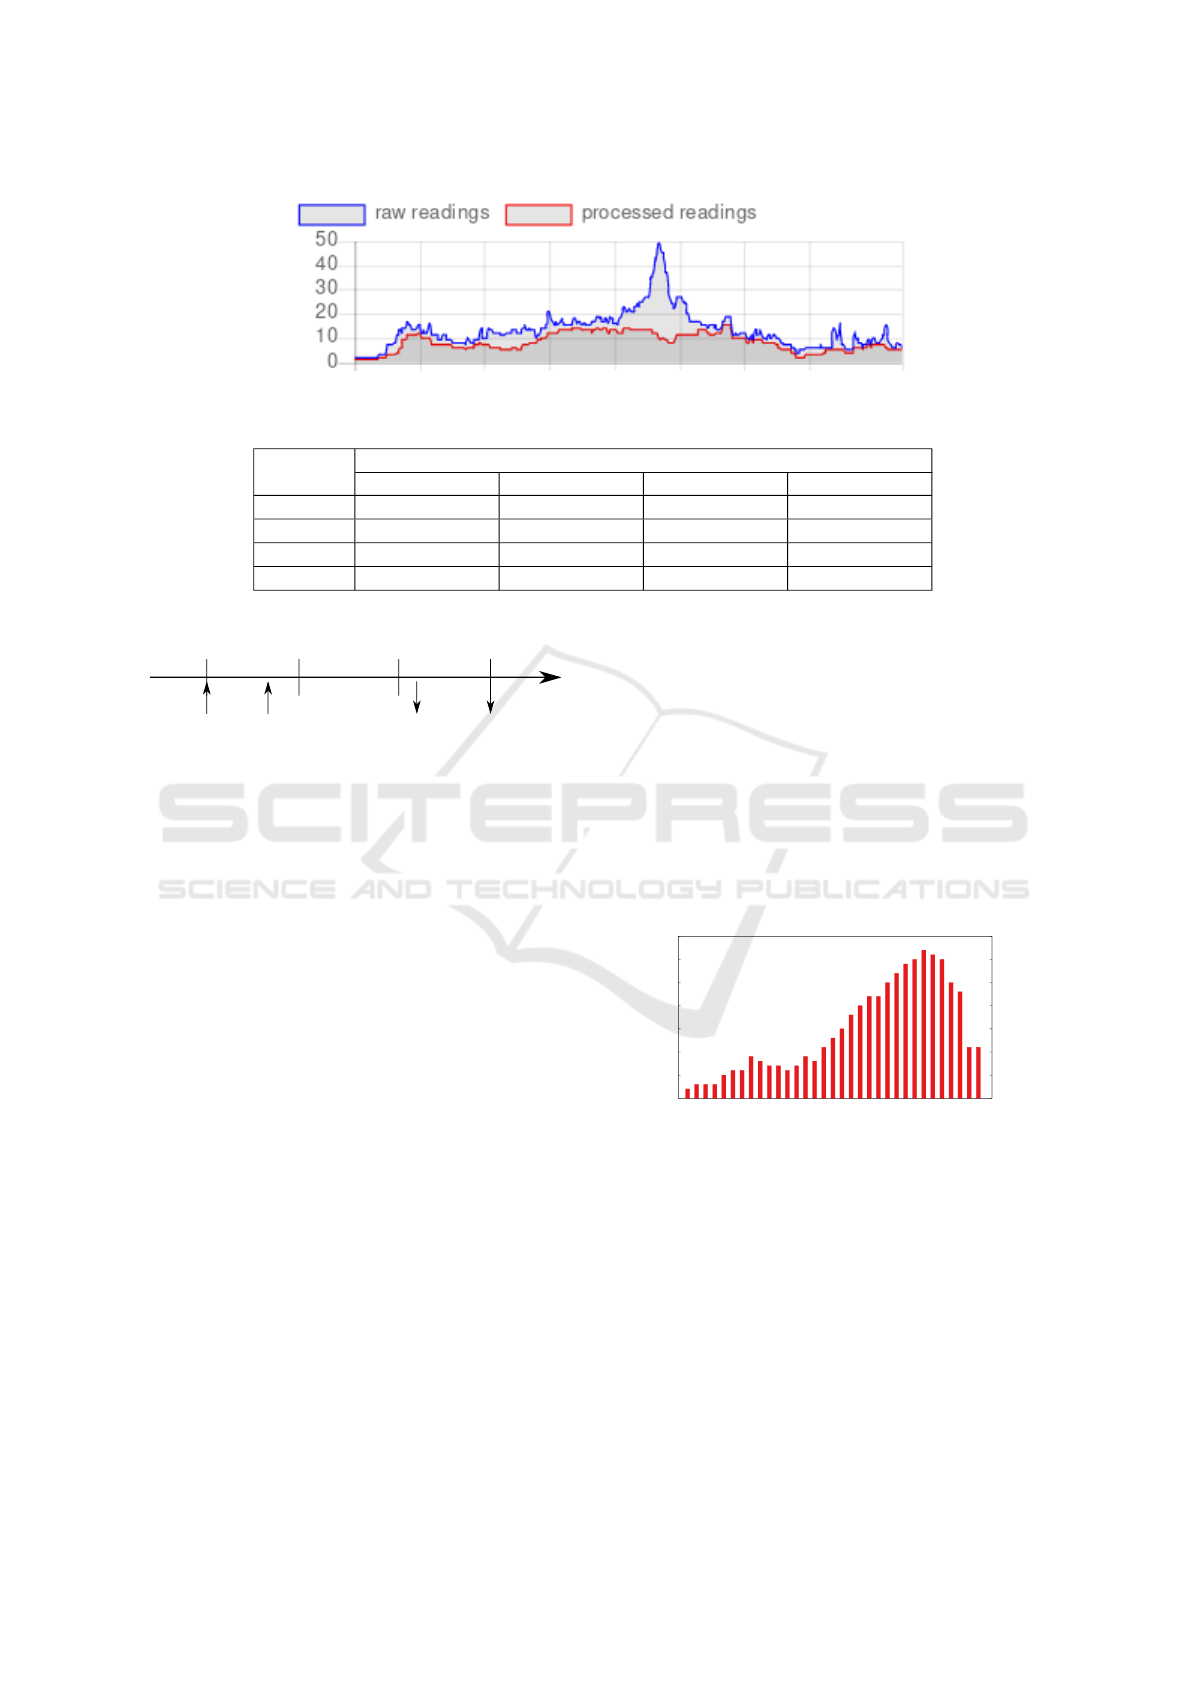
Figure 8: Bus occupancy chart displayed on the server’s Web interface.
Table 3: Effect of filters on the amount of traveler routes obtained.
Time Distance (meters)
(seconds) 0 1000 2000 3000
0 71929 (100%) 25014 (34.8%) 16389 (22.8%) 11721 (16.3%)
300 30294 (42.1%) 21533 (30%) 16266 (22.6%) 11716 (16.3%)
600 18894 (26.3%) 14594 (20.3%) 13137 (18.3%) 11099 (15.4%)
900 12263 (17%) 10013 (14%) 9195 (12.8%) 8474 (11.8%)
time
station n-1
station n
station m station m+1
first
detection
estimated
origin
estimated
destination
last
detection
Figure 9: Example of traveler OD estimation.
can cover that distance by foot if necessary. In any
case, the information still exists if it is considered to
be valid, we just provide the means to selectively dis-
card it in different views.
The values in Table 3 can also be used to have in-
formation regarding the amount of time that travelers
spend in the bus, and the amount of distance travelers
will use the bus for their needs.
As a speculation, we can say that as the amount
of distance between origin and destination and time
spent on the bus increases for a given device, the
chances that the device represents an actual traveler
on the bus increases.
We decided to use a 1000 meters distance filter
along with a 300 seconds time filter to filter out de-
vices outside of the bus to generate Origin Destina-
tion (OD) matrices. This can result in the exclusion
of some legitimate records, however records with val-
ues lesser than the ones considered will not have a big
impact on the bus network’s planning.
Different daily profiles were identified, and the
amount of passengers in a day varied between 72 and
4431 passengers. These records have allowed us to
successfully generate OD matrices, such as the one
presented in Figure 10.
The data obtained can also be used to generate bus
occupation charts. These display the bus load for ev-
ery line segment performed between consecutive sta-
00 01 02 03 04 05 06 07 08 09 10 11 12 13 14 15 16 17 18 19 20 21 22 23 24 25 26 27 28 29 30 31 32 33
00 # . . . . . . . 1 . . 1 . . . . . . . . . . . . . . . . . . . . . . 00
01 . # . . . . . . . . 1 . . . . . . . . . . . . . . . . . . . . . . . 01
02 . . # . . . . . . . . . . . . . . . . . . . . . . . . . . . . . . . 02
03 . . . # . . . . . . . . . . . . . . . . . . . . . . . . . . . . . . 03
04 . . . . # . . . . 1 . . . . . . . . . . . . . . . . . . . . . . . 1 04
05 . . . . . # . . . . . . . . 1 . . . . . . . . . . . . . . . . . . . 05
06 . . . . . . # . . . . . . . . . . . . . . . . . . . . . . . . . . . 06
07 . . . . . . . # . . . . . . . . . . . 1 1 . . 1 . . . . . . . . . . 07
08 . . . . . . . . # . . . . . . . . . . . . . . . . . . . . . . . . . 08
09 . . . . . . . . . # . . . . . . . . . . . . . . . . . . . . . . . . 09
10 . . . . . . . . . . # . . . . . . . . . . . . . . . . . 1 . . . . . 10
11 . . . . . . . . . . . # . . . . . . . . . . . . . . . . . . . . . . 11
12 . . . . . . . .
. . . . # . . . . . . . . . . . . . . . . . . . . 1 12
13 . . . . . . . . . . . . . # . . . . . . . . . . . . . . . . . 2 . . 13
14 . . . . . . . .
. . . . . . # . . . . . . . . . . . . . . . . . . . 14
15 . . . . . . . .
. . . . . . . # . . . . . . . . . . . 1 . . . 2 . . 15
16 . . . . . . . . . . . . . . . . # . . . . . . . . . . . . . . 1 . 1 16
17 . . . . . . . . . . . . . . . . . # . . . . . . . . . . . . 2 . . . 17
18 . . . . . . . . . . . . . . . . . . # . . . . 1 . . . . . 1 . 1 . . 18
19 . . . . . . . . . . . . . . . . . . . # . . . . . . . . . 1 . . . 2 19
20 . . . . . . . . . . . . . . . . . . . . # . . . . . . . . 2 . 1 . . 20
21 . . . . . . . . . . . . . . . . . . . . . # . . . . . . . . . . . . 21
22 . . . . . . . . . . . . . . . . . . . . . . # . . . . . . 1 . 2 . . 22
23 . . . . . . . . . . . . . . . . . . . . . . . # . . . . . . . 2 . 2 23
24 . . . . . . . . . . . . . . . . . . . . . . . . # . . . . . . 1 . 1 24
25 . . . . . . . . . . . . . . . . . . . . . . . . . # . . . . . . . 1 25
26 . . . . . . . . . . . . . . . . . . . . . . . . . . # . . . . . . 2 26
27 . . . . . . . . . . . . . . . . . . . . . . . . . . . # . . . . . . 27
28 . . . . . . . . . . . . . . . . . . . . . . . . . . . . # . . . . . 28
29 . . . . . . . . . . . . . . . . . . . . . . . . . . . . . # . . . . 29
30 . . . . . . . . . . . . . . . . . . . . . . . . . . . . . . # . . . 30
31 . . . . . . . .
. . . . . . . . . . . . . . . . . . . . . . . # . . 31
32 . . . . . . . . . . . . . . . . . . . . . . . . . . . . . . . . # . 32
33 . . . . . . . . . . . . . . . . . . . . . . . . . . . . . . . . . # 33
00 01 02 03 04 05 06 07 08 09 10 11 12 13 14 15 16 17 18 19 20 21 22 23 24 25 26 27 28 29 30 31 32 33
00 − M A T M 1
01 − SP 2
02 − L O T A 2
03 − G O D H6
04 − M T SP 2
05 − SA R 2
06 − P C ID 2
07 − E T R P 2
08 − C Q 8
09 − T I M 2
10 − H M L M 2
11 − M L H 2
12 − C RT O 2
13 − P G O N 2
14 − P I N G 3
15 − P O R I 2
16 − P A SS4
17 − I F O Z2
18 − C NT 1
19 − D L 1
20 − F L U 3
21 − C RV H 1
22 − G A S1
23 − SC L 1
24 − PA R R 1
25 − B IC 2
26 − M C E 2
27 − M V P 2
28 − A L F G 2
29 − M R G 2
30 − R B R I 2
31 − M S1
32 − S B N T 3
33 − P R L 1
Figure 10: OD matrix during June 29, 2017, from 8:20 to
9:03, between Matosinhos and Prac¸a da Liberdade.
0
5
10
15
20
25
30
35
0-MATM1
1-SP2
2-LOTA2
3-GODH6
4-MTSP2
5-SAR2
6-PCID2
7-ETRP2
8-CQ8
9-TIM2
10-HMLM2
11-MLH2
12-CRTO2
13-PGON2
14-PING3
15-PORI2
16-PASS4
17-IFOZ2
18-CNT1
19-DL1
20-FLU3
21-CRVH1
22-GAS1
23-SCL1
24-PARR1
25-BIC2
26-MCE2
27-MVP2
28-ALFG2
29-MRG2
30-RBRI2
31-MS1
32-SBNT3
33-PRL1
Figure 11: Bus load by route segment during June 29, 2017
from 8:20 to 9:03 of Matosinhos to Prac¸a da Liberdade.
tions in a bus line. An example is displayed in Figure
11.
6.2 Assessment of the FNA Impact
Our Data Collector is able to distinguish stations de-
tected only because of FNA (because they are de-
tected when using exclusively frames to get in contact
with our fake beacon producer). This information was
kept in the records sent to the server, so we can assert
the relevance of FNA using the stored records. Ana-
Survey of Public Transport Routes using Wi-Fi
175
0
2
4
6
8
10
12
14
16
18
0-PRL1
1-SBNT
2-MS2
3-RBRI1
4-MRG1
5-ALFG1
6-MVP1
7-MCE1
8-BIC1
9-PARR2
10-SCL2
11-GAS3
12-CRVH2
13-FLU2
14-DL2
15-CNT2
16-IFOZ1
17-PASS3
18-SRLZ1
19-PING1
20-PLUZ1
21-PGON1
22-CRTO1
23-MLH1
24-HMLM3
25-TIM1
26-CQ5
27-PCID3
28-PCID1
29-SAR1
30-AVM1
31-MTSP1
32-GODH5
33-LOTA1
34-SP1
35-MATM1
2017-09-26 08:38->09:20
2017-10-18 08:08->08:52
0
2
4
6
8
10
12
14
16
18
20
0-PRL1
1-SBNT
2-MS2
3-RBRI1
4-MRG1
5-ALFG1
6-MVP1
7-MCE1
8-BIC1
9-PARR2
10-SCL2
11-GAS3
12-CRVH2
13-FLU2
14-DL2
15-CNT2
16-IFOZ1
17-PASS3
18-SRLZ1
19-PING1
20-PLUZ1
21-PGON1
22-CRTO1
23-MLH1
24-HMLM3
25-TIM1
26-CQ5
27-PCID3
28-PCID1
29-SAR1
30-AVM1
31-MTSP1
32-GODH5
33-LOTA1
34-SP1
35-MATM1
2017-09-26 16:24->17:08
2017-10-18 16:57->17:40
0
5
10
15
20
25
30
35
0-MATM1
1-SP2
2-LOTA2
3-GODH6
4-MTSP2
5-SAR2
6-PCID2
7-ETRP2
8-CQ8
9-TIM2
10-HMLM2
11-MLH2
12-CRTO2
13-PGON2
14-PING3
15-PORI2
16-PASS4
17-IFOZ2
18-CNT1
19-DL1
20-FLU3
21-CRVH1
22-GAS1
23-SCL1
24-PARR1
25-BIC2
26-MCE2
27-MVP2
28-ALFG2
29-MRG2
30-RBRI2
31-MS1
32-SBNT3
33-PRL1
2017-09-26 17:08->18:07
2017-10-18 17:40->18:36
Figure 12: Comparison of bus loads by route segment on
line 500, obtained for the exact same route, for a similar
hour (during rush hours) in two week days (Tuesday and
Wednesday).
lyzing the data collected, we determined that the Fake
Network Advertisement (FNA) strategy is responsi-
ble for 2.25% of all traveler routes obtained without
filtering and 0.65% using the previous filters. These
values refer to devices that were detected exclusively
due to FNA.
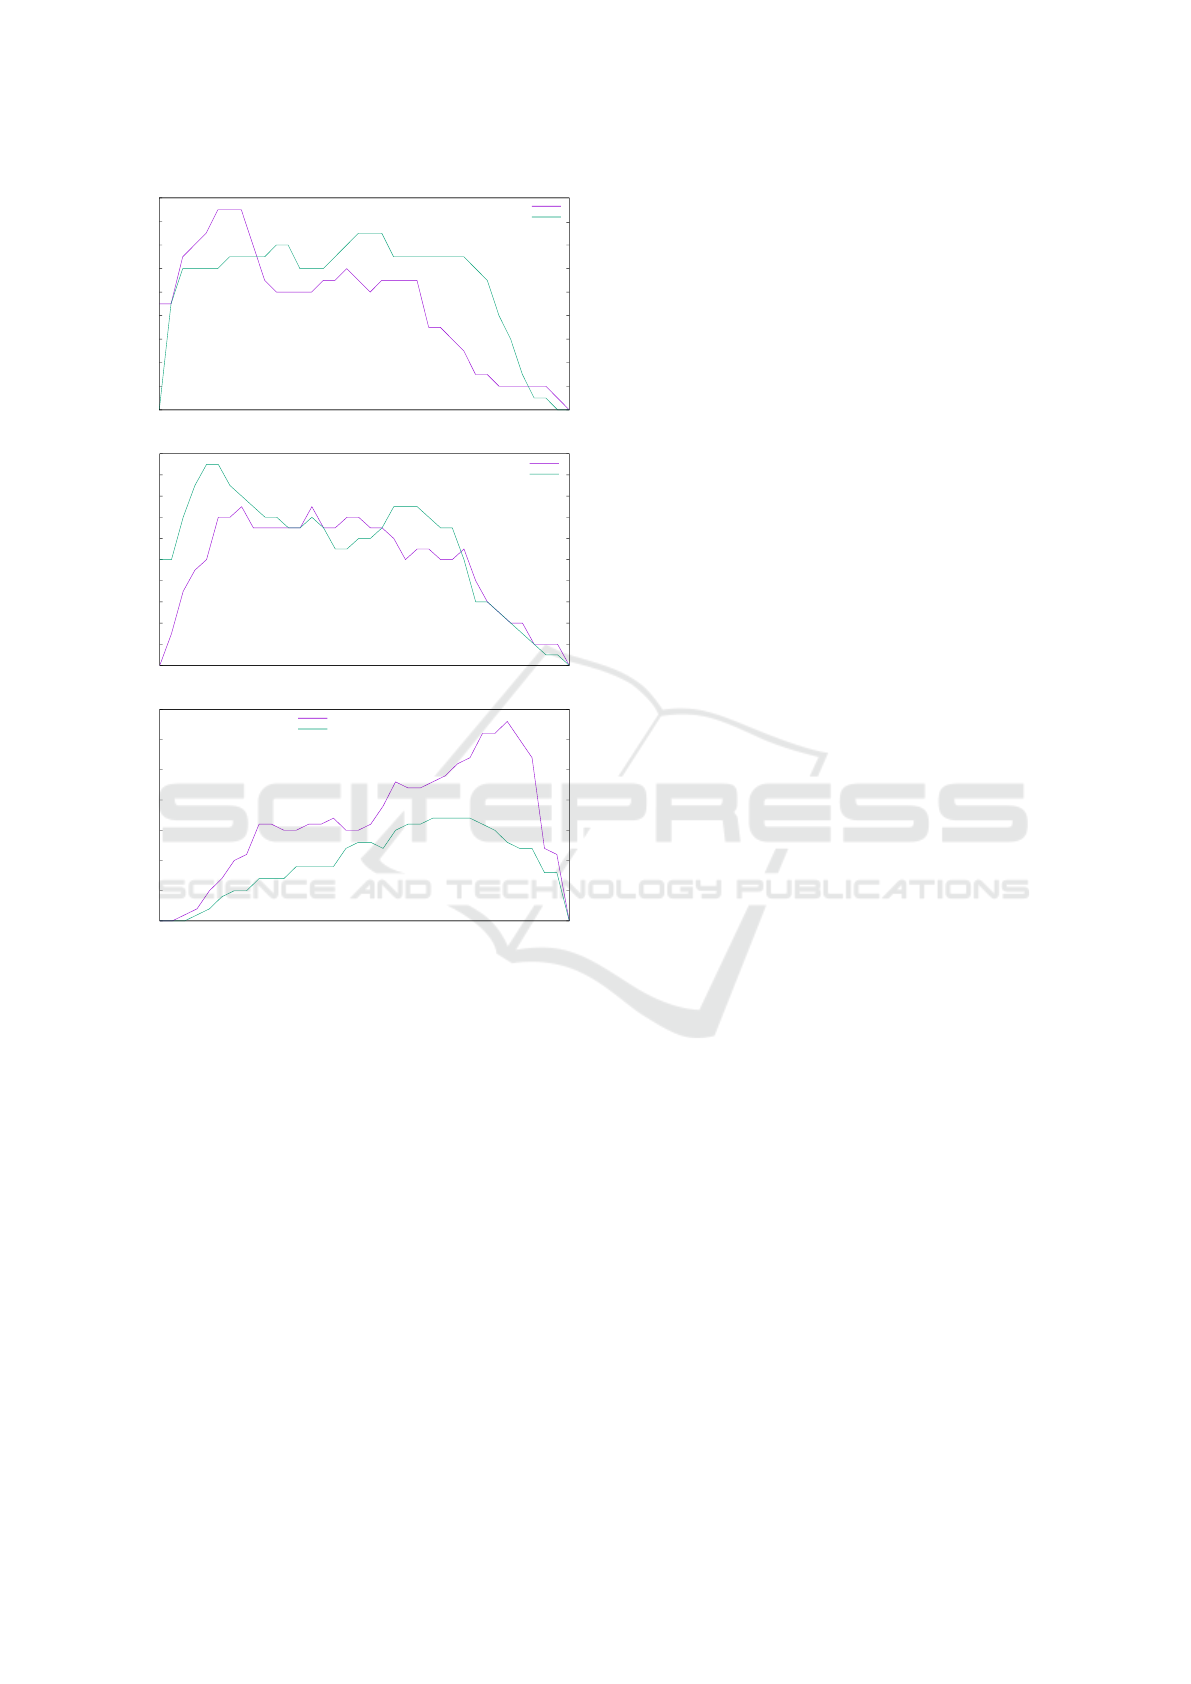
6.3 Data Quality Assessment
To assess the quality of the data collected, we com-
pared similar situations in different days, but for the
same week day. This comparison was based on bus
load by line segment between consecutive stations.
Figure 12 represent comparisons between September
26, 2017 (Tuesday) and October 18, 2017 (Wednes-
day) during similar periods during rush hours.
In these graphs we can observe similar load pat-
terns in similar situations on different week days on
different months. These similarities provide some
credibility to the data collected by this system and to
the overall solution.
7 CONCLUSIONS AND FUTURE
WORK
In this paper we presented a Wi-Fi based system that
is able to collect travelers routes in public transporta-
tion vehicles, namely on buses. The system works
without without the cooperation of travelers other
than having the Wi-Fi interface activated in their per-
sonal devices. The system is mainly passive, in the
sense that it does not interfere with existing commu-
nications, except in the case of the FNA strategy, de-
ployed for detecting otherwise silent devices. Nev-
ertheless, the FNA strategy does not introduce any
disruption on existing communications, since the fake
hot-spots are not announced when there is one real in
the vicinity of the Data Collector.
The system conceived was fully implemented and
deployed in a bus for collecting real data. The Web
interface developed for analyzing the data provided
by the Data Collector and stored by the server allowed
us to perform multiple analysis in order to validate it
and conclude about its correctness.
The amount of results obtained is considerably
higher than results obtained in different works us-
ing other technologies. This amount also indicated
that devices outside the bus were still being detected,
which resulted on the development of additional fil-
tering strategies to be applied to the stored data.
The data collected was filtered and contextualized
in order to generate Origin Destination (OD) matri-
ces. The analysis on the generated OD matrices al-
lowed us to assess the plausibility of the solution and
to identify some behaviors and typical traveler routes,
which can then be used to improve the service offered
by the bus network.
Considering the results obtained we can say that
Wi-Fi is a promising prospect regarding OD matrix
estimation, a powerful resource for public bus net-
working planning.
For future work we want to validate our data with
ticketing records obtained in buses, in order to assess
the relationship between our occupancy loads and the
number of passengers’ entries on buses.
VEHITS 2018 - 4th International Conference on Vehicle Technology and Intelligent Transport Systems
176

ACKNOWLEDGEMENTS
This work was supported in part by National Funds
through FCT - Fundac¸
˜
ao para a Ci
ˆ
encia e a Tec-
nologia under the project UID/EEA/50008/2013, in
part by the IT Internal Project SmartCityMules
and in part by the CMU-Portugal Program through
S2MovingCity: Sensing and Serving a Moving City
under Grant CMUP-ERI/TIC/0010/2014.
REFERENCES
Abedi, N., Bhaskar, A., and Chung, E. (2013). Bluetooth
and Wi-Fi MAC address based crowd data collection
and monitoring : benefits, challenges and enhance-
ment. In School of Civil Engineering & Built Environ-
ment; Science & Engineering Faculty; Smart Trans-
port Research Centre, Queensland University of Tech-
nology, Brisbane, QLD.
Ashok, K. and Ben-Akiva, M. E. (1993). Dynamic Origin-
Destination matrix estimation and prediction for real-
time traffic management systems. In International
Symposium on the Theory of Traffic Flow and Trans-
portation ( 12th : 1993 : Berkeley, Calif.). Transporta-
tion and traffic theory.
Bullock, D., Haseman, R., Wasson, J., and Spitler,
R. (2010). Automated Measurement of Wait
Times at Airport Security. Transportation Research
Record: Journal of the Transportation Research
Board, 2177:60–68.
Kostakos, V., Camacho, T., and Mantero, C. (2010). Wire-
less detection of end-to-end passenger trips on pub-
lic transport buses. In 13th International IEEE Con-
ference on Intelligent Transportation Systems, pages
1795–1800.
Musa, A. B. M. and Eriksson, J. (2012). Tracking Unmod-
ified Smartphones Using Wi-fi Monitors. In Proceed-
ings of the 10th ACM Conference on Embedded Net-
work Sensor Systems, pages 281–294, New York, NY,
USA. ACM.
O’Neill, E., Kostakos, V., Kindberg, T., Schiek, A. F. g.,
Penn, A., Fraser, D. S., and Jones, T. (2006). Instru-
menting the City: Developing Methods for Observing
and Understanding the Digital Cityscape. In UbiComp
2006: Ubiquitous Computing, Lecture Notes in Com-
puter Science, pages 315–332. Springer, Berlin, Hei-
delberg.
Shlayan, N., Kurkcu, A., and Ozbay, K. (2016). Explor-
ing pedestrian Bluetooth and WiFi detection at public
transportation terminals. In Intelligent Transportation
Systems (ITSC), 2016 IEEE 19th International Con-
ference on, pages 229–234. IEEE.
Survey of Public Transport Routes using Wi-Fi
177
