
Improving Course Content While Creating Customized Assessment
and Support at the Conceptual Level
Toby Dragon and Elisabeth Kimmich Mitchell
Department of Computer Science, Ithaca College, 953 Danby Rd, Ithaca, NY, U.S.A.
Keywords: Concept Maps, Automated Assessment, Intelligent Tutoring Systems (ITS), Expert Knowledge Bases (EKB).
Abstract: We present a system that utilizes a wide variety of available assessment information to automatically analyze
students' understanding at a conceptual level and offer relevant automated support to teachers and students.
This support includes interactive visualization of the conceptual knowledge assessment, individualized
suggestions for resources to improve areas of weakness, and suggestions for dynamic student groups for in-
class activities. This system differs from prior related work in that the basis for analysis and feedback is
entirely customized to the individual instructors' course content. We discuss how the system is configured for
each course, and provide evidence that this configuration process helps instructors improve their course
content. We then provide detailed descriptions of how the system performs analysis and offers support
including suggesting resources for students and creating dynamic groups within a class. Finally, we discuss
the potential benefits provided by this system and how the system is being applied to six different computer
science courses currently.
1 INTRODUCTION
Instructors currently face an ever-wider variety of
resources to support their courses. These options
range from traditional textbooks to fully interactive
online learning environments. Instructors can take a
traditional approach, relying on a single source for
their material, but instructors also have the option to
use several different types of resources, pulling from
traditional text, online articles, online practice
environments, video tutorials, etc. While these
materials may rapidly change for a variety of reasons,
most instructors also have an understanding of the
core concepts and organization of a course that
remains consistent across iterations of the course and
changes in materials. Our system supports instructors
that want to apply their own organization to a variety
of content in this way.
Our system offers automated analysis and support
to students and teachers in these dynamic scenarios
by allowing instructors to encode their conceptual
organization for a course and to attach the varied
types of educational materials and assessment used.
In this way, the instructor has a means to organize
their course around their choice of important
concepts, rather than letting the educational resources
impose an organization.
We demonstrate that, for instructors interested in
defining their own conceptual vision of a course, our
system actually helps improve the content and
organization of the course. We then demonstrate how
the artifacts created through this process can be used
to provide a variety of intelligent feedback, including
an open-learner-model visualization of conceptual
understanding, direct feedback for teachers and
students, and intelligent grouping suggestions. We
discuss the general manner in which the framework
can be used for such feedback, and the specific
implementation we currently employ.
The paper is organized as follows: first we present
relevant related work from a wide variety of fields
(section 2). We then present our goals in context of
that prior work (section 3), and the underlying
structure on which our system is based (section 4).
We present the manner in which the system is
configured by instructors, and our experience
configuring the system (section 5). Finally, we
present the various types of feedback the system
provides (section 6), and discuss plans for ongoing
classroom experimentation (section 7).
110
Dragon, T. and Kimmich Mitchell, E.
Improving Course Content While Creating Customized Assessment and Support at the Conceptual Level.
DOI: 10.5220/0006710101100121
In Proceedings of the 10th International Conference on Computer Supported Education (CSEDU 2018), pages 110-121
ISBN: 978-989-758-291-2
Copyright
c
2019 by SCITEPRESS – Science and Technology Publications, Lda. All rights reserved

2 RELATED WORK
Our work is currently focused on the domain of
computer science education. Therefore, to understand
the greater setting, we should consider the technology
available for use in computer science education and
how it relates to our current efforts. However, we
should note the system is not inherently tied to this
domain, and that we see great promise in application
in other domains.
Current computer science education technology
systems may provide either instruction (educational
content), practice environments, or both. These
systems may also provide automated feedback to
students, tools to support teachers in the grading
process (including automation) or both. Finally, there
are several full-fledged Intelligent Tutoring Systems
(ITS) for computer science education that perform
automated analysis and use it to offer individualized
feedback and educational information. We consider
our system to offer something different from these
other tools in respect to customization, and we see
great potential for integration with these systems that
could benefit users of both systems.
Online textbooks are available and used for a
significant portion of current computer science
courses, and for good reason. They are more easily
edited, customized, and updated than traditional
textbooks. They can also offer interactive practice
interleaved with content, and are often less expensive.
However, a concern for instructors is that these
systems provide an inconsistent set of tools to
understand student's performance on interactive
practice problems. These tools can range from almost
no support to complex data analysis tools. For
example, Vital Source
1
, a popular e-textbook source,
provides text with practice problems, but offers the
teachers no information about student performance.
Runestone Interactive
2
, a free, open source textbook
project, offers certain statistics about student
performance including pages viewed, and success on
multiple-choice-type questions, but for more complex
information one must consider individual answers or
access the database and process the raw information
oneself. The rapidly growing online textbook system
Zybooks
3
offers higher-level analytical information
including automated grading of programming
assignments based on test cases. This wide variety of
accessible information makes it hard to a teacher to
switch tools, or aggregate different tools.
Considering systems that are not online textbooks,
many online homework systems for computer science
offer more robust and automated tools for instructors
to grade assignments, but do not deliver content
directly, rather offering only practice. These systems
are generally used in tandem with online or standard
textbooks. Examples of these systems include
Problets
4
, MyLab Programming
5
, Codio
6
, and
Vocareum
7
. These systems all provide some level of
automation and tools to help instructors assess
students.
The information all of these systems provide to
instructors and students is rooted in specific
individual assignments or questions. There is great
power in this information. However, in all of these
systems, the information is focused on student
performance on specific assignments, rather than any
type of summary of what concepts the students
understand. Our system uses that type of assignment-
specific information as a basis for assessment at a
higher level of abstraction, namely the conceptual
level.
Focusing on research in the ITS field, there are
many systems that teach various aspects of computer
science (Barnes et al., 2017) . Many ITS for computer
science education organize analysis at a higher level
of abstraction in order to base feedback on a
conceptual level, rather than remaining assignment–
specific. Butz et al. present a system employing
Bayesian networks to estimate higher-level
assessment (Butz et al., 2006). Sosnovsky and
Brusilovsky present a system that organizes both
content and assessment by topic, and present
compelling evidence of the system's success with
extensive usage (Sosnovsky and Brusilovsky, 2015).
These systems demonstrate the potential for a system
to offer high-level assessment and feedback, but they
are tied to a certain knowledge base and a certain set
of resources. Even when automating the process of
creation (Lin et al., 2011), the product is a single set
of content organized by the ITS developers. Many
instructors desire this type of "out-of-the-box"
functionality. However, our system is aimed at
instructors that want automated support but also want
to exert a high level of control of the content and
organization of their course.
Our system provides the ability to assess students
at the conceptual level using each specific instructor's
understanding of their course, their materials, and
their assessment metrics. Those metrics could include
any of the assignment-specific assessment offered by
the aforementioned computer science education
technology, as we discuss further in section 4.3. We
offer a solution that includes the benefits of ITS
techniques combined with the variety of content and
assessment available through the plethora of online
tools and offline resources, and catered to the
Improving Course Content While Creating Customized Assessment and Support at the Conceptual Level
111
individual instructors' needs and understanding of the
course.
Our approach to offering this customization is
based on concept mapping. Concept mapping has
been shown to be a useful tool for science education,
helping students organize their knowledge and to
demonstrate their understanding of interconnections
between concepts (Novak, 1990). Likewise,
instructors who are planning courses or curricula can
use the same technique to explicate the concepts and
the interconnections to be taught. This application of
concept mapping during curriculum development has
demonstrated benefits in biology and medicine,
including improved cohesion and clarification of
concepts and their interconnections (Starr and
Krajcik, 1990; Edmondson, 1995).
A potential concern we consider about this prior
work is that these concept maps were not connected
to the actual assignments given in class, were not used
in the practice of the class, and therefore were most
likely left behind at some point. Closer to our own
technique, Kumar demonstrated the use of concept
maps as a basis for intelligent tutoring (Kumar, 2006).
We apply this technique to in a way that uses the
instructor's concept map in the classroom process,
and ties it directly to the specific course content.
3 GOALS
Our approach leverages the ideas and technology
from the fields of computer science education, ITS,
and concept mapping to accomplish one major
overarching goal: to support students and instructors
in situations where instructors want fine-tuned
control over their course content and organization.
We provide a holistic system that helps instructors
improve their organization and content while
simultaneously creating a data structure used by the
same system to provide intelligent, automated
assessment and feedback. This goal can be broken
down into component parts: 1) creating a generic
underlying structure that can be customized for
individual courses and used by an ITS to offer
automated support to instructors and students (section
4); 2) creating a customization process that helps
instructors improve their course organization and
content (section 5); and 3) using that customized
structure to provide automated assessment and
feedback (section 6).
Considering these goals, our approach will only
be successful if: 1) the effort expended customizing
the system for a given class actually helps the
instructor improve their course; 2) if this
customization process can be accomplished in a
reasonable amount of time, such that it is feasible for
instructors; and 3) if the system using the structure
can provide useful assessment and feedback.
4 THE SYSTEM FOUNDATION
All analysis performed by our system is based upon a
data structure we term the concept graph. For an
instructor to use our system with their course, they
must define a concept graph and connect the
resources they intend to use. This process explicates
what concepts need to be taught and the manner in
which the resources used for the course are related to
those concepts. We have seen indication that the
instructor's role in creating these graphs has direct
benefits for the instructor's course (see section 5).
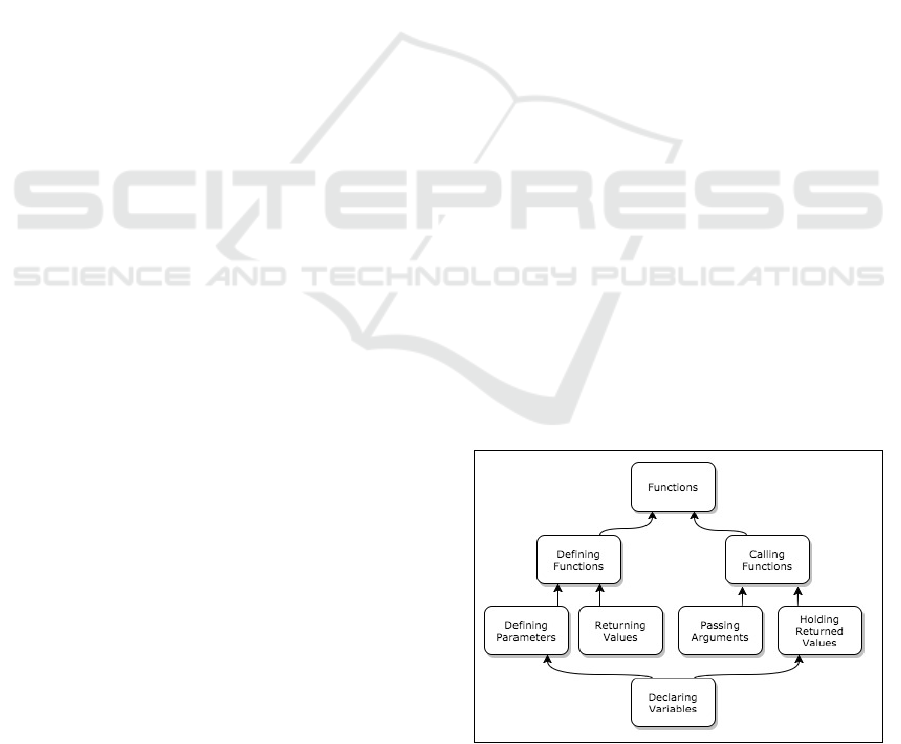
4.1 The Concept Graph
The concept graph is a Directed Acyclic Graph
(DAG) explicating the specific concepts to be taught
in the course and their inter-relations, see Fig. 1. We
draw these graphs with high-level concept nodes
appearing at the top of the graph, and low-level nodes
appearing underneath. Low-level nodes have edges
that point to higher-level nodes. Each edge represents
roughly the relationship "is-a-part-of." Node B
pointing to node A would indicate that the knowledge
of topic B is part of the necessary knowledge for topic
A. In ITS terms, this model serves as the domain
model, an Expert Knowledge Base (EKB) (Woolf,
2010). It also serves as the basis for a student model.
Namely, our student model is an overlay model,
because we hold an estimate of the student's
knowledge for each node (concept) in the EKB.
Figure 1: An example concept graph explicating the
concepts related to functions that are taught in an
introductory computer science course.
CSEDU 2018 - 10th International Conference on Computer Supported Education
112

This concept graph structure serves as the core
representation that the system uses to provide
automated analysis and support to students. The
structure is encoded in JSON text format as a list of
nodes and links, making it easily customizable and
configurable.
4.2 Connecting Resources
Beyond the basic concept graph that encodes the
important concepts and their interconnection, the
system also requires a record of the resources used in
the course and how these resources relate to the
concepts in the graph. We use the term resource to
refer to any artifact that imparts information to a
student about the content (subject matter) of the
course. We consider two main categories of
resources: assessments and materials. Assessments
are any resources about which a student receives a
grade. An easy location to gather this information is
the gradebook the instructor keeps for the course.
Materials are any resource that simply provide
information to the student, such as textbook chapters,
websites, practice environments that do not provide
information to the instructor, etc. This distinction
between assessments and materials is important
because the system uses assessments to calculate the
knowledge estimate for each concept (see section 6.1)
and then uses both materials and assessments when
making suggestions (see section 6.2).
Our system currently keeps little information
about these resources, each being identified by only a
display string and an ID. The system does not
currently maintain any information about the actual
content.
Resources are connected to the concept graph
manually by the instructor (this process is one step of
the authoring process that creates complete graphs,
described in section 5). The list of resources is
generally large for an entire course and complex
(each resource is potentially linked to several
concepts).
4.3 Connecting Assessment Data
The system now needs data for individual students.
These data are entered into the system through CSV
file format, which can be directly exported from many
systems that hold assessment information. Any
common spreadsheet program used for grades (e.g.,
Microsoft Excel, Google Sheets) can output in this
format and be accepted by our system, as well as
many educational software programs. For example,
our college uses the Sakai educational software
platform. Any grades entered in Sakai for a course
can be automatically output to a file and directly input
into our system. Zybooks and Codio output similar
CSV data formats, and can be accepted by our system.
Multiple CSV files are accepted, allowing several
different sources of assessment for the same course.
The connection between the output from these
different tools and the resources recognized by the
system is the ID of the resource. The ID for the
resource must match a column header in the CSV file
for the data to be recognized. For this reason, our
system processes CSV files and produces a JSON file
that represents the assessments from the CSV files.
This JSON file is then edited to add titles, concept
connections and relative weights of the specific
assignments, defining the resource connections to the
system. In this way, we directly connect student data
from any external assessment to our concept graph.
5 IMPROVING COURSE
CONTENT THROUGH
AUTHORING
The prior section describes the process by which the
system is customized for a given course, namely
creating a concept graph, connecting resources, and
finally inputting grade files. This work can be
considered an authoring task for an ITS (Murray,
2003), and therefore we need to consider carefully the
time, effort, and payoff involved to understand the
likelihood of instructors successfully adopting the
system. We now offer some detail of the process we
employ to complete these necessary steps, and
describe our experience using the system with real
instructors.
5.1 The Authoring Process
The first step in creating a concept graph is to define
a set of concepts that students should learn in the
given course. There are many sources from which to
derive this set, including the course syllabus, student
learning objectives associated with the course, the
course schedule, and the table of contents of an
associated text. Creating a single set from all these
varied sources may seem daunting due to the sheer
size and varied levels of abstraction, therefore we
must understand that this is merely a brain-storming
step, and in our view there is no single right or wrong
collection. We have also found that, when given
examples, instructors are intuitively aware of such a
Improving Course Content While Creating Customized Assessment and Support at the Conceptual Level
113

set of concepts for classes they have already taught
(see section 5.2).
Moving beyond the set of concepts, the next step
is to draw a graph structure representing the
connections between these concepts. This will likely
cause revision of the concept list: addition,
subtraction, merging for simplification, dividing for
clarification, etc.
This mapping moves the author beyond isolated
concepts (such as those addressed by concept
inventories (Almstrum et al., 2006) ), and also beyond
organizations like course schedules (ordered list) and
tables of contents (tree), which are all inherently
limited. In a list, concepts can only be associated as
before or after another concept, and in a tree, each
concept can only have one parent concept (i.e., the
concept can only appear in one entry of the table of
contents). You can note the redundant and sometimes
awkward representation in the table of contents of
texts where multiple chapters contain the same
concept revisited. By allowing a many-to-many
mapping when considering topics, we loosen the
constraints to allow important distinctions, such as
clarifying that a single concept learned early on in the
course will be used and reinforced when learning
higher-level concepts covered later in the course.
While we consider this freedom crucial to accurately
representing certain scenarios, it should be noted that
a tree or list organization is perfectly acceptable as a
DAG, and therefore can be used when an instructor
considers it the ideal representation.
This process of mapping the interrelations of
concepts can aid instructors in improving the overall
organization of their course content (see section 5.3).
Instructors find relations that were not made clear to
students, identify redundant presentation of concepts,
and recognize better ordering in which to present
concepts.
Once a first draft version of the concept graph has
been drawn, the next task is to associate the resources
used in the course with this concept graph. For this
part of the process, the instructor needs to identify
each resource (assessments and materials) with a
unique name. Clearly, an instructor must be aware of
all the resources used when administering the course.
The challenge of this portion is to connect those
resources to individual concepts in the concept graph.
The list of resources is generally large and each
resource is potentially linked to several concepts, so
we engage in the resource relation process by
considering each individual resource and identifying
the connection to concepts, rather than attempting to
draw a diagram of the relations.
The process of identifying relations between
resources and concepts is productive because it
informs the instructor as to how the actual assessment
and materials provided are related to their intention of
teaching specific concepts. Through this process,
instructors can recognize areas for improvement in
their course content, such as limited or no
assessments on key concepts, or too little material
directly related to a concept (see section 5.3). They
might also recognize that assessments should be
divided in order to help their students and themselves
pinpoint areas of misconception.
The concept graph itself can become large and
complex, and in practice we have found it generally
too complicated to visualize resources as separate
items in the same diagram as the concept graph (as
mentioned previously).
5.2 Authoring in Action
To test the practicality and potential benefit of this
authoring process, we engaged seven different
instructors (including one author of this paper) to
create seven concept graphs for six different courses
in our departmental curriculum. In most of the cases,
individual instructors created the graph for their
course. Alternatively, for certain courses with
multiple sections, pairs of instructors who co-teach
created the graphs together. Each graph creation
started with a 30-45 minute introduction and
discussion with our team to communicate the task and
the purpose as described in section 5.1. Instructors
then created graphs on their own time by drawing on
white boards and taking pictures (tracking their time
investment). They delivered their initial attempts to
our team, who analyzed the results and conducted
another 30-45 minutes of clarification and discussion
with the participants for each graph.
A graph was created for each course, although
some graphs represented only a sub-section of a
course and others did not have resources associated
with them. We do not consider these partial creations
an incomplete attempt, but rather a step in an iterative
process from which we can learn (for further
discussion see section 5.3). Table 1 summarizes the
courses and the respective effort to create a concept
graph for each.
Overall, the average creation time for a complete
graph (rows 1, 4, and 6) is 3.7 hours and average
authoring time spent over all graphs including partial
solutions is 2.4 hours. We recognize the weakness of
small sample size, and the specific bias that an author
created several of the most complete graphs. Even
with this considered, we see indication that
CSEDU 2018 - 10th International Conference on Computer Supported Education
114
productive graphs can be created on the order of
hours, which we consider to be a time expense that
most instructors could afford as long as there is
recognizable benefit to their class.
Table 1: Individual courses and their respective authoring
efforts. Different instructors created two different graphs
for different implementations of Comp. Sci. I. * indicates
one instructor that worked on multiple graphs and is an
author of this paper.
Course
Title
#
of
instructors
Hours
authoring
#
of
concepts
Complete
course?
Resources
connected?
Comp. Sci. I
1*
4
42
Yes
Yes
Comp. Sci. I
2
1
21
Yes
No
Comp. Sci. II
2*
1
17
Yes
No
Data Structures
1*
4
36
Yes
Yes
Discrete Structures
1
1
10
No
Yes
Website Dev.
1
3
39
Yes
Yes
Comp. Info. Tech.
1
3
19
Yes
No
We see that increased time also indicates increased
complexity in the graph structure, and that connecting
resources seems to also be correlated with more
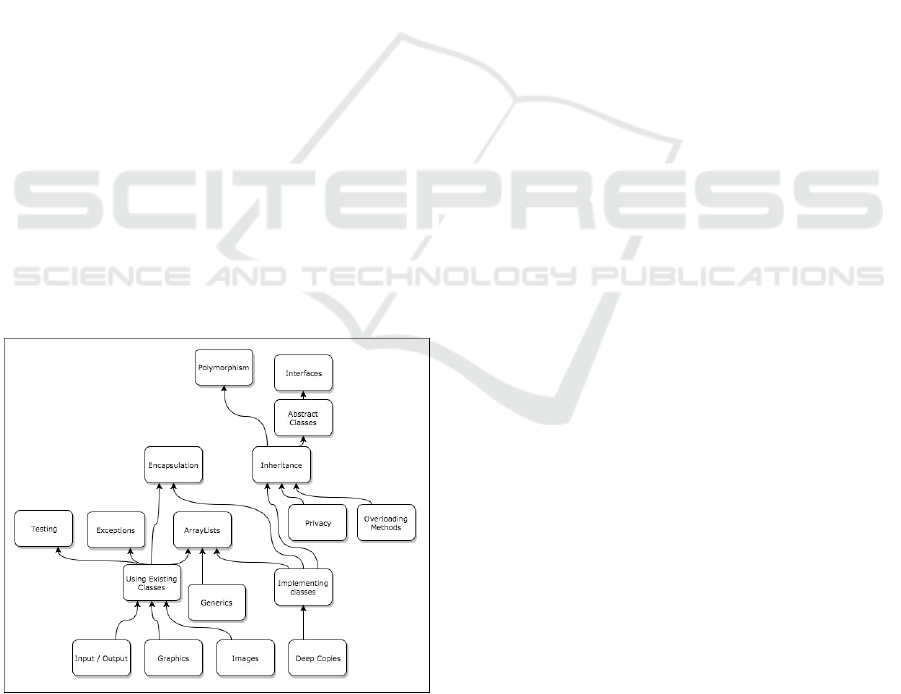
complex graphs. Fig. 2 and Fig. 3 shows two different
concepts graphs, one simpler example created in a
short period of time without connecting resources,
and another created by the author demonstrating more
complexity. We consider both of these efforts to have
been successful in their own right, as both instructors
found significant value in the process.
Figure 2: The concept graph created for Comp Sci. II
demonstrates the results of a shorter effort without
connecting resources. The course is focused on Object
Oriented Programming.
5.3 Benefits and Challenges of
Authoring
There was general consensus that the authoring
process urged instructors to improve both
organization and content within their courses. The
process required instructors to carefully consider the
order in which concepts are introduced and clarified.
For example, two instructors noticed overarching
concepts that were not being addressed as such. The
issue was mitigated by reordering the topics to group
around the actual concept in one case, and, in another
case where this wasn't possible, by introducing the
general concept more clearly in the beginning and
noting the various applications as they occur.
In terms of content, the most common realization
was that assessments were broad; covering many
different concepts e.g., "Lab 8 covers these six
concepts." When a student scores poorly on such an
assessment, neither the instructor nor the student
receive clear information about which specific
concepts are the root of the issue. Several professors
are currently re-working their assessments to include
smaller, more targeted assessment. Other realizations
included excessive assessment of one topic, missing
direct assessment of others, and assessments on topics
where very few materials are available for individual
study (an indication more materials might be helpful).
The overall process was reportedly helpful for both
revisiting familiar material and developing a new
course. Most instructors were applying this technique
to a course that they had already taught. These
instructors reported that the process helped them
formalize and clarify a structure for information with
which they were already somewhat familiar. One pair
of instructors was applying the process to a new
course and reported that the process helped them
realize that the course might be covering too much
information and therefore provide too little practice
when considering assessments and materials for each
of the given concepts.
The main concern expressed by instructors about
the process was managing the complexity of the task
at hand. While the process is not overly time
consuming (as shown in Table 1), the scope and
ambiguity can be challenging. To complete a detailed
concept graph for an entire course in addition to
connecting relevant resources offers a daunting
challenge. There are several approaches to mitigate
this concern. The first is built into our process; the
idea of splitting this task into two distinct portions,
creating the concept graph and then linking the
resources. These steps can operate fairly
independently. As we described in section 4,
Improving Course Content While Creating Customized Assessment and Support at the Conceptual Level
115
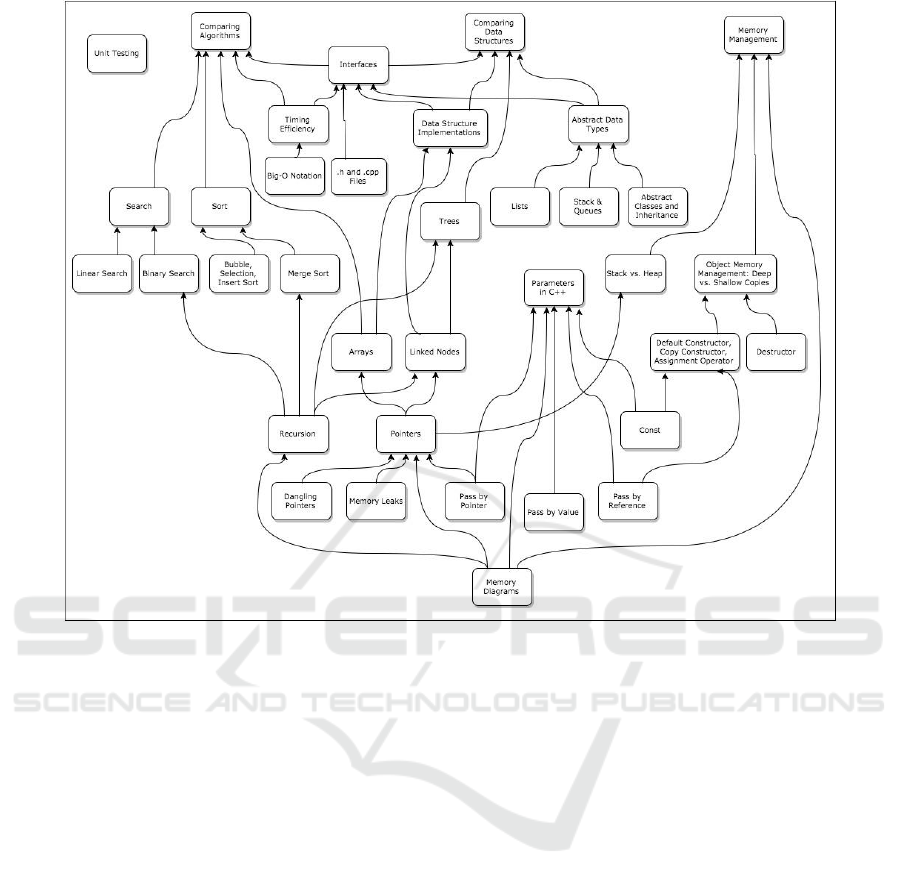
Figure 3: The concept graph created for Data Structures demonstrates a more complex graph resulting from a longer effort
that included the process of connecting related resource. The course covers memory management and data structures in C++.
performing the linking process for each resource in
isolation simplifies and clarifies the task, rather than
mapping each resource as a node in the graph, which
can become overwhelming
In practice, some instructors used the
graph/resource split to limit their upfront effort. As
seen in the table, some instructors did not link their
resources during this exercise. Rather, they intend to
link resources as they use them in class during the
semester. This is a particularly practical approach for
those that are either starting a new course or
drastically altering the resources provided.
A different approach to limiting the scope of the
initial work was to build the graph and link the
resources for only a subsection of the course. In this
way, the instructor has a full description of conceptual
basis and the link to the resources for part of the
course.
Both of these approaches yield an incomplete
concept graph artifact. We still consider the effort to
be meaningful in two distinct ways. First, given the
amount of time invested, we consider it to be
reasonable that full graphs can be completed by
instructors during any given semester. Second, even
in situations where the graph creation was limited to
a portion of the course, the product is still useful. The
instructor still noted the benefits of improved course
organization and content, and as long as relevant
resources were connected the to graph, the
incomplete work can still be used by the ITS.
Another recurring concern during the graph
creation process was ambiguity. Participants found it
challenging to create a "correct" graph. This was due
to the general debate about the manner in which a
course should be taught, as well as specific concerns.
In terms of the general debate, our suggestion is
to enjoy the discussion and remember that the graph
is a living artifact. The main utility of this entire
concept mapping process is to generate formalized
thought on the best content and organization of the
course. This type of discussion will clearly lead to
debate and discussion. We observed this debate
particularly with pairs of instructors working together
to make a graph, which we consider positive. There
should be discussion when teaching a course together,
and participants noted that the discussion was more
clear and structured due to the graph. In the end of the
discussion, a decision must be made, and this is the
CSEDU 2018 - 10th International Conference on Computer Supported Education
116
time to remember that the graph is a living artifact.
Changes can and will happen in the classroom and
those changes can easily be reflected in later
iterations of the graph.
One specific concern worthy of note was raised in
regard to the level of abstraction (e.g., "How detailed
should the graph be?"). We established a rule of
thumb that if you have, or should have, distinct
assessment that relates to a proposed concept, that
concept should be its own node in the graph. If the
proposed concept is simple enough or too entwined
with other concepts to be assessed individually, then
it is not abstract enough to include as a node in the
graph. This is pragmatic, but is also directly tied to
the ITS which uses these graphs to offer support.
6 SUPPORT OFFERED
Now that there is an understanding of the underlying
data structure (the concept graph), and we see that the
creation process can be productive, we can discuss the
manner in which this structure is used to provide
automated support for students and teachers. The
system provides a direct view of the conceptual-level
assessment for students and teachers to better
understand their situation; suggested resources to
offer action items for students to improve; and
dynamic group suggestion to identify groups of
students that are potentially helpful to each other..
6.1 Knowledge Estimation
The system provides estimates of a student's
knowledge of each concept in the concept graph. To
perform this analysis, the system must have a concept
graph definition and connected assessments (as
described in section 4).
Thus far, student data are connected to the
resources in the graph, those resources are connected
to concepts, and those concepts are inter-connected in
a DAG. Our algorithm for making knowledge
estimates is a recursive bottom-up traversal of the
graph. Each node's estimate is a weighted average of
all the resources connected directly to that node,
along with recursive estimates of all other concepts
below that node. We should note that the weighted
average estimate can be easily replaced with more
sophisticated techniques as the system matures, but in
our first efforts we strive for simplicity to understand
precisely where added complexity will yield the most
benefit. These concept knowledge estimates can also
be aggregated for any group of students. Currently,
we only offer the end user the ability to look at a
single student or an average of the entire course.
Weights of specific assessments are set by the
instructor. A simple default scheme is to use the
proportion of that assessment as a part of the course
grade. Weights of any given node are currently
calculated as a sum of the weights of all assessments
and nodes connected to that node. This weighting
system is naïve in several ways (e.g., direct
assessment of a concept is weighted equally to
indirect assessment), but we chose to keep the
simplest algorithm possible to test functionality in
practical scenarios before deciding the manner in
which add complexity to the calculation.
The bottom-up algorithm gives no estimate for a
concept that has no data below it in the graph because
there is no direct evidence that a person has any
knowledge of this concept. However, we can also
perform top-down calculations, which we term
knowledge predictions. Predictions estimate your
ability to understand a lower level concept based on
your understanding of higher level concepts. As these
predictions are not based on direct evidence and have
not been vetted by experimentation yet, they are not
currently included in the visualization.
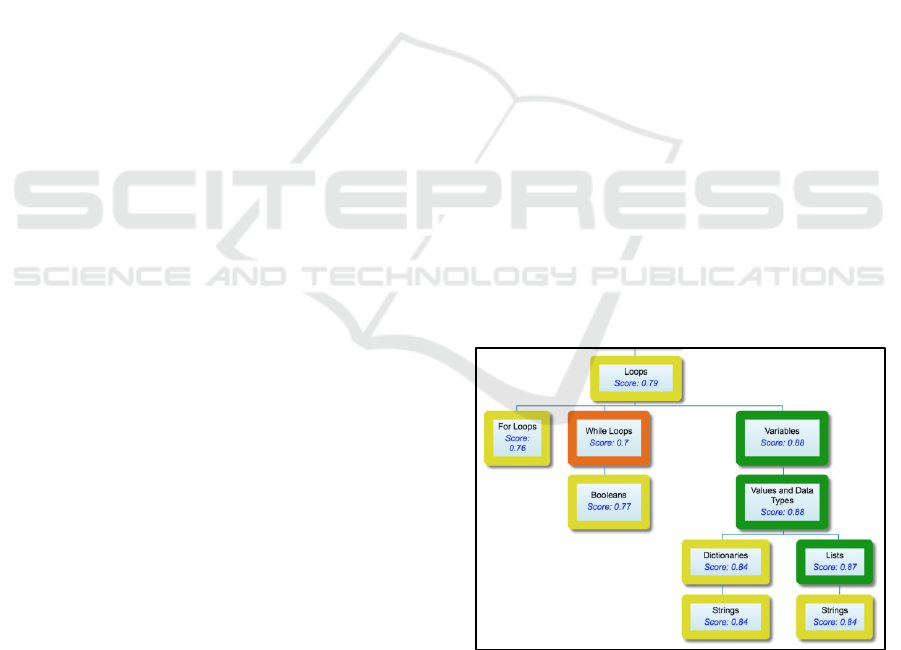
To visualize the concept graph and the knowledge
estimates for each concept, we present an html page
using google charts
8
, see Fig. 4. Each node displays
the knowledge estimate as a number between zero
and one, and is color coded to indicate areas of
concern. The color coding is adjustable by the
instructor's choice, but generally is based on set
values related to the course (e.g., A, B, C/D, F).
Figure 4: An example portion of the visualization of a
students' knowledge estimates as displayed by our system
for the introductory computer science course.
Clicking on a concept will display the resources
related to that concept, and if the resource is an
assessment, the score received on the assessment.
Improving Course Content While Creating Customized Assessment and Support at the Conceptual Level
117
Concept nodes in this display can be collapsed to hide
the lower-level nodes. It should be noted that the
google charts tool can only display tree structures and
so our graph is converted to a tree by making
duplicate nodes with the same titles and information.
This is not ideal, and a direct visualization of the
graph is an area of active research.
This visualization provides a quick artifact that
students or teachers can review in order to see
strengths and weaknesses at a conceptual level rather
than an assignment level. The ability to open and
close nodes and see associated resources also allows
students to explore the reason behind the knowledge
estimates. This type of display can be considered an
Open Learner Model (OLM), as it displays the
automated analysis to the student in order to allow
them to consider and reflect on their current state of
knowledge. OLMs have been demonstrated to have
positive effects on learning, even without offering
further feedback (Bull et al., 2010), and have shown
promise in closing the achievement gap (Mitrovic and
Martin, 2002). This specific visualization of color-
coded items has been demonstrated to allow users to
gain useful information in a brief interaction
(Mavrikis at al., 2016). Visualizing the average of all
students in a single graph is useful to instructors to
understand full class dynamics (e.g., that concept was
not covered well), and potentially also useful to
students for comparing themselves to an average of
their peers.
6.2 Resource Suggestion
In addition to visualizing the aggregate assessment,
the system uses these estimates to suggest resources
that should be useful to a student. We encode certain
pedagogical principles in order to automatically
suggest on which concepts students should focus, and
which resources are best to study the selected
concepts. In this way, the following suggestion
algorithm represents a pedagogical model (Woolf,
2010) because it controls the manner in which the ITS
uses the assessment to offer pedagogically-
meaningful recommendations.
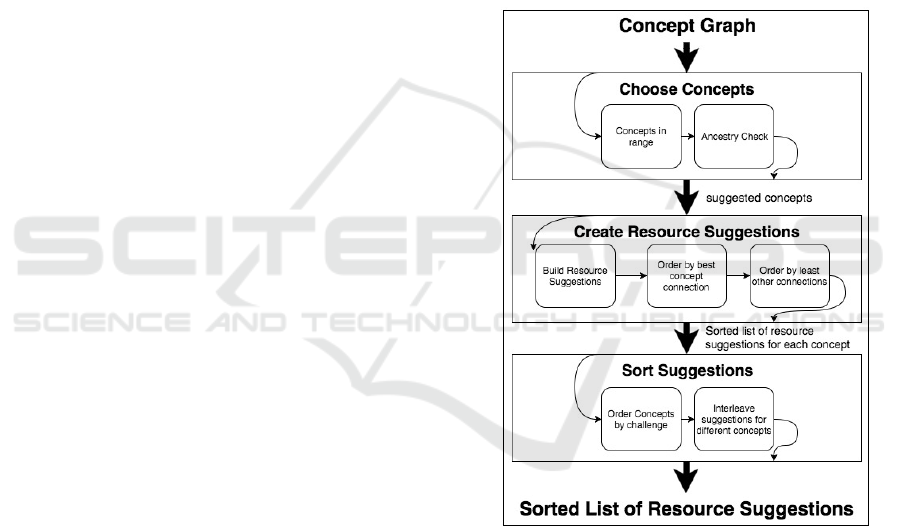
Fig. 5 represents the algorithm used to make
suggestions based on the concept graph. We now
explain each step in the process, and the pedagogical
rationale for each. Italics indicates steps that are
directly represented in the diagram.
Starting from the concept graph, the first step is to
identify a set of concepts on which the student should
focus. A common pedagogical theory based in
Vitgostky's theory of Zone of Proximal Development
(Chaiklin, 2003) is that we must choose topics that are
not already known, but also not too far beyond
student's current knowledge. To identify these
concepts, we choose the concepts in range from
yellow to orange, leaving out known concepts
(green), and potentially unreachable concepts (red).
The next step does an ancestry check in the graph to
ensure that if many related concepts might be
suggested, only the lowest level concepts are
included. This decision is based on the theory that we
should work on simpler concepts before the concepts
that build on them. From these steps of choosing
concepts, we have a specific set for which we now
need to find appropriate related resources to suggest.
The system also has a mode that allows users to
directly specify the concepts to study rather than
employing the algorithm for this step.
Figure 5: The algorithm for producing suggested resources
based on the concept graph structure and knowledge
estimates.
For each concept that has been identified as in
need, the system now identifies related resources. The
system builds resource suggestions for each concept
to link the suggested resource with the given concept.
This ensures the student receives information not only
about which resource they should study, but also why
they should study it (the important associated concept
that is a weakness for them specifically). For each
concept, all related resources are then sorted by
multiple criteria. The most important criteria is to find
CSEDU 2018 - 10th International Conference on Computer Supported Education
118

the resources most directly related to the concept at
hand. These could be resources directly connected
within the concept graph (strongest connections), or
they could be found by recursively exploring the
concept graph for indirect connections. We judge
indirect connections by counting the number of paths
from an indirect resource to the relevant concept.
Each path found represents one set of sub-concepts
that connect the resource to the concept. Many of
these paths indicate that a resource contains many
relevant sub-concepts of the desired concept. Using
this count of paths, resources are then ordered by best
concept connection, being direct and then strongest
indirect connections. In practice with sample data
from our work with real concept graphs (see section
4.2), we observed that many resources are equal by
this standard, and so to further sort the list, we find
resources with least other connections. This indicates
that a resource directly addresses the concept at hand,
and is not muddied by other concepts. This entire
process creates a sorted list of resource suggestions
related to each concept.
Considering this list of resource suggestions for
each concept, the system now chooses the ordering of
resources to be presented to the user. First, the system
chooses an ordering of concepts by challenge. The
system identifies knowledge estimates that are closest
to the center of the range of concepts to study. This
approach attempts to balance the need for concepts
that are the most likely to be necessary to study with
the need for concepts most likely for a student to be
ready to study. Finally, the system interleaves
suggestions for different concepts in the order of
concept priority, offering the best suggestion about
the top concept, followed by the best suggestion for
the second concept, etc. This decision is driven by the
theory that variety in educational materials is
beneficial, and also by pragmatism, in that the best
suggestions will appear first, rather than some sub-par
suggestions for the most important concept appearing
before the best suggestion for another important
topic.
Overall, this algorithm considers the
individualized knowledge estimates and utilizes the
concept graph structure to automatically create
intelligent suggestions for reflection and study. These
suggestions not only provide the user with the
resources, but also with the related concept that
should be the focus of their use of each suggested
resource. These suggestions are intuitively useful to
students, but instructors can use them as well. This
same algorithm can be applied to a graph containing
estimates for an entire class, and suggestions would
be relevant to the average student in the class,
representing good potential classroom exercises.
We note that the pedagogy encoded is debatable
and changeable. Further research in educational
theory could warrant changes, and use with real
classrooms will define our understanding of the
success/failure of this specific pedagogy. However,
the system source code is developed in a modular
fashion with clean software interfaces that allow for
alteration or multiple interchangeable pedagogical
models for experimentation.
6.3 Dynamic Group Suggestion
Similar to resource suggestions, we have defined an
algorithm for dynamic group selection based on the
concept graph and certain pedagogical principles
(Dragon et al., 2016). Automated group selection is a
challenging problem (Dillenbourg, 2002) that is
addressed by a large body of research, including the
fields of Computer Supported Collaborative Learning
(CSCL) and Computer Supported Cooperative Work
(CSCW). We are not seeking to replicate the large
body of work based on grouping students by traits or
roles. Rather, we seek to understand the effect of
basing groups on concept knowledge, similar to
techniques pioneered earlier (Greer et al., 1998;
Hoppe, 1995), but less explored in recent literature.
To more clearly define the task, the system is
designed to support groupings for short-term
interactions during a class period. Students will be
grouped differently each class period of group work.
Different principles would be important for other,
more long-term types of group work.
The system employs a generic grouping
mechanism by which different grouping methods can
be applied in any order. Fig. 6 offers a visualization
of the technique. Using this technique, any type of
grouping method can be applied in any order to allow
for experimentation.
Figure 6: The result of applying 3 different grouping
methods in our generic grouping system. Each consecutive
method will produce more groups with less students in each
group.
Considering specific grouping methods, the
system has can use the individual concept graphs for
Improving Course Content While Creating Customized Assessment and Support at the Conceptual Level
119

each student to make choices. Fig. 7 shows the
specific grouping methods currently implemented by
our system, and their ordering.
The algorithm takes the set of knowledge graphs,
and computes an overall knowledge estimate for each
one by finding the sum of all knowledge estimates in
the given graph. The system then uses this score to
divide the set of students into buckets. The number of
buckets is relative to the size of the class. For our
current class sizes of 20-30 students, we are using
three buckets, representing advanced, average, and
struggling students respectively. The theory behind
this step is to group students with similar abilities.
Our experience tells us that small groups with large
gaps in ability tend to devolve into advanced students
completing the work while struggling students
disengage.
Within these large subsets of students with similar
abilities, the system identifies common concepts that
are in need of improvement. The system builds a list
of the students most in need of work on each concept.
If a student is in need of multiple concepts, they are
grouped with the concept closest to the center of the
range of need, for the same reasons described in
section 4.2.
Figure 7: The algorithm for producing suggested groups
based on the concept graph structure knowledge estimates
of each student.
Finally, within these sub-sets of students with
similar abilities that need work on the same concepts,
we make the actual group suggestions (of 2-4
students). The system makes the final determination
of the best groups by examining the concept graphs
of the involved students. The system searches for sets
of students that have differences in knowledge
estimates of sub-concepts directly related to the
chosen concept. This identifies sets of students that
have a similar level of understanding of the concept
to study, but have differing levels of understanding of
the sub-concepts. Theoretically, this will bring
together sets of students that have complimentary
parts of the overall necessary knowledge for the
concept at hand.
Once the group and concept has been identified,
the system uses the suggestion algorithm from section
6.2 to also identify a list of potential resources with
which the group could be tasked.
By the third level of selection, the system is
looking for something very specific, which will likely
not be found for every group. However, the system
then defaults to simply grouping only by concept, or
finally grouping by ability. The worst case scenario is
that groups need to be made across buckets. We still
consider this acceptable because our basis for
comparison is a random grouping procedure currently
employed for these classroom activities.
Similar to the suggestion algorithm, this algorithm
is an initial attempt at a pedagogically–driven group
selection process. We will test this theory with
experimentation. We have currently also developed a
random group selection mechanism to provide a
control group for experimentation with this grouping
policy.
7 CONCLUSIONS AND FUTURE
WORK
We see great potential in this system, as it provides
personalized support to students and instructors while
allowing the instructors to define the organization and
bring together their own selection of materials for
their chosen courses.
We currently have six computer science courses
(>200 students enrolled) within our department that
have concept graphs defined and we are applying the
system with test groups. Specifically, we are
collecting usage experience for the graph
visualization and the suggested resources across a
diverse body of students, and we have specific
experimental plans to test the efficacy of the dynamic
group assignment algorithm as compared to random
assignment. Finally, instructors are regularly
revisiting and editing their concept graphs throughout
the semester and plan to make major revisions after a
semester of use. From these different applications of
the system, we intend to investigate the most
important question: is the system useful to real
instructors and students in real classroom scenarios?
We plan to first take a design-based research
approach to this question, where we learn from
interactions with students and rapidly adjust the
system accordingly while also noting the lessons
learned. However, we also plan more specific
experimentation with regard to research questions
such as: Are the visualizations and suggestions both
CSEDU 2018 - 10th International Conference on Computer Supported Education
120

equally useful? Is one preferable to the other? Are
they helpful to be presented together? Can predictions
be made accurately based on the graph? Does the
predication ability indicate anything about the quality
of the graph creation? Can we automatically
recognize issues and offer suggestion during the
graph creation process?
Further project goals include tighter integration
with external tools, particularly continuing work to
smooth the interaction for popular systems such as
Zybooks, Codio, and Runestone (all systems
potentially used by the classrooms where the software
is currently being applied). By furthering our
integration, we plan to harness the power of external
software that automatically assesses code exercises,
using this very complex assignment-specific
feedback to inform our higher-level conceptual
model.
REFERENCES
Almstrum, V. L., Henderson, P. B., Harvey, V., Heeren, C.,
Marion, W., Riedesel, C., ... & Tew, A. E. 2006, June.
Concept inventories in computer science for the topic
discrete mathematics. In ITiCSE-WGR '06. ACM, New
York, NY, USA, 132-145. DOI: 10.1145/1189215.
1189182.
Barnes, T., Boyer, K., Sharon, I., Hsiao, H., Le, N. T., &
Sosnovsky, S. 2017. Preface for the Special Issue on
AI-Supported Education in Computer Science.
International Journal of Artificial Intelligence in
Education, 27(1), 1-4.
Bull, Susan, and Judy Kay. 2010. "Open learner models."
Advances in intelligent tutoring systems: 301-322.
Butz, C. J., Hua, S., & Maguire, R. B. 2006. A web-based
bayesian intelligent tutoring system for computer
programming. Web Intelligence and Agent Systems,
4(1), 77-97.
Chaiklin, S. 2003. The zone of proximal development in
Vygotsky’s analysis of learning and instruction. In
Vygotsky’s educational theory in cultural context 1: 39-
64.
Dillenbourg, P. 2002. Over-scripting CSCL: The risks of
blending collaborative learning with instructional
design. In Three worlds of CSCL. Can we support
CSCL?, 61-91.
Dragon, T., Lindeman, C., Wormsley, C., & Lesnefsky, D.
2016. Better than Random: Can We Use Automated
Assessment to Form Productive Groups on the Fly? In
The Workshop on Intelligent Support for Learning in
Groups, 13th International Conference on Intelligent
Tutoring Systems, ITS-2016.
Edmondson, K. M. 1995. Concept mapping for the
development of medical curricula. In Journal of
Research in Science Teaching, 32(7), 777-793.
Greer, J. E., Mccalla, G., Collins, J. A., Kumar, V. S.,
Meagher, P., & Vassileva, J. 1998. Supporting peer
help and collaboration in distributed workplace
environments. International Journal of Artificial
Intelligence in Education (IJAIED), 9, 159-177.
Hoppe, H. U. 1995. The use of multiple student modeling
to parameterize group learning. In Proceedings of AI-
ED'95, 7th World Conference on Artificial Intelligence
in Education.
Kumar, A. N. (2006). Using Enhanced Concept Map for
Student Modeling in Programming Tutors. In FLAIRS
Conference (pp. 527-532).
Lin, Y. L., Brusilovsky, P., & He, D. 2011. Improving self-
organising information maps as navigational tools: a
semantic approach. Online Information Review, 35(3),
401-424.
Mavrikis, M. and Gutierrez-Santos, Sergio &
Poulovassilis, A. 2016. Design and evaluation of
teacher assistance tools for exploratory learning
environments. In Proceedings of the Sixth International
Conference on Learning Analytics & Knowledge
(LAK’16). ACM, pp. 168-172. ISBN 9781450341905.
Mitrovic, A. and Martin, B. Evaluating the Effects of Open
Student Models On Learning. In P. DeBra, P.
Brusilovsky and R. Conejo (eds.), Proceedings of
Adaptive Hypermedia and Adaptive Web-Based
Systems, Spring-Verlag, BerlinHeidelberg, 2002, 296-
305.
Murray, T. 2003. An Overview of Intelligent Tutoring
System Authoring Tools: Updated analysis of the state
of the art. In Authoring tools for advanced technology
learning environments (pp. 491-544). Springer
Netherlands.
Novak, J. D. 1990. Concept mapping: A useful tool for
science education. In Journal of research in science
teaching, 27(10), 937-949.
Sosnovsky, S., & Brusilovsky, P. 2015. Evaluation of topic-
based adaptation and student modeling in QuizGuide.
User Modeling and User-Adapted Interaction, 25(4),
371-424.
Starr, M. L., & Krajcik, J. S. 1990. Concept maps as a
heuristic for science curriculum development: Toward
improvement in process and product. In Journal of
research in science teaching, 27(10), 987-1000.
Woolf, B. P. 2010. Building intelligent interactive tutors:
Student-centered strategies for revolutionizing e-
learning. Morgan Kaufmann.
1
https://www.vitalsource.com/
2
http://interactivepython.org/runestone/default/user/login.
3
http://www.zybooks.com.
4
http://problets.org/
5
https://www.pearsonmylabandmastering.com/northameri
ca/myprogramminglab/
6
https://codio.com/
7
https://www.vocareum.com/
8
https://developers.google.com/chart/
Improving Course Content While Creating Customized Assessment and Support at the Conceptual Level
121
