Iterative Calibration of a Vehicle Camera using Traffic Signs Detected by
a Convolutional Neural Network
Alexander Hanel and Uwe Stilla
Photogrammetry and Remote Sensing, Technical University of Munich, Arcisstrasse 21, Munich, Germany
Keywords:
Advanced Driver Assistance Systems, Camera Calibration, Convolutional Neural Network, Image Processing.
Abstract:
Intrinsic camera parameters are estimated during calibration typically using special reference patterns. Me-
chanical and thermal effects might cause the parameters to change over time, requiring iterative calibration.
For vehicle cameras, reference information needed therefore has to be extracted from the scenario, as reference
patterns are not available on public streets. In this contribution, a method for iterative camera calibration using
scale references extracted from traffic signs is proposed. Traffic signs are detected in images recorded during
driving using a convolutional neural network. Multiple detections are reduced by mean shift clustering, before
the shape of each sign is fitted robustly with RANSAC. Unique image points along the shape contour together
with the metric size of the traffic sign are included iteratively in the bundle adjustment performed for camera
calibration. The neural network is trained and validated with over 50,000 images of traffic signs. The iterative
calibration is tested with an image sequence of an urban scenario showing traffic signs. The results show that
the estimated parameters vary in the first iterations, until they converge to stable values after several iterations.
The standard deviations are comparable to the initial calibration with a reference pattern.
1 CALIBRATION OF CAMERAS
FOR ADVANCED DRIVER
ASSISTANCE SYSTEMS
In recent years, an increasing number and capability
(figure 1) of advanced driver assistance systems per
vehicle can be observed (Shapiro, 2017), what is also
reflected by the continuously growing sales of needed
electronic control units in cars (AlixPartners, 2015).
For capturing the scenario in and around the car for
advanced driver assistance systems, different sensors
are used (Dempsey, 2016). Ultrasonic sensors in the
front and rear bumper can capture the close scenario
in front and behind the car to avoid collisions dur-
ing parking maneuvers. Radar sensors can be distin-
guished by their operating range. Cross traffic warn-
ings can be realized with a short-range radar system
with a range up to 30 m. A cruise control system
adapting the speed of the ego-car dependent on pre-
ceding cars is used typically in highways scenarios,
wherefore long-range radar systems with a range of
more than 200 m are suitable. Pedestrian detection
systems are typically used in urban scenarios with
moderate speeds driven, requiring medium-range sen-
sors like a LiDAR or a camera (Ors, 2017).
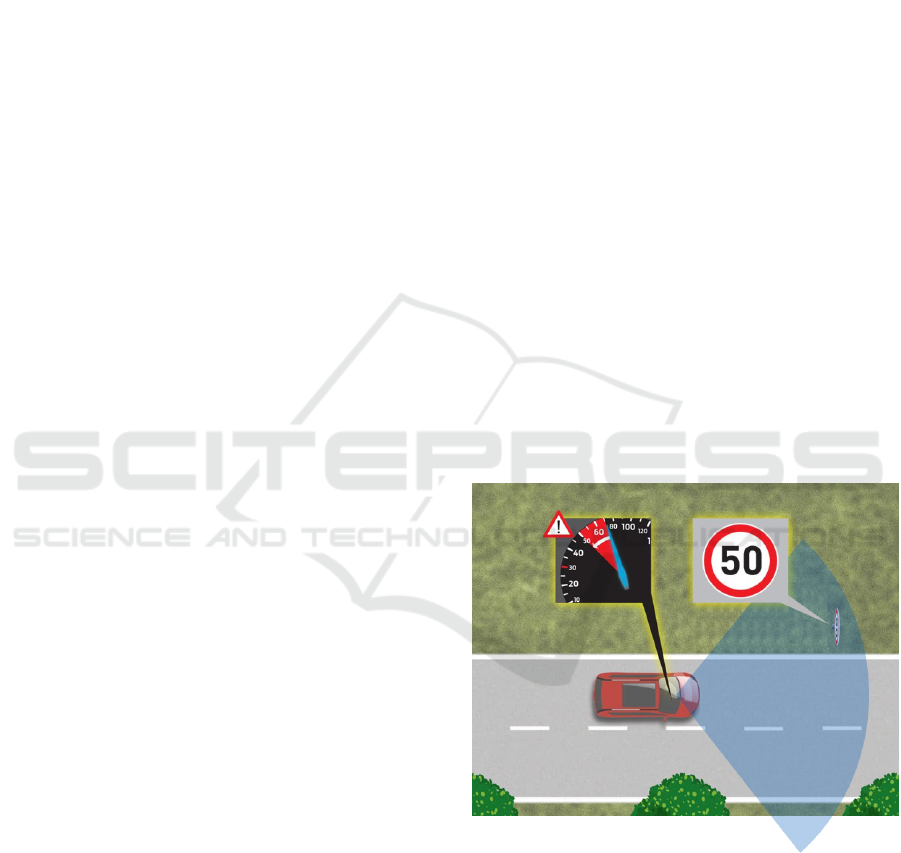
During development of a new car model, costs are
Figure 1: Traffic signs detected in images of a vehicle cam-
era (field of view in blue) can be used to warn the driver
against speed limits or other traffic regulations. These de-
tections can be also used to iteratively calibrate the camera
(Auto Body Professionals Club, 2017).
an important design factor regarding customer accep-
tance. As the type of sensors installed in a car in-
fluences the total costs of advanced driver assistance
systems, cameras with lower costs than for example
LiDAR or radar sensors (e.g. BMW 7 series parts
Hanel, A. and Stilla, U.
Iterative Calibration of a Vehicle Camera using Traffic Signs Detected by a Convolutional Neural Network.
DOI: 10.5220/0006711201870195
In Proceedings of the 4th International Conference on Vehicle Technology and Intelligent Transport Systems (VEHITS 2018), pages 187-195
ISBN: 978-989-758-293-6
Copyright
c
2019 by SCITEPRESS – Science and Technology Publications, Lda. All rights reserved
187

catalogue: (bmwfans.info, 2017)) are interesting to
consider. Images of an optical camera installed in a
car can be used for detections on the one hand and
for measurements on the other hand. Detecting a pre-
ceding car and measuring the relative distance to the
ego-car are application examples, respectively. The
accuracy and reliability of the measurements depend
on the quality of the sensor, in this case the optical
camera. For this purpose, a camera calibration can be
performed.
Several authors have already worked on the cal-
ibration of vehicular cameras recording the environ-
ment (Broggi et al., 2001) (Bellino et al., 2005)
(Ribeiro et al., 2006). Their works can be distin-
guished by the estimated parameters: either the es-
timation of the intrinsic parameters (e.g. (Heng et al.,
2013)) or the estimation of the extrinsic parameters
(e.g. (Friel et al., 2012)), typically relative to a vehic-
ular coordinate system (Hanel and Stilla, 2017). Their
works can also be distinguished based on the calibra-
tion method: either a calibration method using a spe-
cific calibration pattern in the acquired scene (Bellino
et al., 2005) (Hanel et al., 2016) or an auto-calibration
method without the need of a special calibration pat-
tern (Heng et al., 2013) (Bovyrin and Kozlov, 2017).
Basis for auto-calibration is in many cases the detec-
tion of road markings in images (Ribeiro et al., 2006)
(Paula et al., 2014) providing image points for camera
calibration. Typically, the road markings are shown in
the lower half of an image of a vehicle camera, mak-
ing it impossible to conclude on the distortions in the
upper image half. Furthermore, it can’t be assumed
that in all scenarios road markings are available, for
example on narrow roads or in parking garages. An-
other frequent type of objects in street scenarios are
traffic signs. In the field of view of a vehicular cam-
era, they are typically shown in the upper half of the
image. As well as for road markings, the shape and
size of traffic signs are standardized (e.g. (Depart-
ment of Transport - Ireland, 2010)), allowing to obtain
3d object coordinates corresponding to the extracted
image points for camera calibration.
When the car is being driven, a rough street sur-
face can cause vibrations in the car or the sun can heat
up its interior. Both mechanical and thermal effects
can influence the intrinsic parameters of cameras in-
stalled in the car over time (Dang et al., 2009) (Smith
and Cope, 2010). Therefore, it is recommended to
update the calibration parameters iteratively to have
valid parameter values for images recorded during
a longer drive. Especially scale information has a
strong influence on the estimated parameters (Luh-
mann et al., 2013). Therefore, in this contribution a
method to iteratively estimate the intrinsic parame-
ters using scale references extracted from images of
traffic signs using a convolutional neural network is
proposed.
The remainder of this paper is organized as fol-
lows: in section 2 the processing steps to extract the
scale references from images of traffic signs and to
perform the iterative camera calibration are described.
Section 3 shows the experimental setup and data used
to test the proposed method. In section 4 the results
of the camera calibration are described and discussed.
Section 5 concludes the paper.
2 INITIAL AND ITERATIVE
CAMERA CALIBRATION
This section is divided into two parts. In subsection
2.1, the process for initial camera calibration to obtain
initial intrinsic parameter values is described. This
step is designated to be performed before a vehicle
equipped with a camera is driven on public streets. In
subsection 2.2, the details of the method for extracting
scale references and including them into the iterative
camera calibration are shown. This step is designated
to be performed iteratively when and during the vehi-
cle is driven on public streets.
2.1 Initial Camera Calibration
Objective of the initial camera calibration is to pro-
vide estimates for the intrinsic parameters including
distortion parameters of the vehicle camera. A cen-
tral perspective camera model is used. According
to (Hastedt et al., 2016), a central perspective cam-
era model is valid also for wide-angle action cam-
eras, which are due to their low costs and small size
interesting for automotive use, if the manufacturer-
provided distortion correction has been applied to the
images. This correction reduces the largest part of
distortions in the image, so that only small parts re-
main, which can be modelled by a central perspective
camera model. Additionally, in the case of distortion-
corrected images, it is valid to use a planar calibration
pattern. As these authors have further reported diffi-
culties in estimating the decentering distortion param-
eters, they are not considered.
The estimated intrinsic parameters of the camera
are x
0
0
, y
0
0
as principal point, c
0
as focal length, and
three radial-symmetric distortion parameters accord-
ing to the model of Brown (Brown, 1971) (equations
1, 2):
x
dist,rad
= x · (1 + k
1
r
2
+ k
2
r
4
+ k
3
r
6
) (1)
y
dist,rad
= y · (1 + k
1
r
2
+ k
2
r
4
+ k
3
r
6
) (2)
VEHITS 2018 - 4th International Conference on Vehicle Technology and Intelligent Transport Systems
188

with x
dist,rad
, y
dist,rad
as distorted image coordinates,
x, y as undistorted image coordinates, r as radial dis-
tance of x, y from the principal point and k
1
, k
2
, k
3
as
radial distortion parameters.
The following well-known process for test field
calibration is used: Several images of a planar calibra-
tion pattern with photogrammetric marks are captured
from different camera positions, orientations and dis-
tances relative to the pattern plane. Image coordinates
of the photogrammetric marks are extracted with sub-
pixel accuracy from the images. 3d object coordi-
nates of the marks have been estimated previously
with high quality reference information. During a
bundle adjustment (Triggs et al., 2000), the residu-
als between the extracted image coordinates and the
image coordinates projected from the object coordi-
nates using estimates for the intrinsic parameters are
minimized.
2.2 Scale Reference Extraction and
Iterative Camera Calibration
This section describes the steps (figure 2) iteratively
repeated for each new image provided by a vehi-
cle camera. The first subsection 2.2.1 gives details
about the traffic sign detection and the second subsec-
tion 2.2.2 about the shape extraction of circular traffic
signs. The third subsection 2.2.3 describes how the
scale references are obtained in both image space and
object space. Finally, the fourth subsection 2.2.4 is
dedicated to the recalibration itself.
2.2.1 Traffic Sign Detection with a Deep
Convolutional Neural Network
Traffic sign detection is used to distinguish traffic
signs and other objects in images, like buildings, peo-
ple, vehicles. For the following processing steps, the
detection provides regions of interest (ROI) in the
image probably containing traffic signs. Recent ap-
proaches for traffic sign detection use deep learning
networks (e.g. (Zhu et al., 2016)), often with a con-
volutional network based on the well-known Lenet-5
net (Lecun et al., 1998), like proposed for example by
(Wu et al., 2013). In this contribution, the following
variation of the network proposed by these authors is
applied (figure 3). Input to the network is a candidate
for a ROI consisting of an image with a resolution
of 32 x 32 pixels and three colour channels. Those
ROI images are selected from an image pyramid (e.g.
showing a street scenario) using a sliding window ap-
proach. The first layer performs convolutions with
different kernels for feature extraction in combination
with a ”ReLu” activation function to ensure the non-
Figure 2: Processing steps performed for one iteration of
the iterative camera calibration. Input is a street scene im-
age recorded by a vehicle camera, whereof additional scale
references for the camera calibration are extracted. Output
are new estimates for the intrinsic parameters obtained by
bundle adjustment. A new iteration of these steps is per-
formed for each image captured over time when the vehicle
is on the road.
linearity property of the network, followed by max-
pooling for down-sampling as second layer. Another
max-pooling layer follows, to which dropout is ap-
plied to avoid overfitting. This layer is flattened and
followed by three fully connected layers. Thereby the
number of nodes is reduced stepwise to two output
neurons, one for the class traffic sign, the other for the
class no traffic sign. Softmax is used as loss function
to select one of these classes.
Depending on the step size of the sliding window
approach, one traffic sign can be detected multiple
times in the image pyramid in slightly shifted regions
of interest and with slightly different sizes. To avoid
the question which region of interest is the most ap-
propriate one for a shown traffic sign, the multiple de-
tections are reduced to one region of interest. There-
fore, mean shift clustering (Fukunaga and Hostetler,
1975) is applied to all detected regions of interest in
an image to find a cluster center for each shown traf-
fic sign. The size of the resulting region of interest
is the mean size of all regions of interest contributing
to this cluster. It is assumed, that the center of mass
Iterative Calibration of a Vehicle Camera using Traffic Signs Detected by a Convolutional Neural Network
189
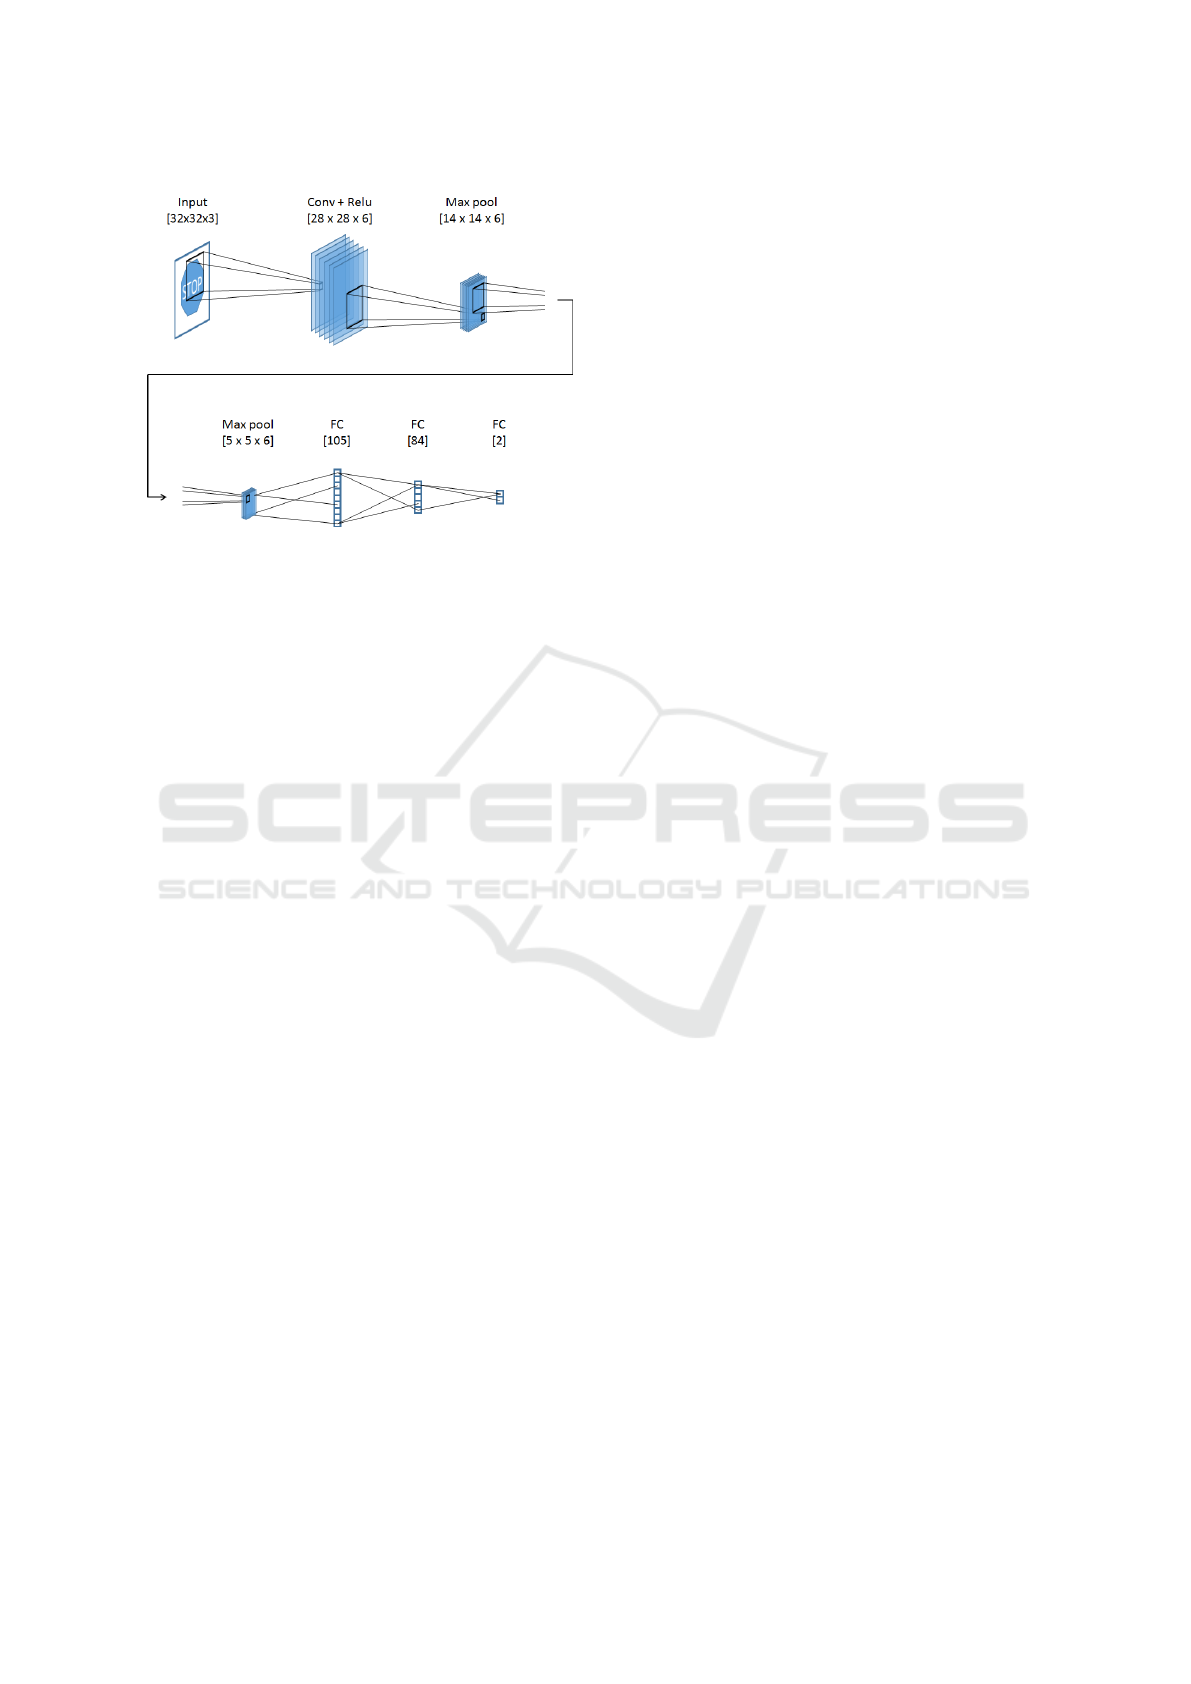
Figure 3: Architecture of the convolutional neural network
for traffic sign detection consisting of a convolutional layer,
two max-pooling layers and three fully-connected (FC) lay-
ers. Input is an image which is assigned to the class traffic
sign or no traffic sign.
of the multiple detections corresponds to the position
of a traffic sign in the image. Advantageous of mean
shift clustering is that the number of clusters has not
to be determined a-priori, being therefore capable to
assign clusters to several traffic signs in one image.
2.2.2 Traffic Sign Shape Extraction
The shape contour of a traffic sign shown in a region
of interest (subsection 2.2.1) has to be known to ex-
tract the image points of the reference information
needed for camera calibration. The shape is hereby
described by a geometric primitive. It is exploited,
that the geometric primitives used for traffic signs in
the real world are a-priori known and limited to a
small number, typically either a circle, a triangle or
a rectangle. In an image, those geometric primitives
can be seen by intensity differences between the traf-
fic sign itself and the image background. Further, the
algorithm described in the following is designed for
traffic signs with a perpendicular orientation to the
viewing direction of the camera, which is typical for
front-looking vehicular cameras. For a first investiga-
tion of the possibilities of the method proposed in this
paper, the shape extraction algorithm is limited to the
circle as the most common shape of traffic signs in the
public.
The algorithm fits an ellipse to the edge of the traf-
fic sign shape in an image. Thereby it is used that a
real-world circle is projected to an ellipse in an image.
It is assumed, that this projection is approximately
valid if only small image distortions remain from the
initial camera calibration. The algorithm obtains es-
timates for the ellipse parameters position, size and
orientation in the image. First, the grayscale image
of the region of interest is normalized to the complete
8-bit value range to increase the contrast of intensity
edges. Second, an absolute global threshold is applied
to create a binary image. Some of its intensity edges
between image parts with unique intensity are sup-
posed to follow the shape contour of the sign. Third,
groups of contour points belonging to the edges of
different parts are extracted from the binary image
(algorithm from (Suzuki and Abe, 1985)). Groups
with a small number of points are neglected, assuming
the edge of the traffic sign shape to be the dominant
contour in the image with a high number of contour
points. Fourth, the RANSAC algorithm (Fischler and
Bolles, 1981) selects iteratively the consensus set of
contour points belonging to the edge of the traffic sign
shape from the remaining groups. Therefore, ellipse
parameters are calculated with different sampled con-
tour points in each iteration and the set of all contour
points within a maximal distance to the ellipse is de-
termined. The largest set in all iterations is used as
consensus set. The number of iterations is chosen to
have at least one set of sample points without outliers
with a probability of 99 %. The final ellipse parame-
ters are estimated in a least-squares-adjustment using
the consensus set.
2.2.3 Extraction of Scale References from the
Traffic Sign Shape
Additional reference information to be used for cam-
era calibration has to be known in the image space
and the object space. From circular traffic signs, the
diameter of its shape can be used as scale reference.
In the object space, the diameter is known from gov-
ernmental regulations (e.g. (Department of Transport
- Ireland, 2010)). In the image space, the major axis
of the ellipse is perpendicular to the line of sight of
the camera and the distance between the ellipse ver-
tices of the major axis corresponds to the diameter of
the real-world circle of the traffic sign (Elder, 2017).
Therefore, the distance is used as diameter in the im-
age space.
Only the diameter of detections with a high output
probability of the neural network is used to lower the
risk to use wrong information from false positive de-
tections. Implausible ellipse parameters are removed
by a series of checks, e.g. whether the complete el-
lipse is contained in the region of interest.
To extract scale references it is sufficient, if a
traffic sign is being seen in two images, allowing to
determine the distance of the sign from the camera.
A structure-from-motion or SLAM approach can be
used for a 3d reconstruction of the environment shown
in the images and to derive the distance thereof.
VEHITS 2018 - 4th International Conference on Vehicle Technology and Intelligent Transport Systems
190
2.2.4 Iterative Recalibration of the Camera
The objective of the iterative recalibration is to esti-
mate the intrinsic parameters including distortion pa-
rameters for images recorded by the vehicle camera
when the car is driven. The parameter values are esti-
mated together with their standard deviations. A new
iteration of the recalibration is triggered, when addi-
tionally at least one scale reference is available from
new recorded images. For recalibration, the same
camera model and bundle adjustment as for the ini-
tial camera calibration are used (subsection 2.1). All
extracted scale references (see subsection 2.2.3) avail-
able in each iteration are added to the reference infor-
mation used already for the initial calibration and are
used by the bundle adjustment. The scale references
are modeled hereby in the bundle adjustment as dis-
tance condition, wherefore the image coordinates of
the end points of the distance and the metric length in
the object space is used.
3 DATASET AND EXPERIMENTS
The GTSRB dataset (Stallkamp et al., 2012) and
GTSDB (Houben et al., 2013) dataset are used
for training and validation of the neural network.
RGB images (further called ’cutouts’) of the GRSRB
dataset show a traffic sign in the center, surrounded
by a small border containing background objects. The
traffic signs are shown in different daylight illumina-
tion situations (e.g. sunny, shadowy) with a roughly
frontal view on them (examples see figure 4). 50,000
cutouts are used as samples for the class traffic sign.
The same number of samples for the class no traffic
sign are cutouts extracted from street scene images
of the GTSDB dataset showing arbitrary content (e.g.
buildings, vegetation, sky, ...). All samples have the
same geometric and radiometric resolution, they are
randomly shuffled, 80 % are used for training and 20
% for validation. The training is performed with a
learning rate of 0.001 and a dropout rate of 0.5. 80
epochs are trained, until there is no remarkable de-
crease in the loss anymore.
The iterative camera calibration is tested with an
image sequence extracted from a video recorded dur-
ing a five minute test drive through an underground
car park. The car park has in average one traffic sign
mounted at the wall every few meters, providing a
higher density than on public roads in average. The
camera used for recording is a wide-angle Garmin
VIRB Ultra 30 action camera (table 1). Following
the advices of (Hastedt et al., 2016) for a stable cali-
bration of action cameras, the manufacturer-provided
Figure 4: Examples of the GRSRB traffic sign dataset. Left:
Triangle-shaped construction warning sign in the shadow.
Right: Circle-shaped go straight sign in sunny light.
distortion correction of the camera is activated. In
each image, regions of interest for traffic signs are
obtained from the traffic sign detector, the multiple
detections are reduced. An ellipse is fitted to get the
shape of the traffic sign in each region of interest and
thereof the length of the major ellipse axis is derived
for camera calibration. The length is included in the
camera calibration as additional scale reference and
the calibration is performed for each image the length
can be derived from detected traffic signs.
Table 1: Technical specifications and video recording set-
tings of the action camera used to record the test video
(Pemble, 2017).
Camera Garmin VIRB Ultra 30
Lens 2.73 mm fix focal length
Geometric resolution 2,688 x 1,512 px
Temporal resolution 30 fps
Settings ISO 400, focus inf, f/2.6
The source code implementation of the proposed
method uses the programming library openCV (It-
seez, 2017) for image processing and tensorflow
(Abadi et al., 2015) for machine learning. The bundle
adjustment for camera calibration is performed with
the software Aicon 3D Studio (Schneider et al., 2014).
4 EXPERIMENTAL RESULTS
AND DISCUSSION
The training and validation of the neural network with
images of the GTSDB and GTSRB dataset gives an
overall accuracy of 95.9 % (table 2). Applied to the
images of the test drive through the underground car
park, multiple regions of interest are typically de-
tected around each traffic sign shown an image (figure
5). A high certainty threshold used for the detection
can decrease the number of multiple regions, but en-
sures a low false positive rate. Thereby the risk of
using detections not showing traffic signs and subse-
quently extracting wrong scale references is kept low.
The shape fitting algorithm can fit an ellipse with
Iterative Calibration of a Vehicle Camera using Traffic Signs Detected by a Convolutional Neural Network
191
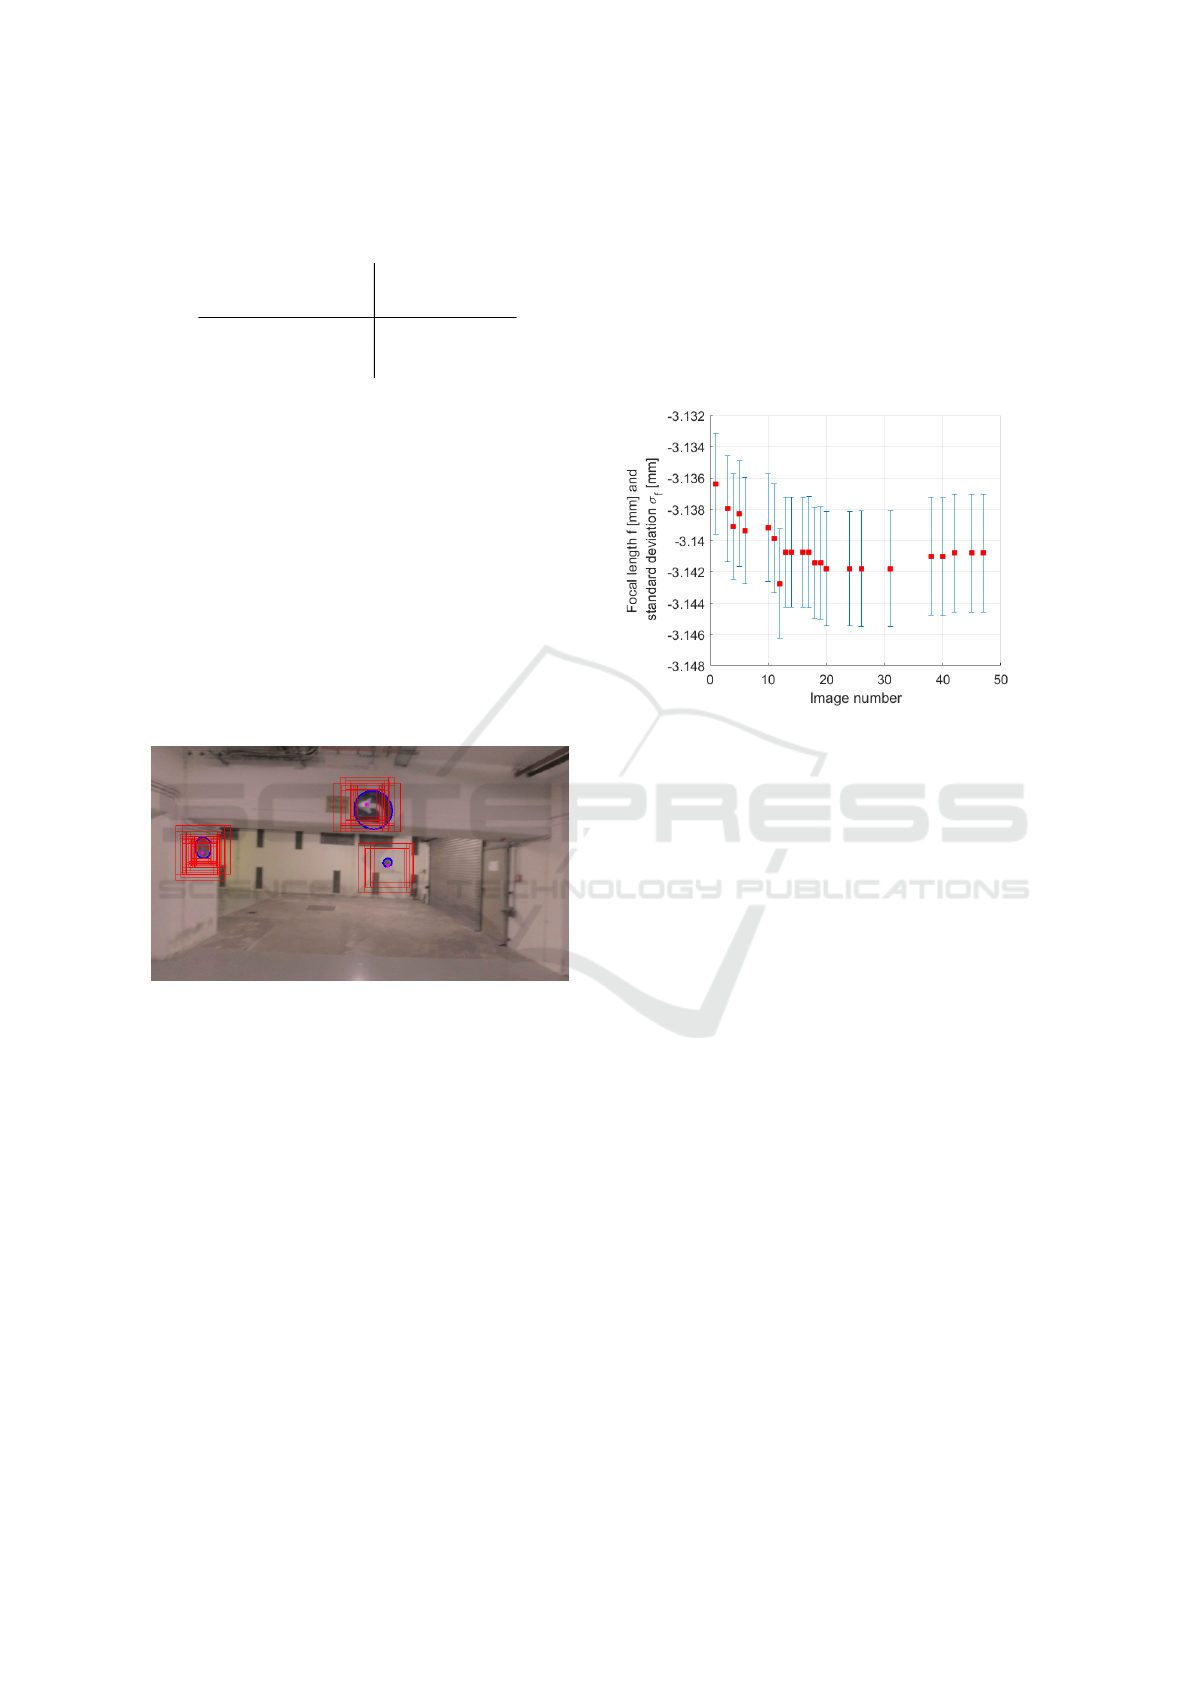
Table 2: Confusion matrix for the training and validation of
the convolutional neural network for traffic sign (TS) detec-
tion.
True class
TS No TS
Predicted
class
TS 96 % 4 %
No TS 4 % 96 %
a RMS error of in average 1 pixel between the fitted
ellipse and the inlier points selected as consensus set
by the RANSAC algorithm. Especially the extraction
of the contour points has the largest influence on the
RMS error. Contour points of partly occluded traffic
signs or of a background object with a dominant shape
near a traffic sign in the image might be included in
the consensus set leading to a decrease of the RMS
error value. Numerical analysis shows, that a shape
fitted to contour points not belonging to a traffic sign
can be recognized by a large RMS error value, which
is used to reject them from further processing. This is
especially the case, if a cluster center resulting from
the mean shift clustering lies not on or close to a traffic
sign in an image.
Figure 5: Example image of the test drive used to evalu-
ate iterative camera calibration. Multiple detected regions
of interest around each traffic sign (red rectangles) can be
reduced to one region of interest by mean-shift clustering
(pink dots). An ellipse is fitted to the edge of each traffic
sign shape to extract reference information for camera cali-
bration from the image (blue ellipses).
The intrinsic parameters can be estimated for
those images of the test image sequence, which pro-
vide additional scale references extracted from de-
tected traffic signs. The different estimated parame-
ters show a similar behaviour over time, it will be dis-
cussed in more detail in the following text for the fo-
cal length (figure 6), the principal point (figure 7) and
the radial distortion parameters (figure 8). Notable
is the value drift in the beginning of the image se-
quence until the parameters converge to a stable value
at the end of the image sequence. The drift might
result from a changing reference configuration used
for camera calibration from a planar reference pattern
used in the initial calibration to an increasing number
of scale references over time. The high number of de-
tected traffic signs in the first images of the sequence
might intensify the drift in this part of the image se-
quence. Though the drift in the focal length is clearly
visible in figure 6, the absolute value changes over
the whole image series are less than 1/100 millimeter,
which is approximately within the 1σ interval around
the estimated focal length values.
Figure 6: The focal length (red squares; converted from
pixels to millimeters given the pixel size) estimated during
iterative camera calibration for the images of a test drive
converges to a stable value at the end of the test image se-
quence. The standard deviations (blue bars) keep constant
over time. The calibration is performed for each image with
an additional scale reference available.
The stable values in the end of the sequence can
probably be explained that to the end of the sequence
the influence of the additional scale references on
the scale of the calibration configuration is dominant.
Also notable is the constant standard deviation of the
estimated parameters over time, what might be led
back to that the scale references still are only a small
part of the total reference information used for cam-
era calibration. Finally, the deviation of the estimated
focal length values from the technical specifications
(table 1) has to be mentioned. A reason might be, that
the value in the technical specification is related to the
full image sensor, while the recorded test video uses
a lower geometric resolution with a smaller field of
view to ensure a high number of frames per second,
ensuring only small differences in the content of con-
secutive images at higher vehicle speeds.
The x- and y-component of the principal point
vary over time within 1/1000 millimeter, with the
strongest variations again in the beginning of the im-
age sequence. The constant value of the standard de-
viation is remarkably lower than for the focal length,
what indicates that the principal point is estimated
more reliably than the focal length. These observa-
tions lead to the conclusion that the influence of the
VEHITS 2018 - 4th International Conference on Vehicle Technology and Intelligent Transport Systems
192
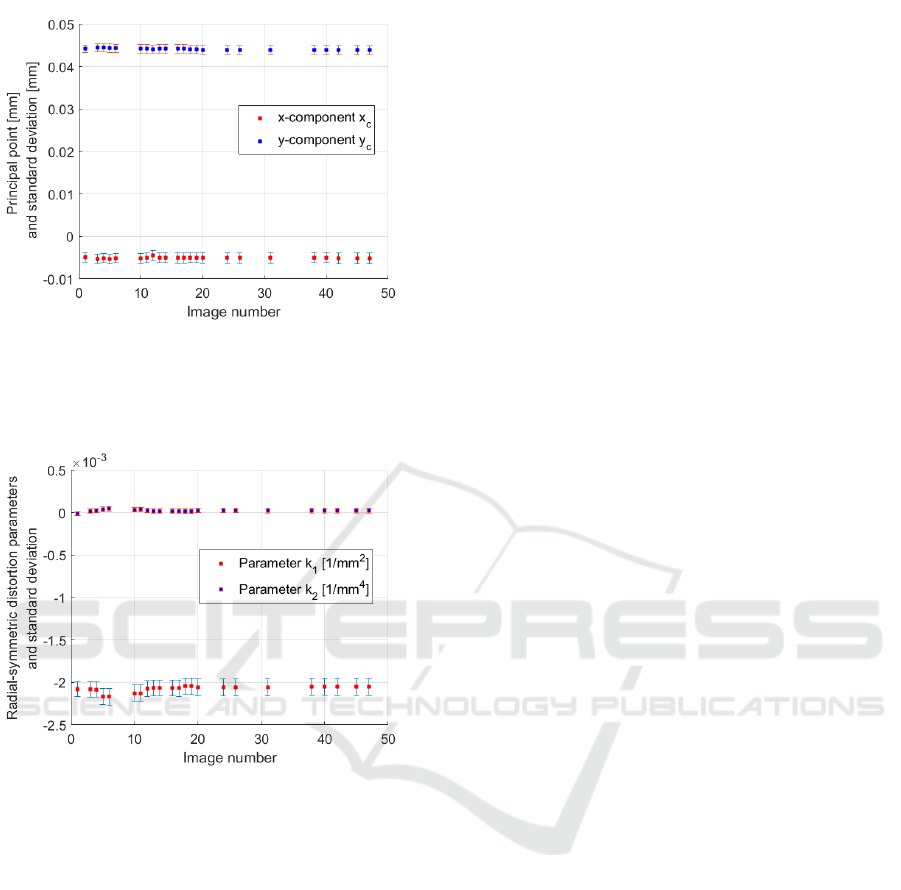
Figure 7: The principal point (red and blue squares) esti-
mated during iterative camera calibration converges as well
as the focal length (figure 6) to a stable value at the end of
the test image sequence. Its standard deviation (blue and
red bars) remains constant over time.
Figure 8: The radial-symmetric distortion parameters (red
and blue squares) estimated during iterative camera calibra-
tion converge to a stable value at the end of the test image
sequence, their standard deviations (blue and red bars) re-
main constant over time.
additional scale references is larger on the focal length
than on the principal point.
The relative value variations in the radial-
symmetric distortion parameters k
1
and k
2
in the be-
ginning of the sequence are larger than the variations
in the principal point. Furthermore, the standard de-
viations of k
1
are remarkably larger than the standard
deviations of k
2
. This observation might be explained
by the stronger influence of the additional scale ref-
erences on k
1
, as radial-symmetric distortions, which
are prevalently modelled by lower-order coefficients
k
i
in equations 1 and 2, can be interpreted as scale
change (Luhmann et al., 2013). The mentioned strong
influence of the scale references on the focal length
and k
1
is supported by the strong correlation between
these two parameters.
Overall, the results above show that the proposed
method can iteratively provide values for the intrinsic
parameters. Hence, allows to correct for changes in
these parameters occurring over time.
5 CONCLUSION
In this paper, a method for iterative camera calibration
using scale references extracted from images of traf-
fic signs has been proposed. It is shown, that traffic
signs can be detected and scale references extracted
iteratively for the images of a test image sequence
recorded in an urban scenario. While especially the
estimated values of the focal length and low-order
radial-distortion parameters change during the first it-
erations, the estimated values of all intrinsic param-
eters are stable after several iterations. The standard
deviations are at least one decimal power smaller than
the estimated values. The proposed method can there-
fore be seen as suitable to calibrate a vehicle cam-
era during driving. Regarding the estimation of dis-
tortion parameters valid for the whole camera image,
traffic signs typically shown in the upper image half
are the supplementary extension to road marks typ-
ically shown in the lower image half, which are al-
ready widely used for calibration.
One next logical step for the future is to enhance
the neural network to be able to recognize different
shapes of traffic signs, which could be used as a-priori
information for shape fitting. Consequently, the shape
extraction could be extended by rectangular and trian-
gular shapes, leading to more reference information
for camera calibration. Besides, reference informa-
tion from road markings can be integrated into the
proposed method. The spatial coherence of consecu-
tive images can be exploited by a tracking algorithm.
This allows to reduce false positive detections which
typically don’t occur in consecutive images.
REFERENCES
Abadi, M., Agarwal, A., Barham, P., Brevdo, E., Chen, Z.,
Citro, C., Corrado, G. S., Davis, A., Dean, J., Devin,
M., Ghemawat, S., Goodfellow, I., Harp, A., Irving,
G., Isard, M., Jia, Y., Jozefowicz, R., Kaiser, L., Kud-
lur, M., Levenberg, J., Man
´
e, D., Monga, R., Moore,
S., Murray, D., Olah, C., Schuster, M., Shlens, J.,
Steiner, B., Sutskever, I., Talwar, K., Tucker, P., Van-
houcke, V., Vasudevan, V., Vi
´
egas, F., Vinyals, O.,
Warden, P., Wattenberg, M., Wicke, M., Yu, Y., and
Zheng, X. (2015). TensorFlow: Large-scale machine
learning on heterogeneous systems. Software avail-
able from tensorflow.org.
Iterative Calibration of a Vehicle Camera using Traffic Signs Detected by a Convolutional Neural Network
193

AlixPartners (2015). Global adas unit production volume
from 2014 to 2021 (in 1,000 units). statista. (2017-09-
18).
Auto Body Professionals Club (2017). Im-
age. http://www.abpclub.co.uk/bodyshop-
news-images/Ford%20S-
MAX intelligent speed limiter2.jpg. Accessed
2017-09-26.
Bellino, M., Holzmann, F., Kolski, S., de Meneses, Y. L.,
and Jacot, J. (2005). Calibration of an embedded cam-
era for driver-assistant systems. In Proceedings. 2005
IEEE Intelligent Transportation Systems, 2005., pages
354–359.
bmwfans.info (2017). Bmw parts catalog. dis-
tance systems, cruise control bmw 750ix
g11. Website. http://bmwfans.info/parts-
catalog/G11/Europe/750iX-
N63R/browse/distance systems cruise control.
Accessed on 2017-10-29.
Bovyrin, A. and Kozlov, A. (2017). Real-time automatic
vehicle camera calibration.
Broggi, A., Bertozzi, M., and Fascioli, A. (2001). Self-
calibration of a stereo vision system for automotive
applications. In Proceedings of the 2001 IEEE In-
ternational Conference on Robotics and Automation,
volume 4, pages 3698–3703.
Brown, D. C. (1971). Close-range camera calibration. Pho-
togrammetric Engineering, 37(8):855–866.
Dang, T., Hoffmann, C., and Stiller, C. (2009). Continuous
stereo self-calibration by camera parameter tracking.
IEEE Transactions on image processing, 18(7):1536–
1550.
Dempsey, M. (2016). The next seat belt. how advanced
driver assistance systems will become mandatory and
could be the immediate opportunity in mobility. Web-
site. https://medium.com/frontier-tech/the-next-seat-
belt-60e980c3ea8b. Accessed on 2017-10-29.
Department of Transport - Ireland (2010). Traffic Signs
Manual.
Elder, J. (2017). Determining rotations be-
tween disc axis and line of sight. Website.
http://web.ncf.ca/aa456/scale/ellipse.html. Accessed
2017-10-29.
Fischler, M. A. and Bolles, R. C. (1981). Random sample
consensus: A paradigm for model fitting with appli-
cations to image analysis and automated cartography.
Commun. ACM, 24(6):381–395.
Friel, M., Savage, D. A., Hughes, C., and Ermilios, P.
(2012). Online vehicle camera calibration based on
road surface texture tracking and geometric proper-
ties.
Fukunaga, K. and Hostetler, L. (1975). The estimation of
the gradient of a density function, with applications in
pattern recognition. IEEE Transactions on Informa-
tion Theory, 21(1):32–40.
Hanel, A., Hoegner, L., and Stilla, U. (2016). Towards the
influence of a car windshield on depth calculation with
a stereo camera system. International Archives of the
Photogrammetry, Remote Sensing & Spatial Informa-
tion Sciences, 41.
Hanel, A. and Stilla, U. (2017). Structure-from-motion
for calibration of a vehicle camera system with non-
overlapping fields-of-view in an urban environment.
International Archives of the Photogrammetry, Re-
mote Sensing & Spatial Information Sciences, 42.
Hastedt, H., Ekkel, T., and Luhmann, T. (2016). Eval-
uation of the quality of action cameras with wide-
angle lenses in uav photogrammetry. In International
Archives of the Photogrammetry, Remote Sensing and
Spatial Information Sciences, volume XL-1/W4.
Heng, L., Li, B., and Pollefeys, M. (2013). Camodocal: Au-
tomatic intrinsic and extrinsic calibration of a rig with
multiple generic cameras and odometry. In IEEE/RSJ
International Conference on Intelligent Robots and
Systems (IROS), pages 1793–1800. IEEE.
Houben, S., Stallkamp, J., Salmen, J., Schlipsing, M., and
Igel, C. (2013). Detection of traffic signs in real-world
images: The German Traffic Sign Detection Bench-
mark. In International Joint Conference on Neural
Networks, number 1288.
Itseez (2017). Open source computer vision library.
https://github.com/itseez/opencv.
Lecun, Y., Bottou, L., Bengio, Y., and Haffner, P. (1998).
Gradient-based learning applied to document recogni-
tion. In Proceedings of the IEEE, volume 86, pages
2278–2324.
Luhmann, T., Robson, S., Kyle, S., and Boehm, J. (2013).
Close-range Photogrammetry and 3D Imaging. De
Gruyter textbook. De Gruyter.
Ors, A. O. (2017). Radar, camera, lidar
and v2x for autonomous cars. Website.
https://blog.nxp.com/automotive/radar-camera-and-
lidar-for-autonomous-cars. Access on 2017-10-29.
Paula, M. D., Jung, C., and Silveira, L. D. (2014). Au-
tomatic on-the-fly extrinsic camera calibration of on-
board vehicular cameras. Expert Systems with Appli-
cations: An International Journal, 41(4):1997–2007.
Pemble, C. A. (2017). Garmin VIRB Ul-
tra 30 Technical Specifications. Website,
http://www8.garmin.com/automotive/pdfs/VIRB-
Ultra30-specs.pdf. 2017-01-29.
Ribeiro, A. A. G. A., Dihl, L. L., and Jung, C. R. (2006).
Automatic camera calibration for driver assistance
systems. In Proceeedings of 13th International Con-
ference on Systems, Signals and Image Processing,
pages 173–176.
Schneider, C.-T., Boesemann, W., and Godding, R. (2014).
Aicon 3d systems gmbh.
Shapiro, D. (2017). Nvidia and bosch announce ai self-
driving car computer. the nvidia blog. (2017-09-18).
Smith, M. J. and Cope, E. (2010). The effects of tem-
perature variation on single-lens-reflex digital camera
calibration parameters. In International Archives of
Photogrammetry, Remote Sensing and Spatial Infor-
mation Science, volume XXXVIII, pages 554–559.
Stallkamp, J., Schlipsing, M., Salmen, J., and Igel, C.
(2012). Man vs. computer: Benchmarking machine
learning algorithms for traffic sign recognition. Neu-
ral Networks, 32(Supplement C):323–332. Selected
Papers from IJCNN 2011.
VEHITS 2018 - 4th International Conference on Vehicle Technology and Intelligent Transport Systems
194

Suzuki, S. and Abe, K. (1985). Topological structural anal-
ysis of digitized binary images by border following.
Computer Vision, Graphics, and Image Processing,
30(1):32–46.
Triggs, B., McLauchlan, P. F., Hartley, R. I., and Fitzgibbon,
A. W. (2000). Bundle adjustment - a modern synthe-
sis. In Proceedings of the International Workshop on
Vision Algorithms: Theory and Practice, ICCV ’99,
pages 298–372, London, UK, UK. Springer-Verlag.
Wu, Y., Liu, Y., Li, J., Liu, H., and Hu, X. (2013). Traf-
fic sign detection based on convolutional neural net-
works. In The 2013 International Joint Conference on
Neural Networks (IJCNN), pages 1–7.
Zhu, Z., Liang, D., Zhang, S., Huang, X., Li, B., and Hu, S.
(2016). Traffic-sign detection and classification in the
wild. In 2016 IEEE Conference on Computer Vision
and Pattern Recognition (CVPR), pages 2110–2118.
Iterative Calibration of a Vehicle Camera using Traffic Signs Detected by a Convolutional Neural Network
195
