
Discovery of Newsworthy Events in Twitter
Fernando Fradique Duarte, Óscar Mortágua Pereira and Rui L. Aguiar
Instituto
de Telecomunicações, DETI, University of Aveiro, 3810-193, Aveiro, Portugal
Keywords: Social Media, Twitter, Event Detection, SVM, Machine Learning, Dynamic Programming.
Abstract: The new communication paradigm established by Social Media, along with its growing popularity in recent
years contributed to attract an increasing interest by several research fields. One such research field is the
field of event detection in Social Media. The purpose of this work is to implement a system to detect
newsworthy events in Twitter. A similar system proposed in the literature is used as the base of this
implementation. For this purpose, a segmentation algorithm implemented using a dynamic programming
approach is proposed in order to split the tweets into segments. Wikipedia is then leveraged as an additional
factor in order to rank these segments. The top k segments in this ranking are then grouped together
according to their similarity using a variant of the Jarvis-Patrick clustering algorithm. The resulting
candidate events are filtered using an SVM model trained on annotated data, in order to retain only those
related to real-world newsworthy events. The implemented system was tested with three months of data,
representing a total of 4,770,636 tweets created in Portugal and mostly written in the Portuguese language.
The precision obtained by the system was 76.9 % with a recall of 41.6%.
1 INTRODUCTION
Social Media services have become a very popular
medium of communication and users use these
services for various different reasons. In the case of
Twitter, a microblogging service, the main reasons
found are (Java et al. 2007): daily chatter,
conversations, sharing information and reporting
news. Microblogging services in particular have
become very popular due to their portability,
immediacy and ease of use, allowing users to
respond and spread information more rapidly
(Atefeh & Khreich 2015).
The popularity and real time nature of these
services and the fact that the data generated reflect
aspects of real-world societies and are publicly
available have attracted the attention of researchers
in several fields (Madani et al. 2014; Nicolaos et al.
2016). One such field is the field of event detection
in Social Media.
Event detection in Social Media has many
potential applications, some of which with
significant social impact such as in the detection of
natural disasters and to identify and track diseases
and epidemics (Madani et al. 2014). Another
relevant application is in the detection of news
topics and events of interest or newsworthy, as real-
world events are often discussed by users in these
services before they are even reported in traditional
Media (Sakaki et al. 2010; Van Canneyt et al. 2014;
Papadopoulos et al. 2014).
These services however present some challenges,
some of which are inherit to their design and usage
(Atefeh & Khreich 2015). In the case of Twitter,
examples of this are the use of informal and
abbreviated words, the frequent occurrence of
spelling and grammatical errors and data sparseness
and lack of context due to the short length of the
messages. The diversity of the topics discussed,
some of which doubtfully of much interest (e.g.
daily chatter), may also pose additional challenges,
more specifically in the case of event detection. The
event detection process must therefore be able to
filter out these topics in order to retain only those
potentially related to events of interest.
The goal of this work is to implement a fully
functional system to detect newsworthy events using
tweets. By newsworthy event it is intended to mean
any real-world event of sufficient interest to the
general public in order to be reported in the Media.
To achieve this goal a similar system already
proposed in the literature, namely Twevent (C. Li et
al. 2012) is used as the base of the implementation.
This work also intends to empirically validate the
proposal of using Wikipedia as an additional factor
in the computation of the weighting scheme used to
244
Duarte, F., Mortágua Pereira, Ó. and Aguiar, R.
Discovery of Newsworthy Events in Twitter.
DOI: 10.5220/0006712702440252
In Proceedings of the 3rd International Conference on Internet of Things, Big Data and Security (IoTBDS 2018), pages 244-252
ISBN: 978-989-758-296-7
Copyright
c
2019 by SCITEPRESS – Science and Technology Publications, Lda. All rights reserved

rank the segments, relatively to the formulation used
in the base system. This change is proposed in an
attempt to favor segments according to their
potential newsworthiness, by further boosting them
up in the ranking relatively to more commonly used
and less informative segments.
The implementation is validated using three
months of data, corresponding to 4,770,636 tweets
created in Portugal and mostly written in the
Portuguese language.
The remainder of this paper is structured as
follows. Section 2 presents the related work. The
details concerning the implementation of the system
proposed are discussed next in Section 3. The results
obtained during the tests performed on the system
are presented in Section 4. The final conclusions and
future work are the topic of discussion of Section 5
and conclude the presentation of this work.
2 RELATED WORK
Event detection in Social Media has been the focus
of much research and many different approaches
have been proposed in order to solve this task.
TvPulse (Vilaça et al. 2015) aims to detect TV
highlights using Twitter and publicly available
Electronic Programming Guides (EPGs). To achieve
this, semantic profiles are created for the Portuguese
language and information related to the TV
programs is collected from EPGs and processed.
These semantic profiles are then used to identify the
most representative tweets as highlights of a TV
program.
Hotstream (Phuvipadawat & Murata 2010) aims
to collet, group, rank and track breaking news in
Twitter. For this purpose tweets are filtered by
hashtags (e.g. #breakingnews) or keywords (e.g.
breaking news) often used by users to annotate
breaking news. Tweets are then grouped together
according to a similarity measure computed using
TF-IDF along with a boost factor obtained via the
use of a Named Entity Recognizer (NER).
In (Popescu et al. 2011) a method is proposed to
automatically detect events involving known entities
from Twitter. A set of tweets created over a period
of time and referring the target entity is collected.
The Gradient Boosted Decision Trees framework is
then used to decide whether this snapshot describes
a central event involving the target entity or not.
Tedas (R. Li et al. 2012) is another Twitter based
event detection and analysis system that aims to
detect new events with a special focus on the
detection of Crime and Disaster related Events
(CDE). To achieve this, spatial and temporal meta
information is extracted from tweets and then
indexed by a text search engine. This index can then
be used to retrieve real time CDEs or answer
analytical queries.
More recently (Alsaedi et al. 2017) proposes an
event detection framework to detect large and
related smaller scale events, with a special focus on
the detection of disruptive events. A Naïve Bayes
classifier is used to filter out non-event related
tweets and retain only those associated with large-
scale events. An online clustering algorithm is then
used to cluster these tweets in order to obtain the
smaller-scale events. The topics discussed in these
clusters are then summarized and represented by
their most representative posts or their top terms.
Temporal Term Frequency–Inverse Document
Frequency is proposed in order to compute a
summary of these top terms.
Contrary to the systems just presented, the
system proposed in this work aims to detect all kinds
of events provided they are newsworthy and does
not target any specific entity or type of event.
More closely related to this work, Twevent (C.
Li et al. 2012) is proposed as a segment based event
detection framework. Tweets are first split into
segments (i.e. n-grams potentially representing
semantic units). These segments are then ranked and
the top K of these are grouped together according to
their similarity using a variant of the Jarvis-Patrick
clustering algorithm. The resulting candidate events
are filtered according to their newsworthiness scores
in order to retain only those considered to be related
to real-world events. Wikipedia is leveraged to
compute these scores and a user specified threshold
is used to derive the filtering decision.
The system implemented in this work proposes
Wikipedia as an additional factor in the computation
of the weighting scheme used to rank the segments
proposed in Twevent. This is done in order to boost
segments further up in the ranking according to their
potential newsworthiness and counter the possible
dominance of more common use ones due to their
greater user support. A trained Support Vector
Machine (SVM) model is also used to filter the
candidate events as opposed to using a user defined
threshold. By using such a model it is expected to
better capture the distinctive features that relate a
candidate event to a real-world newsworthy event
and therefore obtain better results in terms of
accuracy.
FRED (Qin et al. 2013) further expands Twevent
by considering three types of features representing
the statistical, social and textual information related
Discovery of Newsworthy Events in Twitter
245

to the candidate events obtained and then using these
features to train a SVM model to perform the
filtering step. This work uses a subset of these
proposed features.
3 SYSTEM IMPLEMENTATION
The purpose of this work is to implement an event
detection system using tweets to detect newsworthy
events. Such an event could be any real-world event
of sufficient interest to the general public in order to
be reported in the Media (e.g. newspapers, online
news). Sport (e.g. a football game), political (e.g.
elections) or musical events (e.g. summer concerts)
are examples of such events. The detection of these
events should be conducted independently in time
windows of fixed size (e.g. a day).
In terms of its architecture, depicted in Figure 1,
the system is comprised of three main blocks: the
Data Source Infrastructure (DSI), the Precomputed
Values Infrastructure (PVI) and the Event Detection
Pipeline (EDP).
The DSI is responsible for the pre-processing of
the dataset (i.e. the tweets) used to perform the event
detection as well as for its storage in an appropriate
format for later ease of access and retrieval.
The PVI is responsible for the computation and
storage of the precomputed values required by the
system so that they can be easily looked up later on.
These values are: the Segment Probabilities
(perform semantic meaningfulness lookups), the
Segment Frequency Probabilities (detect bursty
segments) and the Wikipedia Anchor Probabilities
(perform newsworthiness lookups).
The EDP is composed of four main components
named respectively: Tweet Segmentation, Event
Segment Detection, Event Segment Clustering and
Event Filtering. These components compose the
event detection pipeline used to detect events in each
time window t.
Table 1: Parameters of the system.
Parameter Description
S
t
The size of time window t
K The top-K tweet segments to retain
k k-nearest neighbors (Jarvis-Patrick)
S
m
The size of sub-time window t’
Finally, in terms of parameterization the system
requires four parameters listed in Table 1. The
blocks of the system are presented next.
3.1 Data Source Infrastructure
In terms of pre-processing of the dataset all user
mentions, links, hashtags and emoji were removed
from the text of the tweets. The text was also
normalized to lowercase and accentuation was
removed. Several statistics were also computed for
each tweet such as the number of links, user
mentions and hashtags present and also whether the
tweet was a reply or a retweet. MongoDB was used
to store these tweets in an appropriate format for
later ease of access and retrieval.
3.2 Event Detection Pipeline
This subsection presents the details concerning the
four main components that compose the event
detection pipeline of the system. Some details
however are left out of the discussion and can be
found in (C. Li et al. 2012) (the base system).
3.2.1 Tweet Segmentation Component
The goal of this component is to partition a tweet
into a set of non-overlapping and consecutive
segments (i.e. n-grams potentially representing
semantic units), the so called tweet segments. In
order to achieve this in an efficient way, a
segmentation algorithm was implemented using
dynamic programming. It should be noted that for
the purposes of this implementation only n-grams up
to order 3 that is n = {1, 2, 3} (i.e. unigrams,
bigrams and trigrams) where considered as possible
segment candidates.
This was achieved by first considering each of
the n-grams as a node and then linking these nodes
together by directed edges according to the position
in which they occur in the text, therefore composing
a Directed Acyclic Graph (DAG). An example of
this is depicted in Figure 2, where the tweet “my car
is fast” is shown, decomposed into all of its possible
n-grams.
More formally given a DAG G = (V, E) where V
denotes the set of vertices or nodes of the DAG and
E the set of its edges, two more special nodes named
start and end are defined and linked accordingly to
the other nodes, see Figure 2. The optimum
segmentation can be solved as the maximum cost
path search between the node start and the node end.
IoTBDS 2018 - 3rd International Conference on Internet of Things, Big Data and Security
246
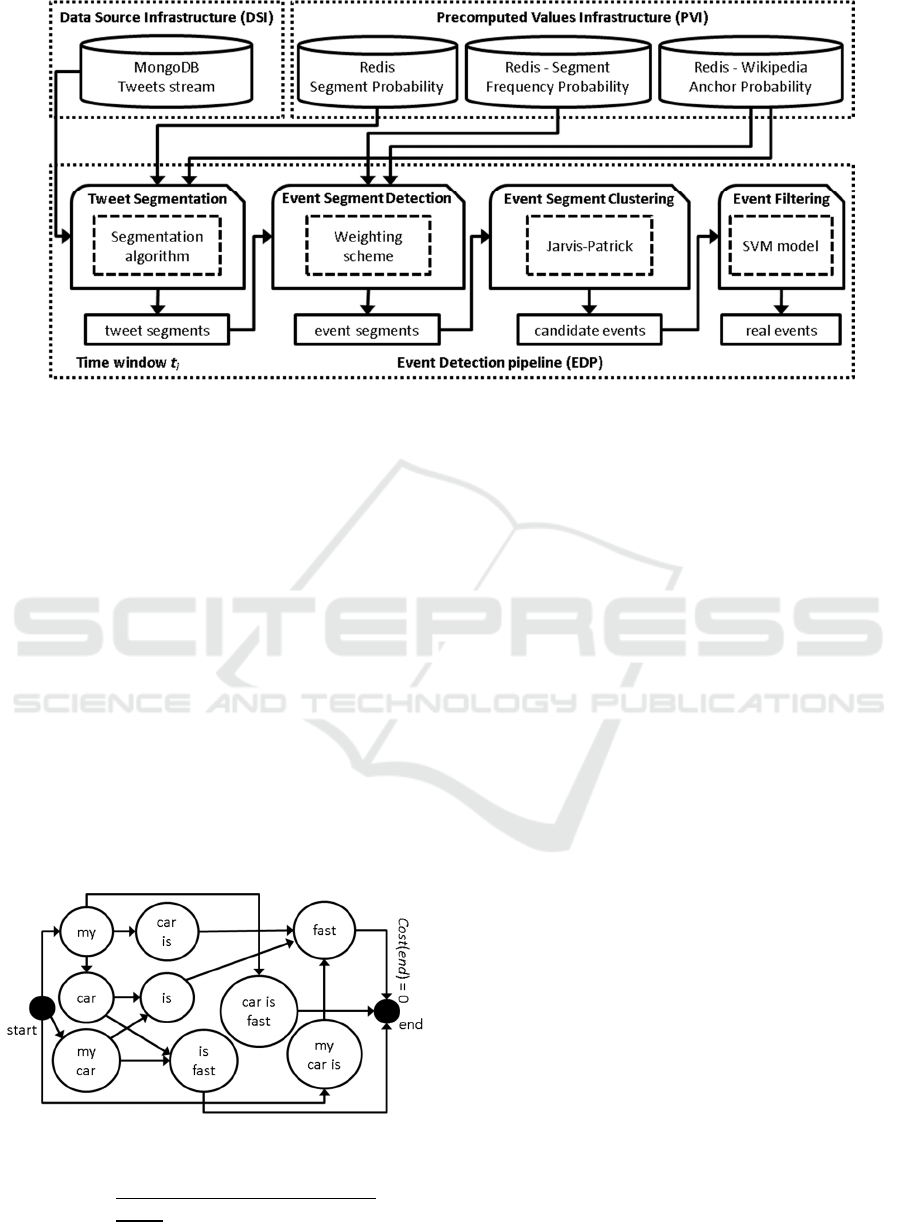
Figure 1: Architecture of the system.
The cost Cost(e
i
) of each directed edge e
i
∈ E
linking vertices u and v (i.e. u,v ∈ V) is calculated as
the value computed on its end node (v in this case)
using Equation 1, where
(
)
is a function used to
give moderate preference to longer segments,
(
)
is the probability that segment s appears as an
anchor text in the Wikipedia articles that contain it
(i.e. Wikipedia Anchor Probability) and SCP(s) is
the Symmetric Conditional Probability computed as
depicted in Equation 2 for n-grams with n > 1 and as
SCP(s) = () when n = 1. In Equation 2 ()
denotes the prior probability of segment s and
P(w
1
…w
k
) stands for the probability of segment
w
1…
w
k
. In the case of the special node end, the cost
of its incoming edges Cost(end) is set to zero. The
full details concerning these equations can be found
in (C. Li et al. 2012).
(
)
=
(
)
∗
(
)
∗
(
)
(1)
Figure 2: Representation of a tweet as a DAG.
(
)
=
(
)
1
1
∑
(
)
(
)
(2)
3.2.2 Event Segment Detection Component
The goal of this component is to rank the tweet
segments according to a weight scheme. This
ranking is then leveraged in order to select only the
top K, also called event segments, for further
processing.
In Twevent, the base system considered for the
implementation, this weight w
b
is computed for each
of the tweet segments according to Equation 3,
where P
b
(s,t) denotes the bursty probability of
segment s in time window t and u
s,t
denotes the user
support of that same segment (i.e. the number of
unique users that posted tweets containing segment s
in time window t). The full details concerning this
equation can be found in (C. Li et al. 2012).
(
,
)
=
(
,
)
∗log(
,
)
(3)
During the testing of the system using this
ranking scheme it was however detected that the
position of the segments in the rank seemed to be
mostly dominated by their user support as depicted
in Table 2, where the top 10 ranked segments for
two randomly chosen days are listed top down
according to their position in the rank (i.e. the first
element in the list is ranked 1, the second is ranked
2, and so on), along with the counts for their user
support (the columns on the right). Swear words
were elided from the listing and are denoted with the
* symbol instead.
As it can be seen in this table, the ranking
positions of the segments seem to follow the same
pattern for the two depicted days (i.e. segments with
a greater user support are ranked higher). The only
noticeable exception to this pattern occurs on the
Discovery of Newsworthy Events in Twitter
247

14
th
and is highlighted in bold. This is somewhat
expectable considering that commonly used words
are in general boosted by their usually greater user
support. Furthermore none of the segments listed is
of particular interest in terms of the information it
can potentially convey to the event detection
process.
Table 2: Top 10 ranked segments using the original
weighting scheme.
06-14-2015 06-24-2015
amanha 1750 es 1614
ver 1714 sei 1402
vai 1420 sempre 1388
dormir 1328 bue 1228
* 1186 melhor 1228
assim 1108 mim 1152
tempo 1055 acho 1118
exame 994
ti 1102
fds 979
aqui 1042
ta 1082
nunca 909
Considering that from these only the top K are
retained for further processing, this would mean that
many informative segments would be excluded from
further analysis in favor of more commonly used
ones. In terms of tweet analysis this can become
even more problematic as much of the topics
discussed are about personal and trivial matters
(heavy use of common words).
Wikipedia can be leveraged in order to attenuate
this issue. More specifically, segments are boosted
according to their Wikipedia anchor probability.
This means that segments appearing more often as
anchors (i.e. links to other articles) in Wikipedia and
therefore also more likely to be informative in terms
of event detection, will potentially be boosted up in
the rank. This in turn would somewhat counter the
apparent dominance of the user support already
discussed. The new proposed weighting scheme is
depicted in Equation 4, where Q(s) denotes the
Wikipedia anchor probability of segment s.
Table 3 presents the list of the top 10 ranked
segments computed for the same two days as before
using the revised weight scheme. As it can be seen
the top ranking no longer seems to be dominated by
the user support. Also, some of the segments listed
such as neymar (football player), brasil (country),
david luiz (football player) and meo arena (musical
festival) seem to be clearly more informative.
(
,
)
=
(
,
)
∗log(
,
)∗
(
)
(4)
Table 3: Top 10 ranked segments using the revised
weighting scheme.
06-14-2015 06-24-2015
neymar 247 ganda 310
brasil 305 sdds 191
portugal 516 ask.fm 17
david luiz 39 cristiano araujo 39
peru 76 es 1614
mase 128 bue 1228
colombia 59 sei 1402
meo arena 39 sempre 1388
portugues 230 bora 184
amanha 1750 melhor 1228
3.2.3 Event Segment Clustering Component
The goal of this component is to cluster related event
segments into candidate events. To compute these
candidate events, a variant of the Jarvis-Patrick
clustering algorithm, which takes only the k parameter
into account (i.e. the number of nearest neighbors to
examine for each point) was implemented.
This clustering algorithm was chosen because it
is a non-iterative algorithm and therefore more
efficient, as the clusters can be computed in a single
pass and also because it is deterministic, meaning
that the same results will be obtained every time.
The similarity measure used to cluster the event
segments was the same proposed in Equation 9 in
(C. Li et al. 2012).
3.2.4 Event Filtering Component
The goal of this component is to perform the final
filtering step in order to filter the candidate events
obtained in the previous step and from these retain
only those related to real-world newsworthy events,
also referred to as real events.
An SVM model was trained to perform this
filtering step as opposed to the use of a user defined
parameter (i.e. a threshold) as proposed in the base
system. This was done with the expectation that a
good set of representative features could be
leveraged in order to identify the real events. This
also means that less parameters must be setup in
order to parameterize the system.
The features used consist of a subset of the
features proposed in (Qin et al. 2013), namely: seg,
edge, wiki, sim, df, udf, rt, men, rep, url and tag.
These features are discussed in more detail in the
paper just mentioned. The importance of these
features was then assessed using a Random Forest
Classifier ensemble, see Figure 3. Three of these
features were found to be more discriminative then
IoTBDS 2018 - 3rd International Conference on Internet of Things, Big Data and Security
248
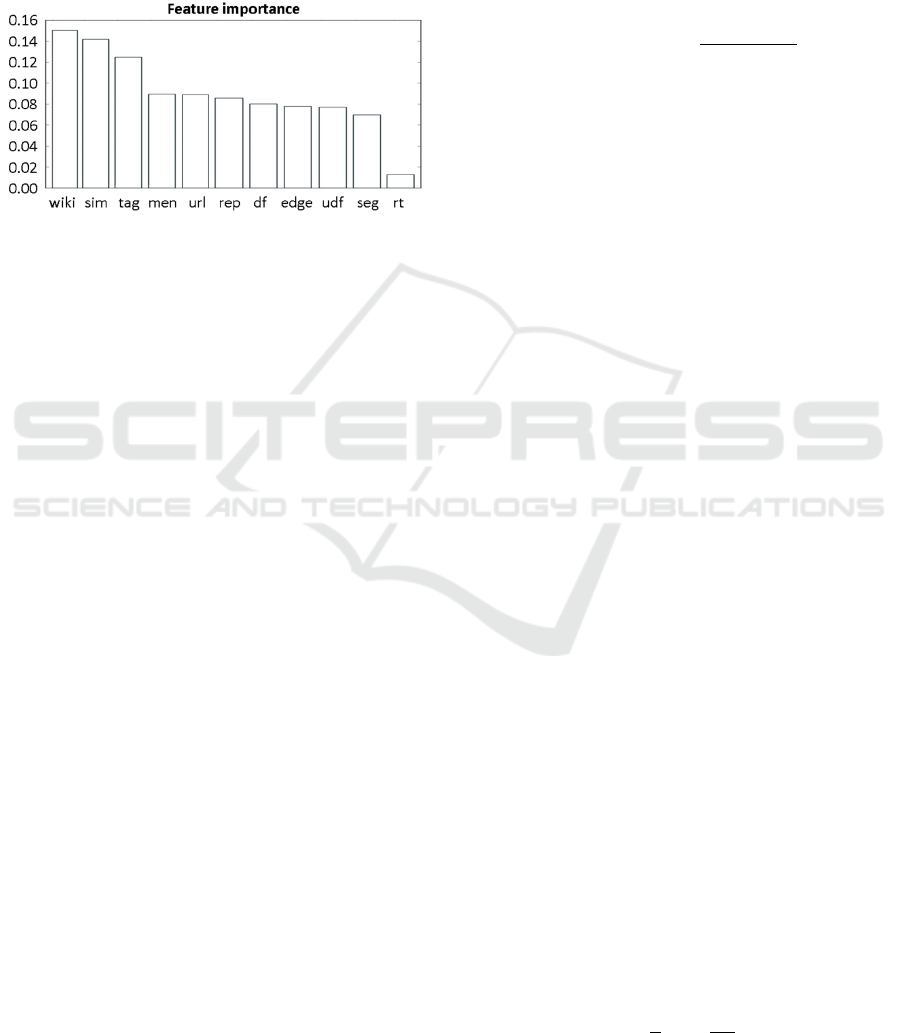
the rest, specifically and considering the candidate
event e with T
e
being the set of tweets containing
event segments of e: wiki (average newsworthiness
of e), sim (average similarity of the edges of e) and
tag (percentage of tweets that contain hashtags in
T
e
). The least discriminative feature found was rt
(percentage of tweets that are retweets in T
e
). All
features were used to train the SVM model.
Figure 3: Feature importance.
The hyper parameters of the model were then
tuned using Grid-Search and the resulting model was
trained using cross validation and tested. The best
model obtained was parameterized with the
following values: 'C': 100.0, 'gamma': 0.01 and
'kernel': 'rbf, and achieved a precision of 92% and a
recall of 65% (F1-score of 76%) for class 1 (the
class indicating e as being a real event. For the
purpose of comparison a Random Forest classifier
was also tested having achieved a precision of 80%
and a recall of 71% (F1-score of 75%) for class 1.
From the 1,427 samples comprising the training
dataset only 420 (336 randomly chosen samples for
class 0 and 84 samples for class 1) were used in
order to better balance the dataset and try to prevent
overfitting. These samples (candidate events) were
manually annotated. This annotation process is
discussed in further detail is Subsection 4.1.
3.3 Precomputed Values Infrastructure
This section discusses the setup of the infrastructure
used to manage the precomputed values required by
the system. These values were computed and stored
in a Redis database instance so that they could be
looked up later on in a fast and easy fashion. To
compute these values only n-grams up to order 3
(i.e. n ≤ 3) were considered.
3.3.1 Segment Probabilities
The segment probabilities, denoted by P(.) in
Equation 2 are used during the tweet segmentation
phase in order to try to obtain semantically meaning-
ful units. No online service provides these values for
the Portuguese language therefore the Maximum
Likelihood Estimate (MLE) was used to compute
these estimates as shown in Equation 5, where N
denotes the total number of words found in the
corpus (the set of tweets) and C(w
1
…w
n
) denotes the
counts of the n-gram w
1
…w
n
in that same corpus. In
total 9,152,120 n-grams along with their pre-
computed probabilities were stored.
(
…
)
=
(
…
)
(5)
3.3.2 Wikipedia Anchor Probabilities
The Wikipedia anchor probabilities, denoted as Q(s)
in Equation 1 and Equation 4 are used both during
the tweet segmentation and the event segment
detection phases to derive the newsworthiness of
segments. In order to compute these probabilities the
latest Portuguese Wikipedia dump (i.e. the ptwiki-
latest-pages-articles.xml.bz2, 21-Oct-2017) was used.
Only text contained inside anchor blocks
encoded as [[.]] in the dump file and excluding
images was considered as a potential anchor text
candidate. Redirect and disambiguation pages were
also left out and not processed. The longest form to
designate the anchors was always preferred (e.g. in
[[mm|millimeter]] millimeter was chosen). This was
done with the intuition that a longer text tends to be
more descriptive.
Finally only n-grams appearing more than once
as anchors were considered. This was done with the
expectation that more trivial topics rarely referred
and therefore of minor interest are less likely to be
used as anchors (i.e. links to other articles). In total
1,154,330 anchor designations were persisted.
3.3.3 Segment Frequency Probabilities
The segment frequency probabilities, denoted as p
s
and computed as shown in Equation 6 are used in
the event segment detection phase to detect bursty
segments and are specific to the implementation of
the base system. In the equation depicted N
t
denotes
the number of tweets created within time window t,
f
s,t
denotes the frequency of segment s within t (i.e.
the number of tweets created in t that contain s) and
L denotes the number of time windows t containing
segment s. In total 1,016,452 n-grams along with
their pre-computed probabilities were stored. Further
details concerning this equation can be found in (C.
Li et al. 2012).
=
1
∗
,
(6)
Discovery of Newsworthy Events in Twitter
249

4 TESTING
This section presents the tests performed to validate
the implemented system as well as the results
obtained.
4.1 Dataset and Experimental Setup
The dataset used to test the system was collected
from the Twitter Search API for the TVPulse project
(Vilaça et al. 2015) and consists of a set of tweets
created in Portugal and mostly written in the
Portuguese language. Two subsets of this dataset
were used: data collected from 07-01-2016 to 09-30-
2016 (4,770,636 tweets) were used to test the system
and compute the pre-computed values and data
collected from 05-14-2015 to 06-24-2015 (3,581,466
tweets) were used to tune, train and test the SVM
model. In terms of big international events these
periods were dominated by the 2016 Summer
Olympics, the UEFA EURO 2016 and the 2015
Copa America.
In terms of the annotation process, a total of
4,068 candidate events were manually annotated by
one of the authors (1,427 of these were used to tune,
train and test the SVM model and the remaining
2,641 were used to derive the precision and recall
results of the tests performed on the system). The
general annotation guideline followed was that a
candidate event should only be labeled as referring
to a real-world newsworthy event if most or all the
event segments describing it were related to that
event and the event was clearly newsworthy. In all
other cases it should be labeled otherwise.
The system was parameterized as follows: the
size S
t
of each time window t was fixed to be a
whole day, the size S
m
of the sub-time windows t’
was set to 2 hours and the values used for K and k
were √N
t
and 3 respectively. To perform the tests the
system was deployed in a guest environment running
Ubuntu 16.04 LTS with 2 allocated processor cores,
5 GB of RAM and 80 GB of disk. VMware Player
was used as the virtualization software.
4.2 Results
The results were obtained via the following
procedure: first the system was used in order to
compute the events for the testing periods
considered. Then both the candidate events
computed before and after the filtering step were
manually inspected and labeled as being related to
real-world newsworthy events or not. This was done
in order to obtain Me, the total number of candidate
events found by the system prior to the filtering step
and considered to be related to real-world
newsworthy events and also to calculate the number
of correct Te and incorrect Fe classifications
respectively concerning the real events obtained by
the system after the filtering step (i.e. the final
result).
These values were then used to derive the
precision and recall measures of the system as
shown in Equation 7 and Equation 8. Candidate
events considered to be related to the same real-
world event were counted independently in order to
simplify the process (i.e. two candidate events
related to the same real-world event count as two
correct classifications as opposed to just one). It
should be noted that concerning the computation of
the recall, M
e
serves as an approximation to the real
number of real events present in the dataset as this
number cannot be feasibly derived by manual
inspection of the whole dataset.
=
+
(7)
=
(8)
Table 4 lists these results for the periods tested,
where each column represents the following: TCE
(total candidate events) denotes the number of
candidate events computed prior to the filtering step,
MCE (Manual candidate events) denotes the number
of candidate events obtained prior to the filtering
step, found to be related to real-world newsworthy
events after manual inspection, FCE (filtered
candidate events) denotes the same as the MCE
column, with the exception that the candidate events
inspected were the ones obtained after the filtering
step and P (precision) and R (recall) are related to
the overall measures of performance of the system.
A total of 4,770,636 tweets were used to perform
the test. Table 5 presents some of the real events
identified by the system (the segments are separated
by commas).
In terms of the performance of the system
regarding processing time, depicted in Table 6, it
can be seen that the components presenting the
biggest bottleneck are the Event Segment Clustering
component (ESC) and the Tweet Segmentation
component (TS), taking in average 1.28 minutes and
1.03 minutes to compute respectively. The
remaining two components represent a residual
factor in this regard. The average processing time
per time window (53,229 tweets on average) was
2.32 minutes.
IoTBDS 2018 - 3rd International Conference on Internet of Things, Big Data and Security
250

Table 4: Results obtained during the tests.
Period TCE MCE FCE P% R%
07-2016 894 57 31 87 47.4
08-2016 961 50 22 72.7 32
09-2016 786 37 25 68 45.9
Total 2641 144 78 76.9 41.6
Table 5: Examples of real events identified.
ID Segments
e1 michael phelps, natacao,
phelps
2016 Olympic
Games
e2 sevilha, real madrid,
supertaca europeia, real,
madrid, penalty
UEFA Europa
League final
e3 telma monteiro, bronze,
telma, medalha de
bronze, medalha
2016 Olympic
Games, bronze
medal
e4 Benfica, golo, tobias
figueiredo, carrillo,
nacional, marca, Jonas,
marcar, raul jimenez,
jogador, jimenez
Football game
Table 6: Running average times of components.
Total TS ESD ESC EF
2.32 m 1.03 m .59 ms 1.28 m .033 ms
4.3 Discussion
In terms of the overall results obtained, as depicted
in Table 4, the system presents a somewhat
reasonable precision of 76.9% but a fairly low recall
of 41.6%. It can also be seen that these values vary
considerably amongst the different periods tested.
Some variation can also be observed regarding the
number of real events manually identified prior to
the filtering step (the values shown in the MCE
column), with a clear drop during the third period
tested, corresponding to September with 37 real
events identified.
Regarding the overall results obtained in terms of
precision and recall, several explanatory reasons can
be enumerated: 1) the features selected to train the
SVM model, may not be sufficient or representative
enough; 2) the training dataset used was still
somewhat imbalanced and this may have hindered
the learning of the model (there seems to be some
overfitting effect as the testing accuracy of 92%
obtained during the testing phase of the SVM model
is much higher than that obtained with new data,
76.9% in this case); 3) data annotation
inconsistencies during the manual labeling of the
training dataset may have also introduced unwanted
noise in the learning process; 4) the low quantity of
tweets collected overall for the periods tested may
have also affected the performance of the system, as
many tweets related to events may not have been
collected.
Concerning the differences observed in the
precision and recall results obtained for the different
periods tested, one possible reason may be due to
insufficient training data, as not all types of events
can be covered and these in turn may be
characterized differently in terms of the values of the
features of the respective candidate events obtained,
according to their impact or nature. As an example
of this the UEFA Champions League or even the
Copa America (the events dominating the SVM
training data) may be more related to the UEFA
EURO (July) event wise due to their similar nature
then to the Summer Olympics (August). This in turn
could explain the reason why July obtained the best
performance measures for both precision and recall.
With respect to the quality of the real events
obtained by the detection system, two remarks are
noteworthy: 1) the textual representation of these
events is composed in many cases of references to
entities such as people (e.g. michael phelps in e1),
events (e.g. supertaca europeia in e2) and football
clubs (e.g. real madrid in e2), that further help
describe and contextualize the event, see Table 5; 2)
some of these events present mixed events or several
words unrelated to the event identified (e.g. joao
souse, venezuela, caracas, tiago apolonia, estados
unidos, tenis de mesa, tenis, natacao, forte, joao, del
potro where at least two evens related to the 2016
Summer Olympic Games appear mixed together).
Lastly, Table 7 depicts how the results obtained
by the system implemented in this work can be
related to the results obtained by similar
implementations. Overall the system implemented in
this work detected much less real events, only 78,
when compared to the other two systems, achieved a
lower precision and a higher recall. Twevent did not
use a model to perform the filtering process and
therefore the recall value is not listed. This
comparison serves for the purposes of illustration
only, as the datasets used by the different systems
are not the same.
Finally it should be noted that similarly to
FRED, the features found to be more relevant in
training the SVM model were wiki, sim and tag.
Discovery of Newsworthy Events in Twitter
251

Table 7: Results of the various systems.
System #Evs P R N. Tweets
Twevent 101 86.1% -- 4,331,937
FRED 146 83.6% 22.9% 31,097,528
This
work
78 76.9% 41.6% 4,770,636
5 CONCLUSION
This work presented the implementation of an event
detection system to detect newsworthy events using
tweets. The implementation was based on a similar
system. Wikipedia was proposed as an additional
factor in the weighting scheme used to rank the
segments, in order to favor them according to their
potential newsworthiness. This proposal was
validated empirically. An SVM model was also used
in order to compute the real events. The
implemented system was tested on 4,770,636 tweets
mostly written in the Portuguese language. The
precision obtained was 76.9 % with a recall of
41.6%. In terms of comparison with similar systems,
the system implemented obtained lower precision
but higher recall.
Future work will focus on the assessment of the
real impact of the change proposed to the weighing
scheme used to rank the segments. Other alternatives
to SVM shall also be assessed with respect to their
applicability in performing the filtering step. Finally,
the results obtained in terms of precision and recall
shall also be further validated using data annotated
by independent annotators.
ACKNOWLEGMENTS
This work is funded by National Funds through
FCT - Fundação para a Ciência e a Tecnologia
under the project UID/EEA/50008/2013 and
SFRH/BD/109911/2015.
REFERENCES
Alsaedi, N., Burnap, P. & Rana, O., 2017. Can We Predict
a Riot? Disruptive Event Detection Using Twitter.
ACM Transactions on Internet Technology (TOIT) -
Special Issue on Advances in Social Computing and
Regular Papers, 17(2).
Atefeh, F. & Khreich, W., 2015. A Survey of Techniques
for Event Detection in Twitter. Computational
Intelligence, 31(1), pp.132–164.
Van Canneyt, S. et al., 2014. Detecting Newsworthy
Topics in Twitter. CEUR Workshop Proceedings,
Proceedings of the SNOW 2014 Data Challenge,
1150, pp.25–32.
Java, A. et al., 2007. Why We Twitter: Understanding
Microblogging Usage and Communities. In
Proceedings of the 9th WebKDD and 1st SNA-KDD
2007 Workshop on Web Mining and Social Network
Analysis. pp. 56–65.
Li, C., Sun, A. & Datta, A., 2012. Twevent: Segment-
based Event Detection from Tweets. In Proceedings of
the 21st ACM International Conference on
Information and Knowledge Management - CIKM ’12.
Maui, Hawaii, USA: ACM Press, pp. 155–164.
Li, R. et al., 2012. TEDAS: A Twitter Based Event
Detection and Analysis System. In ICDE ’12
Proceedings of the 2012 IEEE 28th International
Conference on Data Engineering. pp. 1273–1276.
Madani, A., Boussaid, O. & Zegour, D.E., 2014. What ’ s
Happening : A Survey of Tweets Event Detection. In
INNOV 2014 : The Third International Conference on
Communications, Computation, Networks and
Technologies. pp. 16–22.
Nicolaos, P., Ioannis, K. & Dimitrios, G., 2016. Detecting
Events in Online Social Networks: Definitions, Trends
and Challenges. In Solving Large Scale Learning
Tasks. Challenges and Algorithms. Lecture Notes in
Computer Science. Springer, Cham, pp. 42–84.
Papadopoulos, S., Corney, D. & Aiello, L.M., 2014.
SNOW 2014 Data Challenge: Assessing the
Performance of News Topic Detection Methods in
Social Media,
Phuvipadawat, S. & Murata, T., 2010. Breaking news
detection and tracking in Twitter. In 2010
IEEE/WIC/ACM International Conference on Web
Intelligence and Intelligent Agent Technology. pp.
120–123.
Popescu, A.-M., Pennacchiotti, M. & Paranjpe, D., 2011.
Extracting events and event descriptions from Twitter.
In WWW ’11 Proceedings of the 20th International
Conference companion on World Wide Web. pp. 105–
106.
Qin, Y. et al., 2013. Feature-Rich Segment-Based News
Event Detection on Twitter. In Sixth International
Joint Conference on Natural Language Processing.
Nagoya, Japan: Asian Federation of Natural Language
Processing, pp. 302–310.
Sakaki, T., Okazaki, M. & Matsuo, Y., 2010. Earthquake
Shakes Twitter Users: Real-time Event Detection by
Social Sensors. In Proceedings of the 19th
International Conference on World Wide Web. pp.
851–860.
Vilaça, A., Antunes, M. & Gomes, D.G., 2015. TVPulse:
detecting TV highlights in Social Networks. In 10th
Conference on Telecommunications Conftele.
IoTBDS 2018 - 3rd International Conference on Internet of Things, Big Data and Security
252
