
Infrared Microscopic Imaging Analysis
Anselmo Jara, Guillermo Machuca, Sergio Torres and Pablo Gutiérrez
Departamento de Ingeniería Eléctrica, Universidad de Concepción, Casilla 160-C, Concepción, Chile
Keywords: Image Formation, Acquisition Devices and Sensors, Image Enhancement and Restoration.
Abstract: In this paper, we present imaging processing advances and applications of mid-wavelength infrared
(MWIR) microscopy imaging. Practical issues related to imaging acquisition, image nonuniformity
correction, infrared image quality assessment, and even the MWIR microscope optical Point Spread
Function experimental estimation are discussed. The built-up MWIR microscope imaging system allows us
to analyse thermal features near to the system diffraction limit, up to 200 frames per second and to focus on
less than 2 mm
2
area. On basis of this technology, our group has been focused efforts in exothermal
biological processes, achieving the results exposed in this paper.
1 INTRODUCTION
Infrared (IR) imaging systems enable users to
determine the thermal spatial distribution of a target
object in a non-invasive manner, and furthermore,
without requiring any physical contact between the
target and the imaging system. IR imaging sensors
are based on the Infrared Focal Plane Array (IRFPA)
technology that consists of a mosaic of independent
photo-detectors placed at the focal plane of an
imaging system (D. A. Scribner et al., 1991).
Every image acquisition system can be
considered as a cascade formed set-up, which is
mainly composed by a physic interface and an
electronic interface. The physic interface is used to
focus the irradiance on the IRFPA, even more, in
such unit, the image is magnified by an array of
lenses. The electronic interface collects the
irradiance by means of an IRFPA located exactly in
the Focal Plane, to filter and digitalize the electric
data as a raw image output data.
Nevertheless, the detectors in the array has
unequal responses under a homogeneous stimulus,
which leads to the presence of a Fixed Pattern Noise
(FPN) noise, well known as Non-uniformity (NU)
noise, on the resulting images. Furthermore the lens
aberrations effect causes a spatial degradation
namely blurring (V. N.Mahajan., 1998). Thus, NU
noise and blurring degrade image quality and lead to
major difficulties in MWIR microscopic imaging
analysis for all kinds of applications.
In the literature, scene-based techniques perform
the NU correction (NUC), using only the video
sequences that are being imaged, not requiring any
kind of laboratory calibration technique (P. M.
Narendra., 1980, S. N. Torres and M. M. Hayat,
2003, E. Vera et al., 2011). However in blurring
correction, the problem needs to characterize the
optical array in order to inversely solve the image
degradation. Several deconvolutive methods have
been developed to allow the best image restoration
(N. Wiener, 1949, W. H. Richardson, 1972, L B.
Lucy, 1974).
Our research group is currently working: in
MWIR microscopic imaging applications (mainly to
exothermal biological processes). Particularly, on
MWIR video signal analysis (NUC and de-blurred
algorithms and IR imaging performance metrics),
and on MWIR microscopic parameters (Diffraction
Limit, Instantaneous Field Of View, point spread
function (PSF)). Here we present, some of our most
recently results.
This paper is structured as follows. In Section 2,
we describe the microscopy instrumentation and IR
microscopy imaging features are exposed. In Section
3 an experimental PSF estimation method from the
IR microscope system is sumarized. In Section 4, we
tested an algorithm to correct simultaneously the NU
noise and blurring artifacts. To evaluate the
technique performance, a novel metric is computed
in Section 5. Finally, in Section 6 we present the
conclusions and future research.
Jara, A., Machuca, G., Torres, S. and Gutiérrez, P.
Infrared Microscopic Imaging Analysis.
DOI: 10.5220/0006716702130218
In Proceedings of the 13th International Joint Conference on Computer Vision, Imaging and Computer Graphics Theory and Applications (VISIGRAPP 2018) - Volume 4: VISAPP, pages
213-218
ISBN: 978-989-758-290-5
Copyright © 2018 by SCITEPRESS – Science and Technology Publications, Lda. All rights reserved
213
2 IR MICROSCOPY
PARAMETERS AND IMAGING
SYSTEM FEATURES
2.1 IR Microscopy Parameters
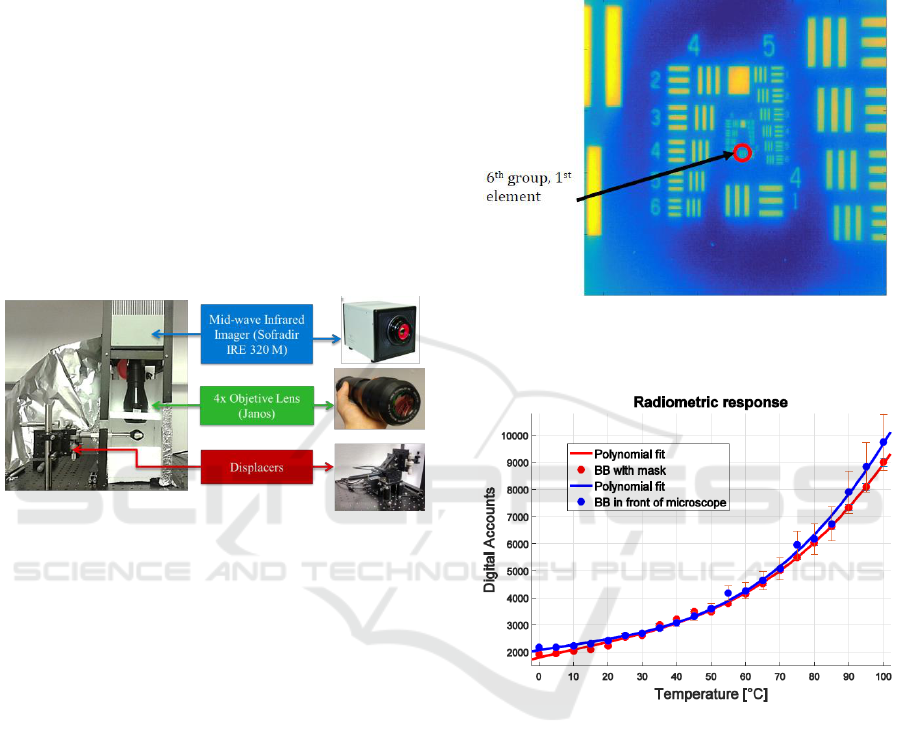
The built-in IR microscope unit is composed of a
MWIR camera (Sofradir model EC-IRE 320M)
shown in Figure 1, with a HgCdTe FPA transducer
that has a spectral response between 3.7 and 4.8
micrometers. The FPA is composed by an array of
320x256 IR detectors, with a 14-bit analog/digital
converter with a noise-equivalent temperature
difference (NETD) of 10 mK. The FPA can operate
up to 320 frames per second. The optical system (IR
objective) is integrated by an array of lenses from
Janos Technology, allowing a 4X magnification.
Figure 1: Mid-wave infrared microscope system utilized to
acquire microscopic thermal maps.
2.2 System Characterization
The first work was to find the optical system IFoV.
For this, images of the USAF Target, were acquired,
as shown in Figure 2. The 6th element of 1 group
bars was chosen. The length of the bars is known, so
that IFoV can be found by dividing the length of
said bar by the number of pixels that occupy this
object in the image. The second method described in
this work is about how to find the diffraction limit.
For this purpose, the USAF Target was also used
using the Rayleigh criterion (Hecht. 2002) to find
the smallest element that can be solved by the
Microscope. According to our experiments, such a
microscope permits to integrate IR exothermal
process with images contained in a 1.99x1.49 mm
scene area, with an approximate diffraction limit of
12, 4[µm].
Finally, next performed work corresponds to the
determination of a radiometric response curve
(temperature). For this, several procedures were
employed, giving the best result, the method in
which the microscope was located directly in front
of the black body. Video sequences of 10 frames
from the black body were taken at different
temperatures, from 0 to 100 [
o
C] with intervals of 5
[
o
C] at a controlled ambient temperature of 17 [
o
C].
The results are shown in the Figure 3.
Figure 2: USAF 1951 Target used for the diffraction limit
determination. 6th group and 1st element are indicated,
last to be solved.
Figure 3: Radiometric response curve using different
methods.
3 POINT SPREAD FUNCTION
In this work the applied mathematical foundation for
the MWIR microscope PSF estimation, is based on
the experimental method proposed in (K.
Rossmann., 1969). Where it is assumed that the
optical system PSF is isotropic and separable, so it
can be computed from the combination of the
estimated line PSFs in the x and y axes separately,
and
, respectively. Each line PSF can be
estimated as the derivative of a sharp transition step
function in the desired direction of the scene as
follow
VISAPP 2018 - International Conference on Computer Vision Theory and Applications
214
(1)
where is the intensity value of the scene
background and
,
are the step’s derivative
with respect to and direction respectively. These
results are obtained by also assuming that the
acquisition setup is a linear and shift-invariant
system.
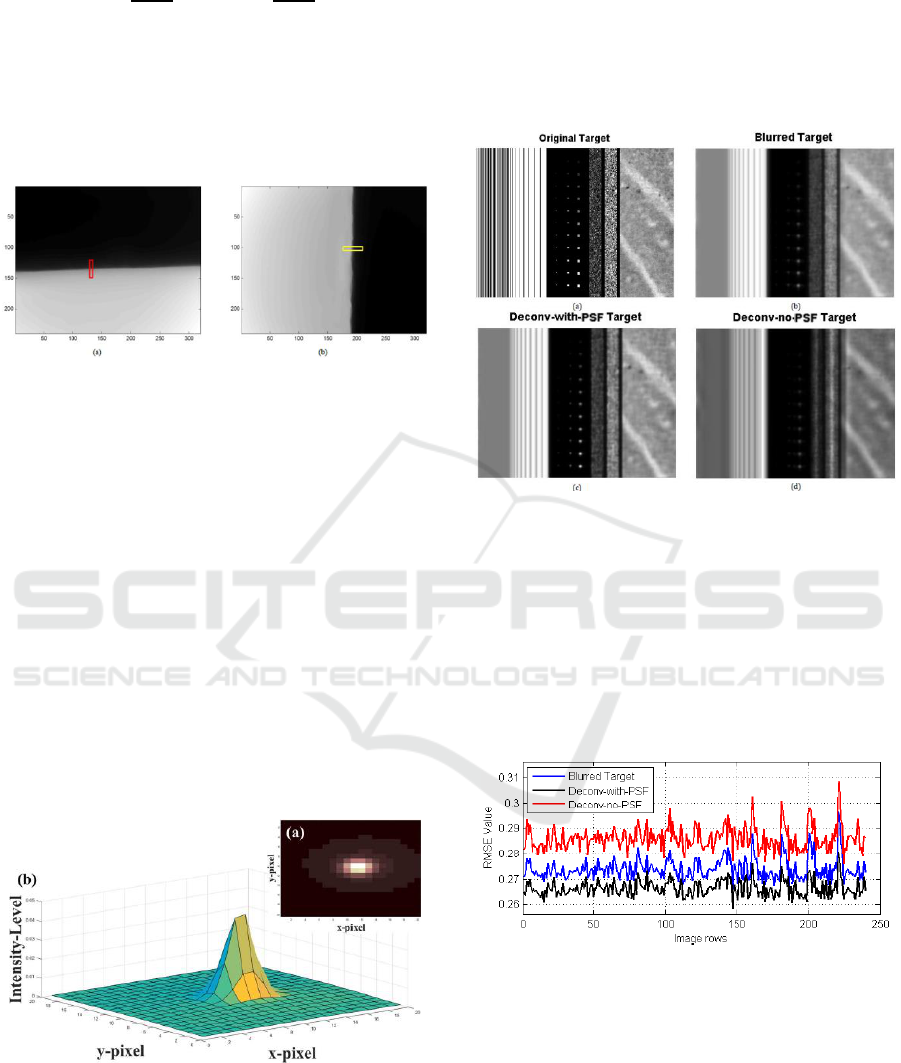
Figure 4: Images of the heat target to produce the desired
step functions in the x and y direction.
Finally, and assuming that the PSF varies
smoothly in all the other directions, the IR
microscope
is completed by a 2D Gaussian fit
using both components, and enforcing the values of
to
.
To produce the needed spatial thermal step, a
metal target was cooled down to 5°C and the
blackbody radiator source, located at a distance of
20 cm from the microscope optical system, was
adjusted to emit at 90 °C. Then, the metal target was
positioned at the microscope focal length (2.5 cm) in
vertical and horizontal arrangements. Perpendicular
linear vectors were extracted from both the x axis
(columns) direction and y axis (rows) directions, as
depicted in the Figure 4. The estimated PSF can be
seen in Figure 5.
Figure 5: Experimental estimated Point Spread Function,
1.6 standard deviation estimated. a) 2-D image
representation. b) 3-D graph representation.
Figure 6 depicts the target images to be used to
test the PSF in the de-blurred process. The PSF
estimation was applied to a simulated target, for the
blur correction using a blind method and non-blind
deconvolution. The blind deconvolution method
Deconvblind uses an ones-matrix to operate in
recursive iterations, estimating a progressive
deconvoluted image, regardless the use of the
infrared microscope PSF.
Figure 6: Deconvolution methods no-PSF and using the
PSF estimation. (a) Target used for measure the focus
level. (b) Blurred target. (c) Target using deconvolution
method with use of PSF. And (d) is the target using blind
deconvolution method (without uses of PSF).
Figure 7 shows a row-by-row improvement in the
RMSE value for the corrected image with the
convolution method, using the estimated PSF, in
comparison to deconvolution method that do not use
the estimated PSF.
Figure 7: RMSE curves, along the image rows. RMSE for
the blurred target (blue), RMSE for the deconvolution
with PSF target (black), and RMSE for the deconvolution
with PSF target (red).
4 IMAGE DEGRADATION
FEATURES ON INFRARED
MICROSCOPY
Considering the image acquisition as a cascade
Infrared Microscopic Imaging Analysis
215
model, where the latent image is degraded, mainly
by two stages: The optic stage and the digitalization
circuitry. This is, after both steps a MWIR
microscopic image suffer a Signal to Noise Ratio
(SNR) lower than one, which is mainly produce by
two major artefacts blur and NU.
In order to jointly diminish the optical blurring
and NU noise on IR microscopic images, we tested
here a Joint NU/blur Correction (JNBC) method (A.
Jara et al.).
(2)
Where
is a NU-noise-free image, but still
degraded by the distortion of the aggregated PSF,
is the noisy and blurred imagery,
and
are the global mean and standard deviation,
respectively, of the input irradiance, which are
known due to the assumption that X follows a
Uniform distribution. The quantities
and
are the mean and standard deviation,
respectively, computed with the digital numbers
measured from the (i,j)-th detector within the array
and using the information available up to the n-th
video frame. Normally the mean and standard
deviation of the noisy image Y is estimated
recursively, which is the approach we adopt here.
(3)
where
is the discrete Fourier
Transform (DFT) of the estimated PSF and
is
the flipped PSF. As in the numerical implementation
of the Richardson Lucy algorithm we enforce the
denominator in Eq. (3) to have values different from
zero. Now, we simply apply inverse filtering over
to estimate, namely
(4)
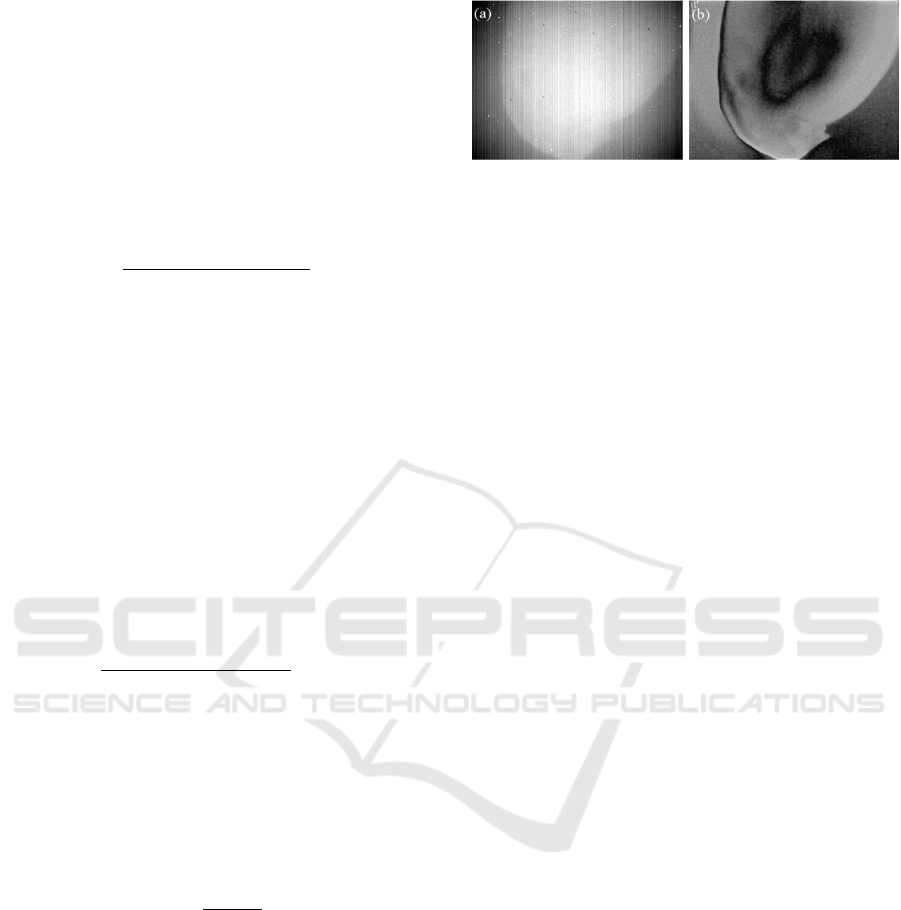
In Figure 8 can be appreciated a raw MWIR
microscopic image highly corrupted by both NU
noise and blur. The JNBC method is able to
simultaneously compensate for both as shown in
Figure 8(b). Significant improvement, in spite of the
severity of the NU noise and blur, can be observed
with only a naked-eyes evaluation. Moreover, note
that as expected, the dead and saturated pixels
shown in Figure 8(a) are compensated in the scene
by the JNBC method.
Figure 8: Estimated images using IR Microscopy samples
affected by both real NU noise and blur. (a) Raw frame
and (b) corrected frame using proposed method. The
improved quality of the corrected image can be easily
noted at naked eye.
5 INFRARED IMAGE QUALITY
ASSESSMENT
We, also here like to test a metric with ability of
evaluate jointly blur and NU noise for IR imaging
systems. This metric works in the spatial domain
applying discrete filtering in order to quantify the
edges amount from distinct frequency basis (A. Jara
et al.).
The Roughness Laplacian Pattern (RLP) metric
quantifies simultaneously the roughness (NU noise)
and the spatial blur on an IR image. It works by
combining two measures: the Laplacian (
2
) of the
image, in order to quantify the NU noise, and the
norm of the discrete Laplacian of a Gaussian (LoG)
of the image, in order to quantify image edges and
details (i.e., measuring the sharpness of the
sequence).
(5)
where parameter can be used to tune the RLP to
evaluate IR images with low blurring distortion, e.g.,
macroscopic IR images ( closer to one), or IR
images with high blurring distortion, e.g.,
microscopic IR images ( closer zero). The RLP
approaches to zero as the NU noise and/or the image
blur is reduced.
The RLP metric was evaluated using images
with different degradation caused by NU noise and
blur, which are shown in the Figures 9 and 11. In
Figure 9, each of the simulate images has a fixed
level of NU and increases the level of blur, being
Figure 9(a) and 9(d) degraded with minor and
greater blur, respectively. As can observed in some
the structures, e.g. the clock, the edges are not
clearly distinguished due to degradation. A different
case is perceived in Figure 11, where each simulated
images has a fixed level of blur and increases the
level of NU noise, this degradation effect can be
VISAPP 2018 - International Conference on Computer Vision Theory and Applications
216

better observed when comparing Figure 11 (a) and
Figure 11 (d).
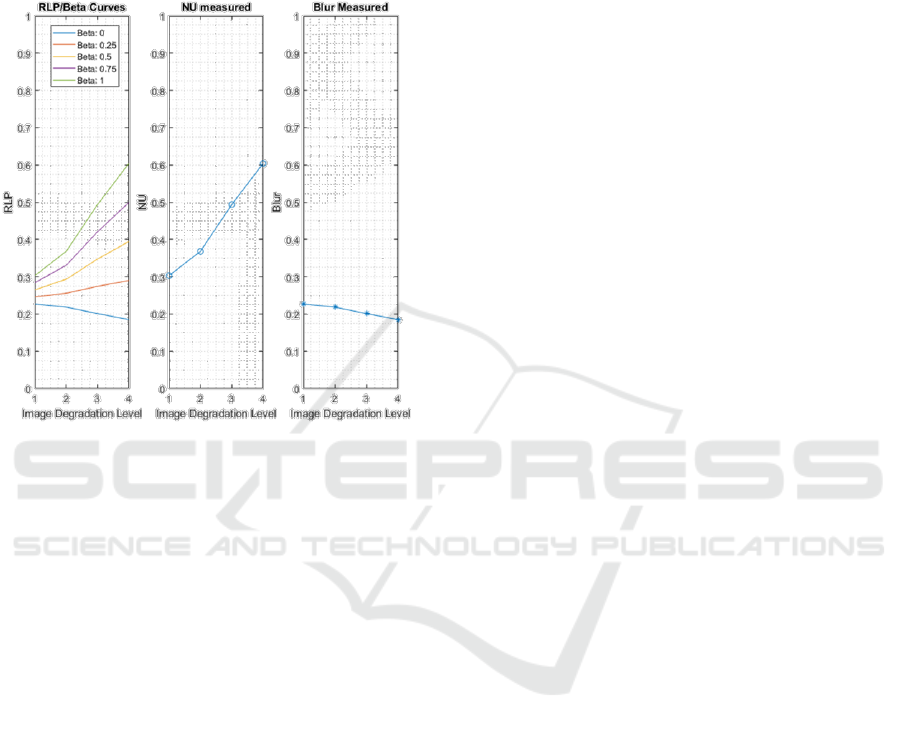
Figure 10 shows the results obtained using RLP
on the images with fixed NU noise and variable blur.
On the left, RLP curves are observed with different
sensitivity parameters allowing a change in the value
obtained by the metric on the degraded images. In
the middle and on the right, the high frequency and
low frequency components (NU noise and blur),
respectively, are quantified for each image simulated
using the terms that compose the proposed metric
independently. When we focus on the NU noise, we
observe an almost constant trend in the values
obtained, which is precisely the effect that we
wanted to achieve. On the other hand, the blurring
curves increases its values allowing seeing the effect
of degradation of blurring on the simulated images.
RLP Curves and independent components of NU
noise and blur for different image degradation levels
are shows in Figure 12. On the left, we can see that
as the sensitivity parameter varies, the RLP obtains
other values due to the weight that is granted to each
degradation effect. On the other hand, it is seen that
the quantized blur effect has very small variations
when comparing each value obtained for each case
of the degraded images, as shown on the right in
Figure 12. This behaviour is totally opposite when
we look at the measurement of the NU noise in the
center of Figure. Overall, the metric manages to
quantify both special effects, separately and mixed,
and give a corresponding weight considering the
degradation observed.
Figure 9: Simulated target image with fixed level of NU
(
) and increasing level of Blur (). (a) NU
,
, (b) NU
, , (c) NU
,
, (d) NU
, .
Figure 10: RLP Curves and independent components NU
and Blur curves for different image degradation levels.
Curves obtained to the simulated target image assessment
with fixed level of NU and increasing level of Blur.
Figure 11: Simulated target image with fixed level of Blur
() and increasing level of NU (
). (a) , NU
, (b) , NU
, (c) , NU
, (d) , NU
.
The proposed RLP index is calculated for the in
Figure 8 mentioned real IR data sets, showing an
improvement from 0.87 to 0.69.
6 CONCLUSIONS
In this paper, advances in mid-wavelength infrared
microscopy referred to acquisition, spatial domain
infrared image correction, Point Spread Function
experimental estimation and image quality
(a) (b)
(c) (d)
(a) (b)
(c) (d)
Infrared Microscopic Imaging Analysis
217
assessment are presented. The key of the PSF
estimations is through using deconvolution in a
blurred IR-simulated target image showing an
improvement when comparison with a blind-
deconvolution (no-PSF) method, this is better
appreciated in the global RMSE parameter.
Figure 12: RLP Curves and independent components NU
and Blur curves for different image degradation levels.
Curves obtained to the simulated target image assessment
with fixed level of Blur and increasing level of NU.
The tested JNBC method combines a well-
known NUC algorithm based on constant range
statistics and Fourier-based deconvolution method in
a single step. Thus, the method has the ability to
simultaneously compensating the blurriness and the
NU noise from degraded IR image sequences,
generating an estimation of the true irradiance in
scene-based. The assessment of the method has
demonstrated that it successfully reduces the
NU/blur. The performance of the JNBC method is
tested in a biological exothermal processes raw
datasets with NU/blur evidencing an improved
image restoration. The proposed RLP index is
calculated for the mentioned real IR data sets,
showing an improvement from 0.87 to 0.69. The
improvement on the thermal spatial gradients and
resolution of the MWIR microscopic images of the
show datasets are quantitatively demonstrated and
qualitatively noticeable with naked eyes.
ACKNOWLEDGEMENTS
This research work was partially supported by the
Chilean CONICYT doctoral scholarship program
and by FONDECYT grant #1160613.
REFERENCES
D. A. Scribner, M. R. Kruer, J. M. Killiany,, 1991.
Infrared focal plane array technology, Proceedings of
the IEEE, 79, 66-85. doi:10.1109/5.64383.
V. N. Mahajan., 1998. Optical Imaging and Aberrations,
Vol. 45.
P. M. Narendra., 1980. Reference-free nonuniformity
compensation for ir imaging arrays.
doi:10.1117/12.959478.
S. N. Torres and M. M. Hayat, 2003.Kalman Filtering for
adaptive nonuniformity correction in infrared focal-
plane arrays, J. Opt. Soc. Am. A, 20, 470-480.
E. Vera, P. Meza, and S. Torres, 2011. Total variation
approach for adaptive nonuniformity correction in
focal-plane arrays, Opt. Lett. 36, (2) ,172-174.
doi:10.1364/OL.36.000172.
N. Wiener, 1949. Extrapolation, interpolation, and
smoothing of stationary time series, Vol. 7, MIT press
Cambridge, MA.
W. H. Richardson, 1972. Bayesian-based iterative method
of image restoration, 325 JOSA 62 (1), 55-59.
L B. Lucy, 1974. An iterative technique for the
rectification of observed distributions, The
astronomical journal 79, 745.
Hecht., 2002. Optics. Editorial Addison-Wesley.
K. Rossmann., 1969. Point spread-function, line spread-
function, and modulation transfer function: tools for
the study of imaging systems, Radiology 93, (2), 257-
272.
A. Jara, S. Torres, G. Machuca, W. Ramírez, P. A.
Gutiérrez, L. A. Viafora, S. E. Godoy, E. Vera,
Submited to Infrared Physics & Technology, Elsevier.
A. Jara, S. N. Torres, G. Machuca, S. E. Godoy, A non-
reference metric for non-uniformity and blurring
artifacts on infrared imaging, Unpublished results.
VISAPP 2018 - International Conference on Computer Vision Theory and Applications
218
