
Segmentation of Lidar Intensity using Weighted Fusion
based on Appropriate Region Size
Masaki Umemura
1
, Kazuhiro Hotta
1
, Hideki Nonaka
2
and Kazuo Oda
2
1
Meijo University, 1-501 Shiogamaguchi, Tempaku-ku, 468-0073, Nagoya, Aichi, Japan
2
Asia Air Survey Co., Ltd, 1-2-2 Manpukuji, Asao-ku, 215-0004, Kawasaki, Kanagawa, Japan
Keywords: Semantic Segmentation, Convolutional Neural Network, LiDAR Intensity, Road Map, Weighted Fusion,
Appropriate Size and U-Net.
Abstract: We propose a semantic segmentation method for LiDAR intensity images obtained by Mobile Mapping
System (MMS). Conventional segmentation method could give high pixel-wise accuracy but the accuracy of
small objects is quite low. We solve this issue by using the weighted fusion of multi-scale inputs because each
class has the most effective scale that small object class gives higher accuracy for small input size than large
input size. In experiments, we use 36 LIDAR intensity images with ground truth labels. We divide 36 images
into 28 training images and 8 test images. Our proposed method gain 87.41% on class average accuracy, and
it is 5% higher than conventional method. We demonstrated that the weighted fusion of multi-scale inputs is
effective to improve the segmentation accuracy of small objects.
1 INTRODUCTION
In Japan, roads and buildings continue to change and
its conservation work to prevent aging is carried out.
In order to perform road maintenance, map
information which indicates the position, shape and
the number of objects like pedestrian crossing and
catchment basin is required. Thus, we use the road
map called Fundamental Geospatial Data of road
(FGD) (Hasegawa and Ishiyama, 2013). However,
the creation of FGD has been done manually now.
Since the creation of maps handle large amounts of
data, it is a physical and mental burden. Thus,
automatic creation of the FGD is required to reduce
human burden and cost.
Several methods for automatic creating map
information from LiDAR intensity images have been
proposed (Umemura et al., 2016, Umemura et al.,
2017). In those methods, a local region is cropped
from the LiDAR intensity images (Yan et al., 2013),
and the similarity between the features of local
regions obtained by Convolutional Neural Network
(CNN) is used. If a local region includes similar
objects constituting a road, the features obtained from
the local region are also similar. Thus, if we find local
regions for training that similar features have, we can
know class labels attached to local regions. However,
in the conventional method, the classes of small
objects are more difficult to describe features by CNN
than the classes of large objects such as road, and the
accuracy of class with small area is low. In this paper,
we would like to address this issue.
We investigate the appropriate region size of each
class, and the voting result from the most appropriate
size of each object is used effectively. When we fuse
the results obtained by multi-scale inputs, the
weighted fusion using appropriate region size is used
to improve the segmentation accuracy of small
objects.
In experiments on semantic segmentation from
LIDAR intensity images, our proposed method
obtained 87.41% on class average accuracy.
Moreover, the accuracy of small object classes is
improved over 10% in comparison with conventional
method. Our segmentation method also achieved
better performance than the U-net (Ronneberger et al.,
2015) that is one of the most excellence end-to-end
segmentation methods.
This paper is organized as follows. We explain the
related works in section 2. The details of our proposed
method are explained in section 3. Evaluation and
comparison results are shown in section 4. Section 5
is for conclusions and future works.
608
Umemura, M., Hotta, K., Nonaka, H. and Oda, K.
Segmentation of Lidar Intensity using Weighted Fusion based on Appropriate Region Size.
DOI: 10.5220/0006717706080613
In Proceedings of the 7th International Conference on Pattern Recognition Applications and Methods (ICPRAM 2018), pages 608-613
ISBN: 978-989-758-276-9
Copyright © 2018 by SCITEPRESS – Science and Technology Publications, Lda. All rights reserved

2 RELATED WORKS
In this paper, we propose a segmentation method for
recognizing the position, shape and the number of
objects from LiDAR intensity images.
Recent segmentation methods can be roughly
divided into two approaches; Convolutional neural
network (CNN) or not. The approaches without CNN
(Tighe and Lazebnik, 2012; Kohli et al., 2013) are
faster and require a smaller number of training images
than CNN based method. However, their accuracies
are not so high.
Since we want to create road map automatically,
we must obtain high accuracy as much as possible.
Almost of those methods without CNN used colour
information to improve accuracy but we use LiDAR
intensity images which are grey scale images.
On the other hand, CNN based approaches
(Hariharan et al., 2014, Girshick et al., 2016, Jonathan
et al., 2015) are successful on segmentation problem.
Those methods gave high accuracy using a large
number of training images. But, we have only 36
LiDAR intensity images, and the size of small object
is about 10 x 10 pixels in an image of 1500 x 2000
pixels. Those small objects could be lost by encoding
by convolution or pooling process in CNN.
To overcome the problem, we proposed a
segmentation method (Umemura et al., 2016) using
local regions cropped from LiDAR intensity images.
By using features obtained from the Caffenet (Jia et
al., 2014) and K nearest neighbor, segmentation is
carried out from a small number of LiDAR Intensity
images.
3 PROPOSED METHOD
3.1 Segmentation using Similar
Regions
In the proposed method, features are extracted by
CNN from the local regions cropped from the LiDAR
intensity images. The features obtained by CNN
represent the contents of the local region, and the
similarity between features represents the similarity
of contents of local regions. We select K regions in
descending order of similarity by K nearest
neighbours. Since local regions in training images
have manually-annotated ground truth labels, we vote
the labels which are attached to the K similar regions
to an output image.
Furthermore, we apply two weights based on the
information of a local region and its neighbouring
regions to voting process. We denote a local region as
and the set of
is denoted as .
is pixel wise
ground truth label of
.
is a N x N dimensional
vector if we crop a local region of N x N pixels. We
define ground truth labels at the k-th pixel as
which takes one label in C classes. The two weights
are defined as
if
if
and
0 otherwise
(1)
(2)
where
is an object label of each local region. Note
that
is different from pixel-wise ground truth label
. We assigned an appropriate class label to each
local region automatically by the area of an object
because the size of objects in a road map is clearly
defined. Thus, the object label
represents the most
important class label in a local region
.
is the
distance of the m-th nearest neighbour,
is the
distance of the most similar region and
is the
distance of the K-th nearest neighbour.
Equation (1) is determined from the information
of only the local region
. If ground truth label of the
k-th pixel
is the same as the object label
, we
enlarge voting weight for
. In the first condition, if
ground truth label
attached to a local region
corresponds to object label
, then the weight
according to similarity is voted. In the second
condition,
is the set of class labels which appear
in
. If ground truth label
attached to a local
region
is not the same class label
, then
is voted. For the other cases,
voting is not carried out. Thus, we can vote a larger
value to the appropriate class of the local region
than the other labels. The weight of the most similar
region is 1 and the most unsimilar region is 0.
is the parameter to define how much we focus
on the label
. Lager, more focus on it. In this
paper, we use empirically based on
validation.
Equation (2) is determined from the information
of surrounding local regions
of
. If object label
corresponds to ground truth label
, we enlarge
the voting weight for
. Since we cropped local
regions with overlapped manner, the object label
of surrounding regions
should be the same to the
object label
of the local region
. The weight
Segmentation of Lidar Intensity using Weighted Fusion based on Appropriate Region Size
609
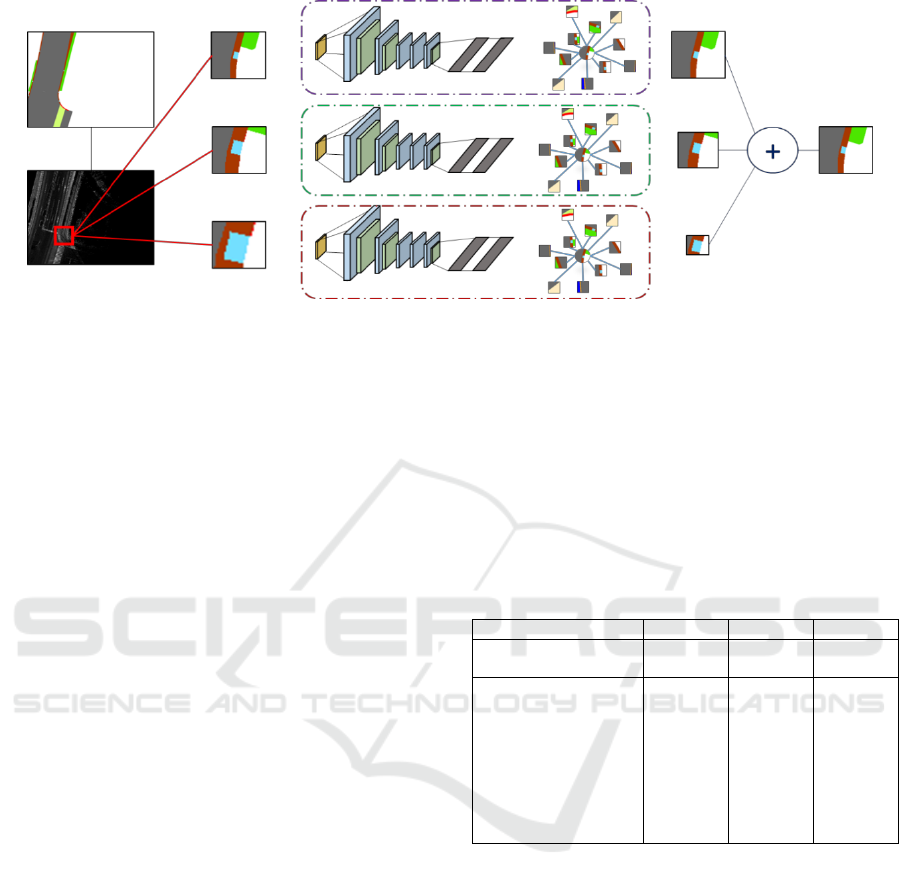
Figure 1: Overview of our proposed method.
becomes high if the number of neighboring object
labels
corresponds to
is large.
3.2 Weighted Fusion
In order to improve the accuracy of the classes with
small area, we focus on the size of input regions for
CNN. The size of the road structure is clearly defined,
and the LiDAR intensity images used in this research
have the property that angle change in appearance
does not occur. Thus, the size of each object in the
dataset does not change significantly. Thus, we can
use the voting result from the most appropriate size of
each object.
We evaluate the appropriate size of each class by
using cross-validation of our dataset. In this paper, we
try to use a local region of 16 x 16, 32 x 32 and 64 x
64 pixels as the input for CNN. Table 1 shows the
accuracy of each class while changing the region
sizes. Bold means the best accuracy among three
region sizes. As a result of evaluation, object classes
with small area such as catchment basin etc. gave the
best result at the region size of 16 x 16 pixels. Road
which has large area gave the best result at the region
size of 64 x 64 pixels. The gore area etc. with middle
area gave the highest accuracy at the region size of 32
x 32 pixels. Since we found the appropriate size of
each class, the information can be used for improving
the accuracy.
We use weighted fusion of the voting results by
three different region sizes; 16 x 16, 32 x 32 and 64 x
64 pixels. For example, if the estimated label of a
pixel is catchment basin, we enlarge the weight for
the pixel in a score map of 16 x 16 pixels which is the
most appropriate size for catchment basin. The
weight of 32 x 32 and 64 x 64 pixels are low because
they are not appropriate size for catchment basin.
Namely, when we vote the annotated labels attached
to K similar regions, the voting weight for the class
label is enlarged if input size corresponds to the
appropriate size of object class.
By using this method, we improve the accuracy of
small objects such as a catchment basin which was
hard to classify by the conventional method. In
addition, since we also use features extracted from
appropriate sizes for the objects with large area such
as roads, it is possible to prevent to assign the wrong
class label to the large objects.
Table 1 : Appropriate region size to describe features.
16
32
64
Pixel-wise
Class average
19.03
57.65
91.87
72.75
92.70
64.79
Pedestrian crossing
Catchment basin
Garden plant
Gutter
Gore area
Road
Median
Pedestrian path
Road shoulder
-
49.42
91.66
25.64
72.24
10.88
89.42
0.63
89.88
75.10
36.79
90.75
13.06
72.43
94.71
93.98
96.65
81.26
65.66
4.72
81.90
3.88
63.76
97.78
92.55
96.85
76.05
However, this method has a problem about
computational cost because we must make three score
maps from three different input regions. Thus, it may
take three times longer than conventional method.
When we check the computational time of
conventional method, we found that computational
time for K nearest neighbour is the most amount of
time. Thus, we need to improve this process.
To solve this problem, we apply hierarchical
clustering to training dataset for K nearest neighbour.
We use hierarchical clustering for each class and
reduce the number of local regions which have
similar features. By decreasing the number of training
local regions, it is possible to compute three score
maps with the same processing time as the
conventional method without dropping the accuracy.
ICPRAM 2018 - 7th International Conference on Pattern Recognition Applications and Methods
610

4 EXPERMENTS
4.1 Experimental Setting
In experiments, we use 36 LiDAR intensity images
with manually annotated ground truth labels. They
were obtained by the MMS. The size of LiDAR
intensity images are 2000 x 1500 pixels, and an image
represents 80 x 60 meters. Those images include 9
categories; pedestrian crossing, catchment basins,
roadside tree, gutter, gore area, road, median,
pedestrian path and road shoulder. We divide 36
images into 28 training images and 8 test images. By
using our method, we obtain over 40 thousands local
regions for training and a thousand local regions for
test from only 36 images.
We use both class average accuracy and pixel-
wise accuracy as evaluation measures. Pixel-wise
accuracy is influenced by objects with large area such
as road. Class average accuracy is influenced by
objects with small area such as catchment basin. We
consider that class average accuracy is more
important than pixel-wise accuracy because the
purpose of this study is for making the Fundamental
Geospatial Data of road automatically. Thus, it is
necessary to improve the accuracy of classes with
small areas such as catchment basins.
4.2 Evaluation Result
Our method is compared with some methods.
Conventional method is the same as our segmentation
method that local regions with 64 x 64 pixels are used
without clustering. We also evaluate the U-net which
is a kind of encoder-decoder CNN because it is the
famous end-to-end segmentation method. U-net used
in this paper consists of 3 encoders and 3 decoders
with batch normalization. The size of input regions is
64 x 64 pixels. Proposed segmentation method uses
the weighed fusion of three different region sizes and
clustering. Thus, the proposed methods without the
weighted fusion and only single region size are also
evaluated to show the effectiveness of weighted
fusion of different region sizes.
Table 2 shows experimental result. We see that
our proposed method achieved 87.41% on class
average accuracy. It is the highest class average
accuracy and about 5% higher accuracy than
conventional method. When we fuse voting results of
three different region sizes without the weighted
fusion, the class average accuracy was 81.44%. This
demonstrates the effectiveness of the weighted fusion
using appropriate size of each class.
Next, we compared our method with the U-net.
Our segmentation method achieved much better
performance than the U-net that is one of the famous
end-to-end segmentation deep networks. We see that
the accuracy of U-net is nearly same as the
conventional method using K-NN of CNN features.
Table 2: Comparison results.
Class average
Pixel-wise
Conventional method
82.19
96.89
U-net
75.01
94.07
Proposed method
87.41
96.88
-without weighted fusion
81.44
96.84
-only 64x64
78.21
97.35
-only 32x32
75.19
92.78
-only 16x16
76.54
95.66
Table 3 shows the accuracy of each class. Our
proposed method gave the best accuracy in many
classes. Especially, in the class of small objects such
as catchment basin and gutter, the accuracy is much
improved. The accuracy of our method for catchment
basin and gutter is 27% and 14% higher than the
conventional method. The accuracy did not change
for the classes with large object such as road. Since
we also use the appropriate size for large objects, the
accuracy did not decrease. Table 2 and 3
demonstrated that our proposed method can improve
the accuracy and solve the problems of the
conventional method.
Figure 2 shows whole segmentation results and
Figure 3 shows the segmentation results of local
regions including small objects. Our proposed
method can correctly segment the objects that
conventional method cannot segment.
However, there are parts that are not segmented
well as shown in the third row of Figure 3. This part
could not be segmented by all methods in this paper.
This is because curved gutter like Figure 3 is little
included in training. For pedestrian path in Figure 2
and 3, the texture is vanished and it is hard to
recognize it. In LIDAR intensity images, the texture
of the same object changes due to road environment
such as wetting
5 CONCLUSIONS
In this paper, we proposed a segmentation method
based on the weighted fusion using the appropriate
size of each class. Our method improved the accuracy
of small objects which were hard to classify by the
Segmentation of Lidar Intensity using Weighted Fusion based on Appropriate Region Size
611
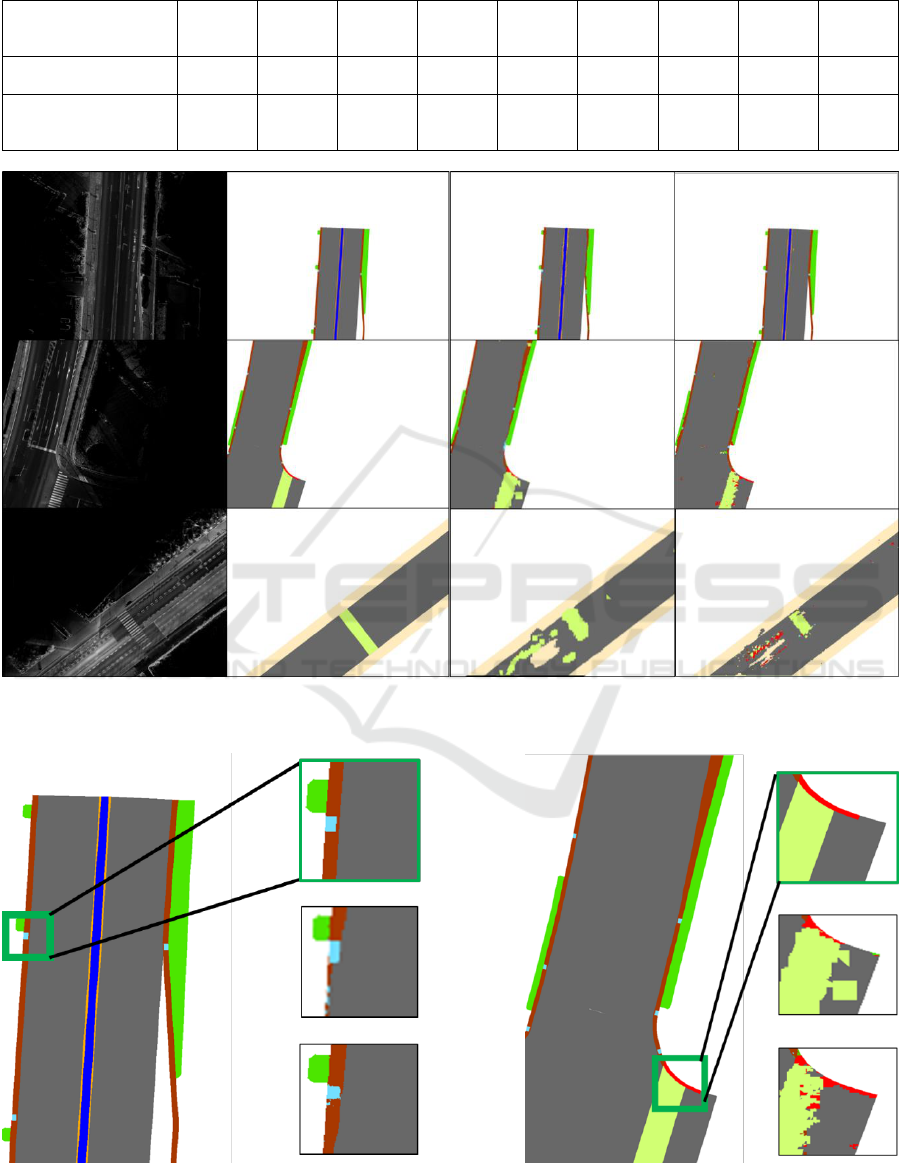
Table 3: The accuracy of each class.
pedestri
an
crossing
catchme
nt basin
roadside
tree
gutter
gore
area
road
median
pedestri
an path
road
shoulder
Conventional method
80.01
59.50
98.70
54.26
91.59
96.83
95.11
99.17
87.63
U-net
75.61
65.18
77.36
15.35
73.69
95.70
96.32
91.87
84.00
Proposed method
66.30
87.50
93.11
68.38
88.20
97.07
96.17
99.39
93.56
-without weighted
fusion
76.03
83.00
93.44
30.52
74.69
97.49
96.85
99.35
81.62
Figure 2: Examples of segmentation result. The first column is input LiDAR intensity image, the second column is ground
truth, the third column is results by conventional method and the forth column is results by the proposed method.
Figure 3: Segmentation results of objects with small area. The first row is ground truth of a red squared region, the second
row is result by conventional method and the third row is result by the proposed method.
ICPRAM 2018 - 7th International Conference on Pattern Recognition Applications and Methods
612

conventional method, and it is possible to prevent to
assign the wrong class label to the large object by
using the appropriate size effectively.
In experiments, our proposed method obtained
87.41% on class average accuracy and about 5%
higher accuracy than conventional method. Our
segmentation method also achieved better accuracy
than the U-net that is one of end-to-end segmentation
deep networks.
However, there are parts that are not segmented
well because the texture of the same object changes
greatly due to road environment such as wetting. We
need to improve this issue in future work.
REFERENCES
Hasegawa, H. Ishiyama, N., 2013, Publication of The digital
maps (basic geospatial Information). Geospatial
Information Authority of Japan, Vol.60, pp.19-24.
Umemura, M., Hotta, K., Nonaka, H., Oda, K., 2016, Image
labeling for LiDAR intensity image using k-nn of
feature obtained by convolutional neural network, Int.
Arch. Photogram. Remote Sens. Spatial Inf. Sci., XLI-
B3, pp. 931-935.
Umemura, M., Hotta, K., Nonaka, H., Oda, K., 2017,
Segmentation of LiDAR Intensity Using CNN feature
Based on Weighted Voting, International Conference
on Image Analysis and Recognition, pp.578-585.
Yan, W. Y., Shaker, A., Habib, A., Kersting, A. P., 2012,
Improving classification accuracy of airborne LiDAR
intensity data by geometric calibration and radiometric
correction. ISPRS journal of photogrammetry and
remote sensing, 67, pp. 35-44.
Ronneberger, O., Fischer, P., Brox, T., 2015, U-net:
Convolutional networks for biomedical image
segmentation. In International Conference on Medical
Image Computing and Computer-Assisted Intervention,
pp. 234-241.
Tighe, J. and Lazebnik, S., 2012, Superparsing, scalable non
parametric image parsing with super pixels. Proc.
European Conference on Computer Vision, pp. 352–
365.
Kohli, P., Osokin, A., Jegelka, S., 2013, A principled deep
random field model for image segmentation. Proc.
IEEE Conference on Computer Vision and Pattern
Recognition pp. 1971-1978.
Hariharan, B., Arbeláez, P., Girshick, R., Malik, J., 2014,
Simultaneous detection and segmentation. Proc.
European Conference on Computer Vision pp. 297-312.
Girshick, R., Donahue, J., Darrell, T.,Malik, J., 2016,
Region-based convolutional networks for accurate
object detection and segmentation. IEEE transactions
on pattern analysis and machine intelligence, Vol.38,
No.1, pp. 142-158.
Jonathan, L., Shelhamer, E., Darrell, T., 2015, Fully
convolutional networks for semantic segmentation.
Proc. IEEE Conference on Computer Vision and
Pattern Recognition, pp. 3431-3440.
Badrinarayanan, V., Kendall, A., Cipolla, R., 2015, Segnet:
A deep convolutional encoder-decoder architecture for
image segmentation. IEEE Transactions on Pattern
Analysis and Machine Intelligence, arXiv 1511.00561.
Jia, Y., Shelhamer, E., Donahue, J., Karayev, S., Long, J.,
Girshick, R., Guadarrama, S. Darrell, T., 2014, Caffe:
Convolutional architecture for fast feature embedding.
Proc. ACM International Conference on Multimedia, pp.
675-678.
Novak, K., 1993, Mobile Mapping System: new tools for
the fast collection of GIS information. Proc. SPIE,
Vol.1943.
Segmentation of Lidar Intensity using Weighted Fusion based on Appropriate Region Size
613
