
A Test of Structured Threat Descriptions for Information Security
Risk Assessments
Henrik Karlzén, Johan Bengtsson and Jonas Hallberg
Department for Information Security and IT Architecture, Swedish Defence Research Agency, Linköping, Sweden
Keywords: Information Security, Risk Assessments, Threat Descriptions, Risk Perception, Structure.
Abstract: Assessing information security risks has proven difficult, with prevalent methods lacking clarity and
resulting in assessments that vary with the rater. In this paper, we use a questionnaire based approach to
investigate whether a more structured method, partitioning threat descriptions into smaller parts, can be
useful. Although the new method did not result in less cognitive load, lower uncertainty, or overall reduced
rater-dependency, there were strong indications that it lowered rater-dependency among raters with the
highest expertise, reaching the consensus levels of experts in the intrusion detection domain. Conversely,
non-experts seem to perform better with the traditional descriptive method. Caution is needed when
interpreting this, as the Dunning-Kruger effect may have skewed the self-reporting of expertise. Further, the
less certain raters were more prone to rate severity lower, indicating the missing variable of risk aversion.
Moreover, other kinds of bias are discussed, and further structuring is proposed.
1 INTRODUCTION
Information security risk assessments (ratings) have
been shown to vary depending on the rater, and even
among experts (Karlzén et al., 2017; Sommestad et
al., 2017). In some cases, raters may even differ by
as much as several orders of magnitude
(Abrahamsen et al., 2013). This is further supported
by the perception of information security risk
assessment methods as "only as good as the person
executing it" with low confidence in precision
(Wangen, 2016). The implication is that objective
truth is not reached, or that it may only be reached in
a small subset of certain super-experts. Indeed, in
the general case it appears experience and training
alone do not seem to be enough to make experts
(Kleinmuntz, 1990). Moreover, it lends support to
questioning the reliance on risk assessments in
information security, e.g., in (ISO/IEC, 2011).
As flawed information security assessments and
highly qualified personnel can both be costly for
almost any organization, it is an interesting research
topic to establish how to improve the ratings in a
cost-efficient way, and in part if it is at all possible.
Since the objective truth is hard to come by,
reducing the rater-dependency seems a suitable
surrogate. If rater-dependency is to be reduced, there
must be higher reliability between the ratings of one
rater and the ratings of another rater, i.e. higher
inter-rater reliability. Another factor is how certain a
rater is of its ratings. For example, two raters may
rate a risk at the same level, but with differing
confidence intervals. In fact, it is a common critique
against risk assessments that there is no
communication of uncertainty (Hassenzahl, 2006;
Goerlandt and Reniers, 2016). Cost-efficiency may
be gauged via raters’ cognitive load, i.e. the mental
effort and time required, as well as task difficulty.
To increase inter-rater reliability, while keeping
cognitive load and uncertainty low, it seems rational
to mimic the general problem solving technique of
decomposition into the underlying constituents. This
approach is supported by (Kahneman et al., 1982;
Kleinmuntz, 1990) who investigate general expert
assessments in the presence of uncertainty.
Furthermore, it has been shown that raters cannot
easily reason in terms of the overall risk related to a
threat, and their inter-reliability improves when the
risk is instead assessed separately for each of its
factors probability (of threat realization) and severity
(of the attached consequences) (Weinstein, 2000;
Sommestad et al., 2017). Additionally, (Hansson and
Hirsch Hadorn, 2017) posited that increased
structure and decreased complexity is one of the
critical aspects for improving risk assessments.
Karlzen, H., Bengtsson, J. and Hallberg, J.
A Test of Structured Threat Descriptions for Information Security Risk Assessments.
DOI: 10.5220/0006719604690476
In Proceedings of the 4th International Conference on Information Systems Security and Privacy (ICISSP 2018), pages 469-476
ISBN: 978-989-758-282-0
Copyright © 2018 by SCITEPRESS – Science and Technology Publications, Lda. All rights reserved
469

To achieve this, this paper uses a structured
presentation of information security threat
descriptions based on terminology in (ISO/IEC,
2012), partitioning threats into agent; vulnerability;
action; asset; along with the possible undesirable
incidents and consequences.
The objective of this paper is to compare the
structured presentation of risks with the more
traditional and less structured (descriptive) approach
of natural language descriptions, not only in terms of
inter-rater reliability but also evaluating whether the
use of structured presentations lowers the cognitive
load and the margins of error of the ratings (i.e. the
rater uncertainty). The five hypotheses were:
H1. Inter-rater reliability for severity ratings is
higher when threats are described using
structured tables rather than descriptively.
H2. Certainty in severity ratings is higher when
threats are described using structured tables
rather than natural language descriptions.
H3. Inter-rater reliability for probability ratings
is higher when threats are described using
structured tables rather than descriptively.
H4. Certainty in probability ratings is higher
when threats are described using structured
tables rather than descriptively.
H5. Cognitive load is lower when rating
probability and severity with threats
described using structured tables rather
than descriptively.
The paper continues with a description of the
method in Section 2, results in Section 3, and finally
a discussion of the results in Section 4.
2 METHOD
Two paper-based questionnaires were used to
conduct the study, both comprising three parts and
filled out by each participant.
The first part consisted of eight questions about
the respondent, and were identical between
questionnaires, and answered only on whichever
questionnaire the respondent filled out first.
The second part consisted of 23 threats that were
assessed for both probability and severity. One
questionnaire described the threats descriptively,
whereas the other used structured tables.
The third part of the questionnaires concerned
the cognitive load of filling out the questionnaires
and the certainty of the answers.
Fourteen respondents – all researchers, mostly
with PhDs – were randomly sampled from the
information security and IT management, human
factors, and robust telecommunications departments,
of the authors’ organization. Apart from doing
academic research, they also produce reports with a
more practical approach for the benefit of specific
customers. As such, the respondents may be
somewhat more similar to practitioners than most
academic researchers. Further, the departments were
chosen to reflect the general background of
practitioners, albeit purposefully with some
departments more likely to be particular experts than
others. This allows analysis of how large a part
expertise plays and if it is enough to be an expert in
a similar field to information security, or indeed if
even outright information security expertise is
enough. It may be noted that while the respondents
and authors are from the same organization, ethical
reasons dictated that data were not made available to
superiors (other than in the form of this paper).
The respondents were divided into two equal
groups. The members of the groups (individually)
assessed the items using both methods, but in
reverse order from one another and with one to two
weeks between questionnaires to limit recollection.
To avoid influencing the respondents’ assessments,
they were not told the specific purpose of the study.
2.1 Threat Descriptions
The 23 potential information security threats were
elicited based on a brainstormed scenario, with a
description of a fictional corporation in the global
financial services sector and its new internal
software for paying suppliers. Quite a lot of thought
went into the scenario to make it realistic and
possible for the respondents to relate to, as well as to
produce an unambiguous setting for rating threats.
Two experienced risk raters were asked to provide
feedback on the threats with ensuing suitable
adjustments.
Apart from roughly describing the organization
and business area of the fictional corporation, the
scenario construction consisted of a general system
description with its inputs and outputs; the assets
(the part of the organization affected by a threat);
possible undesirable incidents (possible immediate
threat impact on an asset); consequences (of a threat
and for the organization); as well as agents (who
actively cause a threat to be realized); vulnerabilities
(enabling the threat); and actions (the path leading to
a realized threat, i.e. such as an attack vector). This
terminology is based on (ISO/IEC, 2012). An
example threat is described in Figure 1, using a) the
descriptive method and b) the structured method.
ICISSP 2018 - 4th International Conference on Information Systems Security and Privacy
470
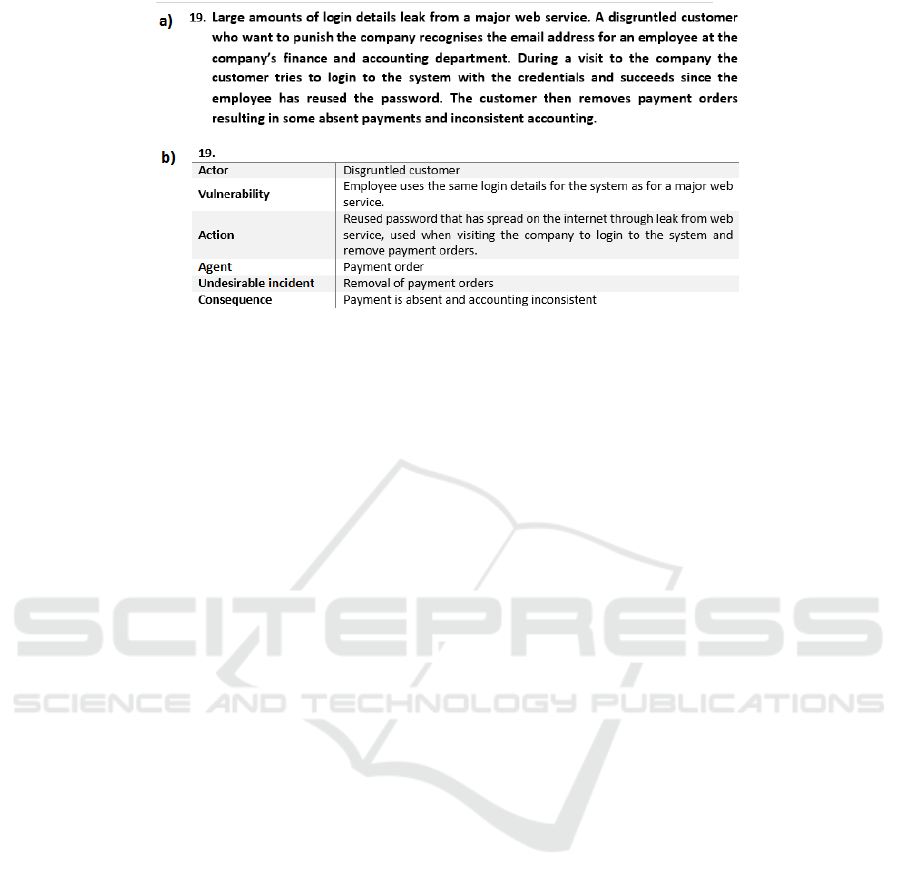
Figure 1: Example threat using a) the descriptive method, and b) the structured method.
In some cases a threat did not have an explicit
agent (e.g., a mistake caused by incompetence)
and/or an explicit vulnerability (e.g., when the flaw
is unclear or general such, as insufficient training of
personnel). In such cases, the respective fields were
left blank in the structured questionnaire.
2.2 Severity and Probability
In both questionnaires, the respondents were asked
to provide the severity and probability of each threat.
The perceived severity of threats was indicated
by circling the suitable part of a 1–5 Likert scale.
The perceived probability of a threat occurring
during the next year was indicated by circling either
1 (None identified or < 1%), 2 (Low or 1–5%), 3
(Increased or 6–25%), 4 (High or 26–50%), or 5
(Very high or > 50%). Hence, the probability scale
did not have equidistant items, but threats are rarely
both highly severe and highly probable (Weinstein,
2000) and so for threats with non-negligible
severities, probabilities will be low.
To mimic the mentioned threat analysis process,
discrete scales were used instead of visual analogue
scales. The difference in precision should have
negligible impact on the results.
2.3 Cognitive Load and Uncertainty
While there are benefits to security for assessing
risks, it can also be a resource demanding task and
one must make sure that the drawbacks do not
outweigh the benefits. To measure the impact on the
participants when assessing, three aspects of
cognitive load, as detailed in (Deleeuw and Mayer,
2008), were gauged at the end of each questionnaire,
in line with a previous study (Karlzén, 2017).
Intrinsic cognitive load was measured by an item
concerning the mental effort for filling out the
questionnaire, using a Likert scale 1–7.
Germane cognitive load was measured by an
item about assessment difficulty (Likert scale 1–7).
Extraneous cognitive load was (objectively)
measured by timing questionnaire completion,
excluding the non-threat related items.
Jointly, these cognitive load measures cover the
inherent complexity of the task; the cognitive room
for learning; and the redundancy of presentation.
Finally, each questionnaire gauged respondents’
assessment certainty with two items (Likert scale 1–
7). These items did not specify whether the rater’s
(un)certainty was due to e.g., lacking knowledge, or
due to a flawed approach. Indeed, both uncertainties
are important for overall reliability (Gardoni and
Murphy, 2013). After all, if one does not use a ruler
with millimetre precision properly, the overall
precision will be worse than at the millimetre level.
2.4 Cognitive Style and Expertise
Cognitive style was measured using four items
relating to rationality in decision making, i.e. with a
focus on objective information and logic, and four
items relating to intuitive decision making, i.e.
relying on gut feeling and instinct. These items were
adapted from (McShane, 2006) and the Cognitive
Style Index (Allinson and Hayes, 1996) and were
identical to a previous study (Karlzén, 2017). Self-
ratings for expertise (including training and
experience) were also provided.
2.5 Measuring Inter-Rater Reliability
For the computation of the inter-rater reliability
values, the intraclass correlation coefficient (ICC)
A Test of Structured Threat Descriptions for Information Security Risk Assessments
471

was used, as appropriate when similar measurements
from the same “class” are being compared (e.g., two
different stockbrokers’ recommendations) rather
than using Pearson correlations as with different
types of measurements (e.g., income and health).
In this paper, four two-way random model ICCs
are used, each a combination of two different binary
categories, with terminology per (Trevethan, 2017).
One category (type) determines if systematic
differences (bias) of an additive form between raters
should lower reliability. Absolute agreement ICC
penalizes for this bias, while consistency agreement
ICC does not. If one does not penalize for this bias,
the measured reliabilities may be misleadingly high
(Lombard et al., 2002). However, part of this bias
may in practice be mediated by calibrating the raters,
and a measure penalizing for this bias could thus
underestimate the reliability achieved in practice.
The other ICC category (form) determines if the
measure should reflect one single rater (single
measures) representing all others, or an all-rater-
average (average measures), as more appropriate for
when more than one rater will be used in practice.
All four combinations are of interest in this
study, as applicable. It may be noted that none of
these measures compensate for the case of raters not
using the entire scale, and because of this some care
is taken in the description of the results.
3 RESULTS
Table 1 presents the inter-rater reliability for
severity. Natural language consistently produces
higher inter-rater reliability for severity, but
confidence intervals (CIs) overlap with those of the
structured method, so hypothesis H1 could not be
supported.
ICCs for the severity ratings are fairly high (>
0.7) for both methods, when averaging for the
fourteen raters, but single measures shows that one
random rater on its own would likely not be expert
enough to produce sufficient reliability. Values for
absolute agreement are about 0.1 lower than those
for consistency agreement, although CIs overlap.
This is similar to the difference in a comparable
study (Karlzén et al., 2017) and an indication that
raters do not begin and end their internal scales in
the same places, producing a constant additive
difference, i.e. a type of bias. This may be because
of their style of filling out questionnaires in general,
or it may be due to differing levels of risk aversion.
Table 2 provides the inter-rater reliability values
for probability. Natural language consistently
produced higher inter-rater reliability also for
probability, but CIs again overlap with those of the
structured method, so hypothesis H3 could not be
supported. A previous study found average measures
consistency agreement ICCs for natural language of
0.817 to 0.897 compared to this study’s 0.459 to
0.846 (or 0.580 to 0.880 when interpreting the scale
as a more regular monotone one). The lower figures
here may be due to more fine-grained threats, and in
more specific situations general knowledge will be
less applicable, the variables greater in number, and
so the decision making more prone to error. In fact,
there was an obvious floor effect, with almost all
threats rated a 1 or a 2 (79% of ratings were in the
range 0–5%) but this still produced low inter-rater
reliability. On the other hand, coarse-grained threats
may be a double-edged sword as the more
information given, the more precise the formulation
of the threat and thus the less likely for error due to
ambiguity.
ICCs for the probability ratings are extremely low
for single measures (i.e. one random rater) but also
quite low when taking the fourteen raters together.
Table 1: Intraclass coefficients for severity (95% CI).
Consistency agreement
Absolute agreement
Descriptive
Structured
Descriptive
Structured
Single measures
0.338–0.663
0.204–0.518
0.215–0.548
0.149–0.440
Average measures
0.877–0.965
0.782–0.938
0.794–0.944
0.711–0.917
Table 2: Intraclass coefficients for probability (95% CI).
Consistency agreement
Absolute agreement
Descriptive
Structured
Descriptive
Structured
Single measures
0.057–0.281
0.039–0.244
0.042–0.229
0.034–0.217
Average measures
0.459–0.846
0.365–0.819
0.383–0.806
0.328–0.795
ICISSP 2018 - 4th International Conference on Information Systems Security and Privacy
472

Figure 2: Severity for the descriptive method and certainty in the severity ratings (with two raters omitted due to missing
certainty data).
Clearly rating probability is much harder than
severity, at least for the threats in the present study.
Absolute agreement values for the inter-rater
reliability of probability are slightly lower than those
for consistency agreement, although CIs overlap.
Thus, raters seem to treat the scale similarly, without
additive bias.
3.1 Cognitive Load and Uncertainty
There was no support for H5, even at the p < 0.100
level. Meanwhile, raters with higher certainty in
their severity ratings on the descriptive questionnaire
rated severity higher. The half of the respondents
with higher certainty, had a mean severity rating of
0.008 to 1.282 (95% CI, measured by the
independent t-test with equal variance not assumed,
i.e. a Welch test) higher than the half of the
respondents with low certainty of severity ratings.
As illustrated by Figure 2, standard deviations
were also higher for more certain raters (p = 0.078 in
Levene’s test of homogeneity). This may be
interpreted as the less certain being more prone to
keep their ratings to the middle of the scale, while
those with confidence are certain enough to use
more of the scale. Since increased severity is
connected to a likely increase in protection cost, and
individuals uncertain in valuations typically want to
spend less (Champ et al., 2009), it is natural that the
less certain here also have slightly lower mean
severity ratings. However, there was no significant
correlation between uncertainty and difficulty,
which could have supported this, nor any significant
correlation between uncertainty and expertise.
There was no correlation between the severity
ratings and the certainty of the same for the
structured method, nor any correlation on either
questionnaire for probability and certainty of
probability ratings. Importantly, there was no
support for the hypotheses (H2 and H4) that the
structured method would result in lower uncertainty
for each of the severity and probability ratings (a t-
test saw p = 0.821 for the mean method difference
for severity and p = 0.863 for probability). Possibly
an order effect concerning which questionnaire the
respondents started with played a part. But if that
was the case, then it was only to the detriment of the
hypotheses (see also 3.3 Order effects).
3.2 Cognitive Style and Expertise
Cronbach's alpha for the eight cognitive style items
had 95% CI of 0.521 to 0.913, with only one item
having very low item reliability, which has not been
seen in similar studies (Karlzén et al., 2017;
Sommestad et al., 2017) and does not have any
major impact on the further analysis of the results.
The self-reported cognitive style of the
respondents varied only slightly with the average
rating for each respondent between 2.25 and 4.25
(mean for all respondents 3.58) for the five point
scale with higher numbers indicating a more logical
and less intuitive decision making style.
Cognitive style had no statistically significant
impact on inter-rater reliability. However, for
A Test of Structured Threat Descriptions for Information Security Risk Assessments
473

probability for the structured questionnaire, there
was an indication that more intuitive raters were
more inter-rater reliable, than logical raters were
with one another, and this is not due to using only
part of the scale (per Levene’s test).
There was an indication that respondents with a
more logical cognitive style were more prone to
taking longer answering (p = 0.089). Although not
statistically significant, it would make sense that gut
feeling produces quicker responses.
For the three expertise items, Cronbach’s alpha
had a highly satisfactory 95% CI of 0.779 to 0.969.
Average self-reported ratings for each respondent’s
expertise varied across the entire scale (1–5)
between respondents, with a mean of 2.4. Three
respondents rated their expertise particularly highly
(4.67, 4.67, and 5.00 respectively).
While expertise did not play any statistically
significant role when considering probability, it did
for severity. Table 3 compares the 95% CI of ICC
(single-measures) for severity of two different
groups: among the three raters scoring highest on
expertise on one hand; and among the rest on the
other. Since there were 14 respondents in total, the
second group is considerably larger and care should
be taken when interpreting any differences between
the groups. Nevertheless, for the structured method
the CIs overlap only very slightly and a t-test in fact
shows a significant difference (p < 0.05), with
experts being clearly more inter-rater reliable in this
case. There is also a hint that experts are better with
the structured method than the descriptive one, while
the reverse may be true for non-experts. This could
be important to keep in mind if one does not have
access to experts for one’s assessments and thus
adjust the method accordingly. Furthermore, it lends
support for hypothesis H1 in the case of experts.
Table 3: 95% CI of ICCs consistency single measures for
severity ratings grouped by experts/non-experts.
Questionnaire (severity)
Experts
Non-experts
Descriptive method
0.282–0.740
0.355–0.686
Structured method
0.420–0.811
0.141–0.449
Experts rated severity higher with the structured
method than the descriptive one (means 4.07; 3.55).
It should be noted that self-ratings of expertise can
be ambiguous, since experts are more humble about
their abilities (Dunning, 2011). There was no
correlation between expertise and time usage.
3.3 Order Effects
It is possible that one learns more from one type of
questionnaire. Indeed, starting with the descriptive
one led to much higher certainty of severity ratings
(0.440 to 2.760 out of maximal 7, 95% CI, p = 0.01,
adjusted for minimally missing data, using
independent samples t-test, equal variance not
assumed). This may be related to most respondents
(non-experts) being more inter-rater reliable (as per
the previous section) when using the descriptive
form, and starting with that one may heighten
certainty throughout. Still, there was no significant
correlation between certainty and expertise.
4 DISCUSSION
The results show that experts are more inter-rater
reliable than non-experts, when considering severity
ratings using the structured method. Furthermore,
our results hint at the structured method actually
being best for experts, and the descriptive method
being best for non-experts. Since the number of
respondents was fairly low, the results seem to
indicate a rather strong effect for expertise.
Furthermore, there may be other kinds of
experts, than those included here, who may be better
at parts of the assessments. One could include e.g.,
specialists in system engineering or business
executives who may have better grasp of overall
impact of the realization of a threat and the possible
organizational countermeasures that may be
employed. More training and education may also be
needed for risk assessments in general, to decrease
the impact of bias such as overestimating the
importance of fresh information, i.e. the availability
bias (Montibeller and von Winterfeldt., 2015).
Another aspect is that higher uncertainty in
measurements lead to threats being assessed as less
severe and likely. This may also be connected to the
fact that experts rated severities higher for the
structured method than the descriptive one.
The relationship between uncertainty and risk
aversion would be interesting to investigate.
Further, there was no significant correlation
between expertise and uncertainty. This may seem
counter-intuitive since there should be less
uncertainty in the ratings of experts. However, it is
common for experts to be more humble of their
skills than for non-experts to be the same, i.e. the
Dunning-Kruger effect (Dunning, 2011). This effect
may have skewed the uncertainty results and future
research should try to find a way to compensate for
ICISSP 2018 - 4th International Conference on Information Systems Security and Privacy
474

it. Moreover, it speaks against the simple idea of
letting respondents assess threats in an interval (as
an indication of the level of uncertainty for each
assessment, or at least of the overall assessments).
There may well be other aspects that differ
between respondents, such as their views, the
tendency to worry, long-term orientation, or
introversion. These aspects would be useful to study.
There was a surprising indication that
respondents more keen to use logic are less inter-
rater reliable than those relying on intuition. Thus, it
may be that raters need structured presentations of
threats, but will then proceed to always make an
immediate decision based on that presentation, or
waste time trying an explicit logical approach, as
supported by (Ashton et al., 2016). Indeed,
structuring in one’s head only, can lead to worse
results than applying intuition (Kleinmuntz, 1990).
It may be that the structured method was not
structured enough. For instance, it may be too coarse
to ask for overall severity, rather than separately for
its parts, such as threat agent capacity and asset
vulnerability. This would make raters explicitly rate
each part separately. Admittedly, more specific
threats likely make probabilities harder to assess.
For this reason, severity may need more structure
while probability less. Still, dependencies between
threats and recurring threats may complicate matters.
Another issue is whether scales should be
equidistant, or if e.g., the probability scales should
be more detailed at lower levels (as here). On the
one hand, lower probability threats are rifer; on the
other hand, they have less impact on overall risk.
Furthermore, the utility of inter-rater reliability
for probability and severity can only be established
depending on how useful the measurements are for
decisions about the cost-efficiency of possible
protective measures and the ultimate requirements
elicitation and system. The more useful the
assessments – the lower the inter-rater reliability is
likely to be, and the greater the need for specialists.
5 CONCLUSIONS
In conclusion, the hypotheses tested in this study
were not supported (at p < 0.05). Thus, no support
was found for structured methods resulting in
increased inter-rater reliability or certainty compared
to descriptive ones. Also, structured descriptions did
not result in any benefits considering the cognitive
load experienced by the participants.
Still, further analyses indicate that experts are
more inter-rater reliable with the structured method
rather than the descriptive one. Further, structure
makes experts’ significantly more inter-rater reliable
than non-experts, and comparably so to that of
experts in the intrusion detection domain (Holm et
al., 2014). The effect seems to be strong as it was
seen in a fairly small sample.
It seems promising to not only structure the
threats more, but also to force raters to rate each part
of the threat separately, achieving an even more
structured process. Connected to this, one could let
some kinds of experts, e.g. information security
specialists, take care of some kinds of partial threat
ratings (i.e. those closely related to the system), and
leave the rest to other experts, e.g., business
executives (who know more about consequences for
the organization as a whole). Furthermore, different
structures could be used for different experts, or a
more detailed structure for severity and less detail
for probability (which is low enough to begin with,
without needing a more fine-grained structure).
Non-experts seem to perform better with the
descriptive method and this should be considered
when experts are few, i.e. be wary of trying to
imitate the experts.
As less certain raters were more prone to rate
severity lower, the link between certainty and risk
aversion seems to hold an important piece of the
puzzle. This begs further research.
Even though expertise, cognitive style, and
uncertainty influence assessments, they do not seem
to be enough to explain all of the lacking inter-rater
reliability, at least not as operationalized here. For
example, some raters may not want to face the
reality of a threat, if the appropriate security
response would have an impact on their (bad) habits.
More importantly, subjective bias likely played a
role – as always. For instance, the Dunning-Kruger
effect may have skewed the certainty ratings.
Unfortunately it is not known how to mitigate bias.
Nevertheless, many suggestions have been made,
such as increasing training and education; rewarding
creativity; and – conversely to the approach of
lowering inter-rater reliability – using more than one
rater (Montibeller and von Winterfeldt, 2015).
There is good reason to be cautious when
interpreting, and relying on, ratings of severity and
probability. Structured methods show promise in
improving this, perhaps with even more structure.
Still, many things are not yet settled. Indeed, it is not
even clear that the typical scales and the overall
method are conducive to the main outcome of risk
analysis – choosing countermeasures.
A Test of Structured Threat Descriptions for Information Security Risk Assessments
475

REFERENCES
Abrahamsen, E.B., Røed, W, Jongejan, R., 2013. A
practical approach for the evaluation of acceptable risk
in road tunnels, Journal of Risk Research, Vol. 16,
Issue 5, pp. 625–633.
Allinson, C., Hayes, J., 1996. The Cognitive Style Index:
A Measure of Intuition-Analysis for Organizational
Research, Journal of Management Studies, Vol. 33,
Issue 1, pp. 119–135.
Champ, P.A., Moore, R., Bishop, R.C., 2009. A
Comparison of Approaches to Mitigate Hypothetical
Bias, Agricultural and Resource Economics Review,
Vol. 38, Issue 2, pp. 166–180.
Deleeuw, K., Mayer, R., 2008. A Comparison of Three
Measures of Cognitive Load: Evidence for Separable
Measures of Intrinsic, Extraneous, and Germane Load,
Journal of Educational Psychology, Vol. 100, Issue 1,
pp. 223–234.
Dunning, D., 2011. The Dunning-Kruger effect. On being
ignorant of one’s own ignorance, Advances in Experi-
mental Social Psychology, Vol. 44, pp. 247–296.
Gardoni, P., Murphy, C., 2013. A Scale of Risk, Risk
Analysis, Vol. 34, Issue 7, pp. 1208–1227.
Goerlandt, F., Reniers, G., 2016. On the assessment of
uncertainty in risk diagrams, Safety Science, Vol. 84,
pp. 67–77.
Hansson, S.O., Hirsch Hadorn, G., 2017. Argument-based
decision support for risk analysis, Journal of Risk
Research. (Accepted).
Hassenzahl, D.M., 2006. Implications of Excessive
Precision for Risk Comparisons: Lessons from the
Past Four Decades, Risk Analysis, Vol. 26, Issue 1, pp.
265–276.
Holm, H., Sommestad, T., Ekstedt, M., Honeth, N., 2014.
Indicators of expert judgement and their significance:
an empirical investigation in the area of cyber security,
Expert Systems, Vol. 31, Issue 4, pp. 299–318.
ISO/IEC, 2011. 27005 International Standard, Information
technology — Security techniques — Information
security risk management, ISO/IEC, 2nd edition.
ISO/IEC, 2012. 27032 International Standard, Information
technology — Security techniques — Guidelines for
cybersecurity, ISO/IEC, 1st edition.
Kahneman, D., Slovic, P., Tversky, A., (Eds.), 1982.
Judgments under uncertainty: Heuristics and biases.
Cambridge, England: Cambridge University Press.
Karlzén, H., Bengtsson, J.E., Hallberg, J., 2017. Assessing
Information Security Risks using Pairwise Weighting,
In Proceedings of the 3rd International Conference on
Information Systems Security and Privacy, ICISSP,
Vol. 1, pp. 318–324.
Kleinmuntz, B., 1990. Why we still use our heads instead
of formulas: Toward an integrative approach.
Psychological Bulletin, Vol. 107, Issue 3, pp. 296-310.
Lombard, M., Snyder-Duch, J., Campanella Bracken, C.,
2002. Content Analysis in Mass Communication:
Assessment and Reporting of Intercoder Reliability,
Human Communication Research, Vol. 28, Issue 4, pp.
587–604.
McShane, S., 2006. Activity 8.8: Decision Making Style
Inventory, In Canadian Organizational Behaviour,
McGraw-Hill Education.
Montibeller, G., von Winterfeldt D., 2015. Cognitive and
Motivational Biases in Decision and Risk Analysis.
Risk Analysis, Vol. 35, Issue 7, pp. 1230–1251.
Sommestad, T., Karlzén, H., Nilsson, P., Hallberg, J.,
2017. An empirical test of the perceived relationship
between risk and the constituents severity and
probability, Information and Computer Security, Vol.
24, Issue 2, pp. 194–204.
Trevethan, R., 2017. Intraclass correlation coefficients:
clearing the air, extending some cautions, and making
some requests, Health Services and Outcomes
Research Methodology, Vol. 17, Issue 2, pp. 127–143.
Wangen, G., 2016. An initial insight into Information
Security Risk Assessment practices, In Proceedings of
the Federated Conference on Computer Science and
Information Systems, ACSIS, Vol. 8, pp. 999–1008
Weinstein, N.D., 2000. Perceived probability, perceived
severity, and health-protective behavior, Health
Psychology, Vol. 19, Issue 1, pp. 65–74.
ICISSP 2018 - 4th International Conference on Information Systems Security and Privacy
476
