
Unsupervised Holiday Detection from Low-resolution Smart Metering
Data
G
¨
unther Eibl, Sebastian Burkhart and Dominik Engel
Center for Secure Energy Informatics, Salzburg University of Applied Sciences, Urstein S
¨
ud 1, 5412 Puch/Hallein, Austria
Keywords:
Privacy, Smart Grids, Smart Metering.
Abstract:
The planned Smart Meter rollout at a large scale has raised privacy concern. In this work for the first time
holiday detection from smart metering data is presented. Although holiday detection may seem easier than
occupancy detection, it is shown that occupancy detection methods must at least be adapted when used for
holiday detection. A new, unsupervised method for holiday detection that applies classification algorithms
on a suitable re-formulation of the problem is presented. Several algorithms were applied to a big, realistic
smart metering dataset that – compared to existing datasets for occupancy detection – is unique in terms of
number of households (869) and measurement duration (>1 year) and has a realistic low time resolution of
15 minutes. This allows for more realistic checks of seemingly plausible but unconfirmed assumptions. This
work is merely a first starting point for further research in this area with more research questions raised than
answered. While the results of the algorithms look plausible in a visual analysis, testing for data with ground
truth is most importantly needed.
1 INTRODUCTION
The large-scale usage of smart meters measuring
power consumption at high temporal resolutions
(compared to yearly measurements) has raised pri-
vacy concerns (Lisovich and Wicker, 2008). The
most broadly investigated approaches are NILM-
algorithms (Hart, 1992), (Zoha et al., 2012), (Kim
et al., 2011)) that aim at determining the appliance
use which is on one hand a valuable information for
commercial applications but on the other hand enable
attacks on privacy. NILM approaches typically as-
sume a higher time resolution than currently allowed.
Because their performance quickly degrades with de-
creasing time granularity (Eibl and Engel, 2015),
other analysis methods have recently been developed.
While (Buescher et al., 2017) laid the theoreti-
cal basis for the analysis of the privacy content of
aggregated data, other methods use the load curves
to directly determine the occupancy of the inhabi-
tants. Due to the absence of large-scale datasets, these
comparably young occupancy detection methods are
– compared to NILM algorithms – in a pre-mature
stage.
(Chen et al., 2013) developed a simple but ef-
fective, unsupervised rule-based algorithm using the
features average, standard deviation and range over a
time period of 15 minutes (with data being available at
a 1min resolution). It is also reasoned why NILM al-
gorithms are not thought to be suitable for occupancy
detection.
(Kleiminger et al., 2013) tested classification
methods that use similar features. For testing pur-
poses they especially created a dataset, called ECO,
that contains ground truth occupancy information.
Later these classification approaches were improved
in (Kleiminger et al., 2015), and several basic unsu-
pervised learning methods were compared for avail-
able datasets with ground truth information in (Becker
and Kleiminger, 2017).
(Tang et al., 2015) developed a method that uses
appliance knowledge (mean and standard deviation
of the power) and get appliance switching events
by mode state decoding. With a subsequent human
action recovery process and time-based association
rules, occupancy information is inferred.
Due to the fact that ground truth collection is dif-
ficult, (Jin et al., 2017) uses multi-view learning of
the time and power views and corrupted learning for
unsupervised situations, respectively. When a limited
amount of data is labeled, transfer learning of SVM
classifiers is applied.
(Akbar et al., 2015) use classification algorithms
for occupancy detection in a smart office scenario.
Eibl, G., Burkhart, S. and Engel, D.
Unsupervised Holiday Detection from Low-resolution Smart Metering Data.
DOI: 10.5220/0006719704770486
In Proceedings of the 4th International Conference on Information Systems Security and Privacy (ICISSP 2018), pages 477-486
ISBN: 978-989-758-282-0
Copyright © 2018 by SCITEPRESS – Science and Technology Publications, Lda. All rights reserved
477

(Hattori and Shinohara, 2017) tackled a prob-
lem arising when consumption values are measured
with both strong quantization (100Wh) and low time-
resolution (30min). They created a smoother con-
sumption curve that is better suited for subsequent oc-
cupancy detection.
While related papers deal with occupancy detec-
tion, to best of our knowledge holiday detection has
not been addressed so far. In this paper, a holi-
day is defined as a whole day with no one being at
home. Additionally, in this paper detection methods
are seen from a privacy perspective instead of aim-
ing at practical applications like energy management.
Therefore the problem is inherently unsupervised: it
is assumed that privacy-aware people do not deliver
ground truth information about their location which
explicitly excludes people with permanently activated
GPS on their smart phones.
Since privacy invasion is expected to be done on a
large scale, the robustness of detection approaches for
many households with different characteristics is im-
portant. All the methods for occupancy detection are
only tested on small datasets that include a limited
number of households for typically short periods of
time (see Table 1). Additionally, often the time reso-
lution is higher than for typical smart meter measure-
ments. This is important since a low time-resolution
decreases the utility of edge-detection for derivation
of on-off features (Eibl and Engel, 2015).
Table 1: Datasets used in the literature. N: number of
households, ∆t: measurement interval.
Name N Duration ∆t
Offices 1 1 month 0.1 s
Tang 1 1 month 0.1 s
Chen 2 summer 1 min
Chaney 1 1 month 5 min
ECO 6 8 months 1 s
This paper 869 1 year 15min
This paper is intended as a first, explorative step
for analyzing the possibility to find holidays from
low-resolution smart metering data. More specifi-
cally, the following contributions are made
• The difference between occupancy and holiday
detection problem is illustrated.
• A big, real dataset consisting of measurements of
859 households over slightly more than one year
is studied. Through descriptive analyses some
arising problems are pointed out.
• It is shown how an occupancy detection method
can be adapted for holiday detection.
• A new, unsupervised holiday detection method is
developed.
• The application of the algorithms on the dataset
raises many issues that need to be treated in future
research
The paper is organized as follows: in Section 2
background about the NIOM algorithm for occupancy
detection is given. Section 3 introduces the dataset
and illustrates some arising issues. In Section 4, dif-
ferent holiday detection methods are presented which
are applied on the dataset in Section 5. Finally, a con-
clusion and an outlook is given in Section 6.
2 BACKGROUND
In principle, a holiday detection method can be got
by applying an occupancy detection algorithm on a
whole day. A day is then designated a holiday, if the
occupancy detection algorithm states no occupancy
for the whole day, this approach is called the plug-
in-approach. In this section the unsupervised occu-
pancy detection algorithm NIOM (Chen et al., 2013)
will be described. In Section 4 it will be shown how
the plug-in version of NIOM can be obtained and how
the direct plug-in version can be improved.
2.1 NIOM
In the following part NIOM (Chen et al., 2013) is
described. Right before that it is important to men-
tion that the dataset there had a one-minute resolution
which is a factor 15 higher than for of the dataset of
this paper.
NIOM is a rather intuitive rule-based algo-
rithm. For each time point t, the past T points
{x
t−T +1
,. .., x
t
} are considered. Over this duration,
3 statistical features are calculated based on their in-
spection of their data: the average value M
t
, the stan-
dard deviation S
t
and the range (maximum-minimum)
R
t
.
For each time point, thresholds τ
M
, τ
S
, τ
R
for the
3 features are constructed. If the corresponding statis-
tic exceeds its threshold, the household is considered
as occupied (o
t
= 1), otherwise not (o
t
= 0). A fourth
version combines the three features and detects occu-
pancy, if any of these three criteria states occupancy.
This combined version leads to a considerable reduc-
tion in the false negative rate.
In order to fill short gaps between two time points
where the house is occupied, the full period between
two events will be considered as occupied if the time
interval between these events is smaller than 1 hour.
ICISSP 2018 - 4th International Conference on Information Systems Security and Privacy
478
Apr May Jun Jul Aug Sep Oct Nov Dec Jan Feb Mar Apr
1
3
5
7
9
11
13
15
17
19
21
23
Figure 1: Description of an ideal household consumption with one clear holiday.
Apr May Jun Jul Aug Sep Oct Nov Dec Jan Feb Mar Apr
1
3
5
7
9
11
13
15
17
19
21
23
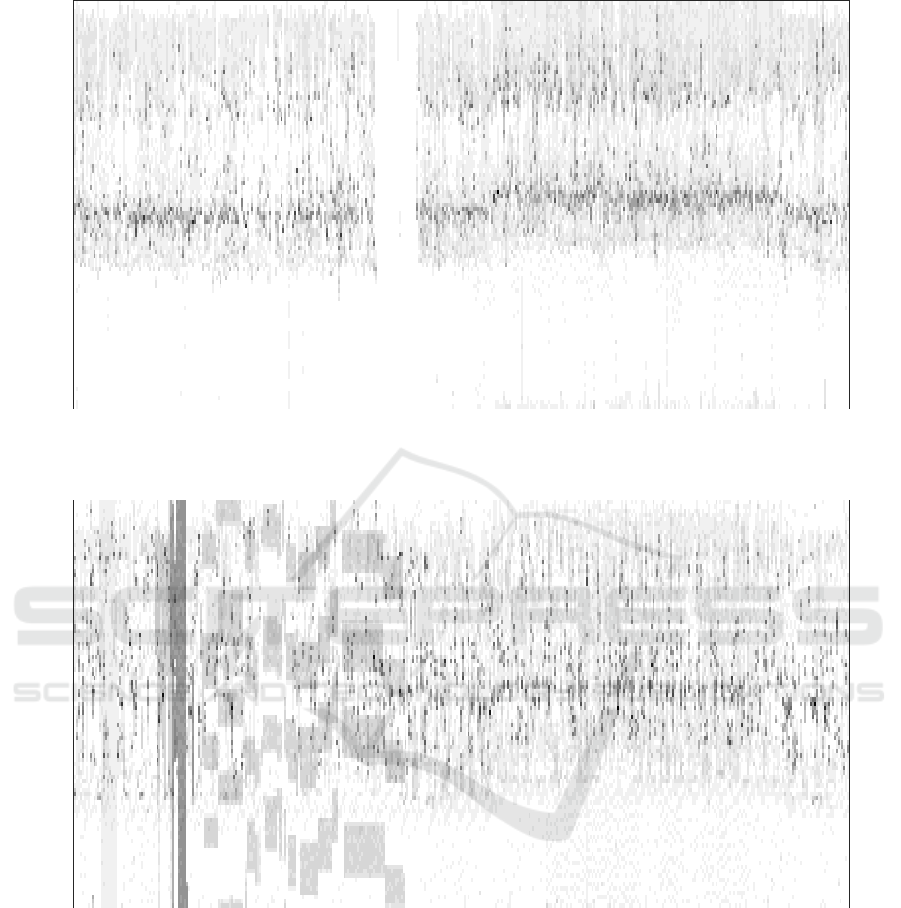
Figure 2: Background appliances and unexplained high consumption during different parts of the year.
This step is not important for holiday detection, since
for there the whole day is considered.
Finally occupancy is only directly estimated for
the daytime (6h-23h is used). The night time is con-
sidered as fully occupied, if an occupancy occurred
during the previous evening.
While the night is not directly analyzed with re-
spect to occupancy, the values measured at night are
used in order to derive the thresholds. More pre-
cisely, the maximum of the corresponding statistics
of the previous night (1h-4h) is used as a thresh-
old τ
M
, τ
S
, τ
R
. The analysis of a limited number
of households already revealed that the results are
very sensitive to the choice of the thresholds. As it
is shown in the next section, using a day-dependent
threshold is certainly required. It is also worth men-
tioning at this stage that it is a good idea to leave a
time gap between the definition of day time and night
time.
Unsupervised Holiday Detection from Low-resolution Smart Metering Data
479

3 DATA ANALYSIS
3.1 Dataset
In this paper, a dataset from 869 households in Upper
Austria is analyzed. The consumption of each house
is obtained over a period of 395 days measured at a
time interval of 15 minutes. In Austria 15 minutes is
currently the minimal allowed measurement interval.
In addition to the consumption values, through a poll
additional information about the households like the
number of inhabitants were gathered. The large size
of the dataset enables a well-founded check of com-
mon assumptions.
3.2 Descriptive Analysis
The intuition behind most analyses can be explained
by means of Figure 1 which shows a seemingly typ-
ical household with largest consumption at noon and
in the evening at a lunch time which is common in
Austria. A long holiday in September can be easily
be detected. The consumption during night always
remains at a very low level.
While finding the holiday for such a household is
simple, this is in many cases more complicated. As
it has already been done for NIOM it is desirable to
set the thresholds dynamically, i.e., for each day sep-
arately. The need for this can be clearly shown in
Figure 3 which shows the maximum during the night
hours for another household.
50 100 150 200 250 300 350
Day
0
0.5
1
1.5
2
2.5
Night values
Figure 3: Season-dependency of maximum night power.
The curve definitely does not show a single back-
ground level with some noise added. In order to get
smooth, day-dependent maxima, one could estimate
the upper hull. While not only the maxima depend on
the day, also the deviation of the maxima from day
to day highly depends on the day of the year. Look-
ing at the reason for this behavior, Figure 2 shows
that an automatic appliance is responsible for the sec-
ond largest night maxima. A reasonable approach
would consist of pre-filtering such appliances which
is planned as one of the next steps the future and not
part of this first, explorative work. Even after having
them filtered out, the highest maximum whose source
is unknown remains there. It should be noted that
this household is not a single exception, also for other
households unexplained phenomena like this occur.
4 HOLIDAY DETECTION
METHODS
4.1 Holiday Detection
Holiday detection is similar to occupancy detection
and seemingly easier than occupancy detection. In-
stead of estimating the occupancy o
i
d,t
for household i
for each point in time t of day d, only the information
h
i
d
, if a whole day d of a household i is a holiday or not
is considered. In this paper, a holiday can explicitly
also be a single day.
Occupancy detection algorithms typically apply a
night heuristic which estimates occupancy at night,
if there has been occupancy during evening. In con-
trast, for holiday detection night values must be ex-
plicitly considered because high night values arising
e.g. from a kettle can by themselves turn a day into a
not-holiday.
Since the time interval is rather large, appliances
are not likely to be detectable by the consideration of
appliance-specific turn-on or turn-off events. Instead
the distibution of the consumption values of a day can
be described by percentiles. Some households have
higher occupancy during the day than others so the
choice of the right percentiles may be dependent on
the household. Without having performed extensive
experiments, first results confirm the intuitive hypoth-
esis that the maximum is the most important quantile
of the day distribution for holiday detection.
Next, three ways how holidays could be de-
tected are outlined. This also illustrates the kind of
choices that need to made. The first algorithm is
plugin-NIOM, where the occupancy detection algo-
rithm NIOM is directly applied. The second algo-
rithm, which is called MaxOnly since it only uses
maximum statistics, is essentially plugin-NIOM with
a small but important improvement. The third, com-
pletely new algorithm logReg can use more quantiles.
Two variations of this algorithm – one using only the
maximum and the other uses more quantiles – are
studied later.
4.2 Plugin-NIOM
In principle any algorithm for occupancy detection
can be applied to holiday detection. The application
is relatively straightforward: (i) use the occupancy
ICISSP 2018 - 4th International Conference on Information Systems Security and Privacy
480
Apr May Jun Jul Aug Sep Oct Nov Dec Jan Feb Mar Apr
1
3
5
7
9
11
13
15
17
19
21
23
Apr May Jun Jul Aug Sep Oct Nov Dec Jan Feb Mar Apr
Day
0
0.5
1
Maximum value [kW]
Day
Night
Threshold
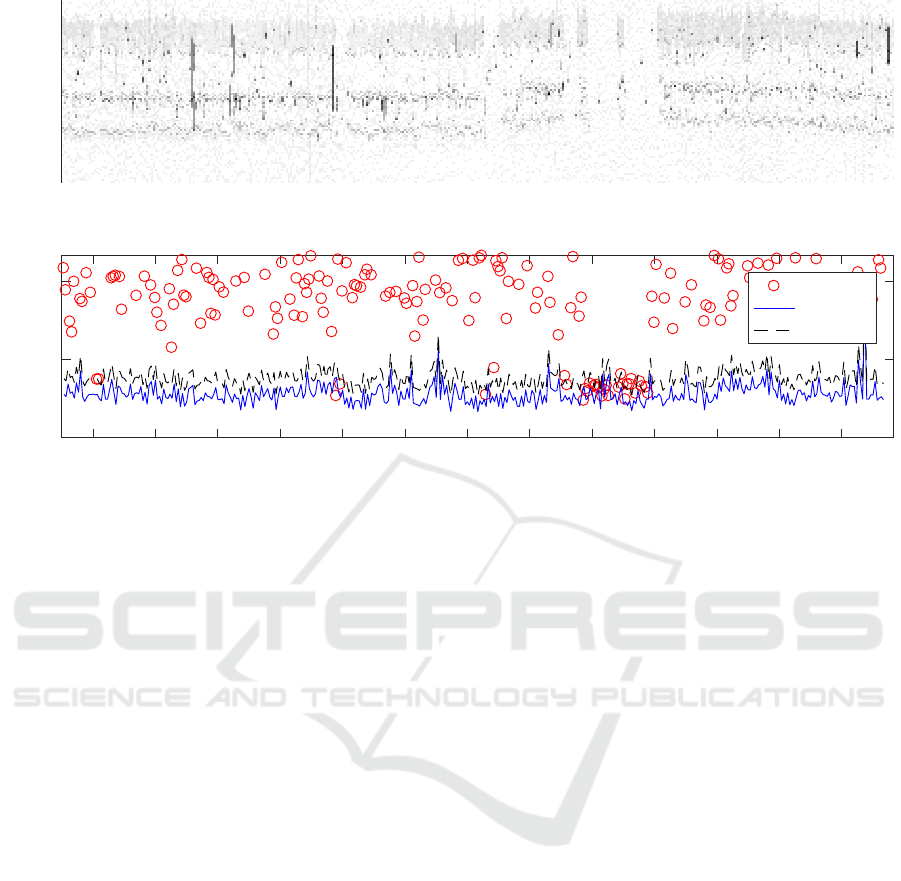
Figure 4: Application of MaxOnly: red circles: day values, blue curve: night maximum, black, dashed curve: threshold.
detection method to estimate the occupancy o
i
d,t
for
household i for each point in time t of day d; (ii) As-
suming a perfect estimation o
i
d,t
∈ 0,1 consequently
day d is determined as a holiday, if it is unoccupied
for each time t of day d, i.e.
h
i
d
=
(
1 ∀t : o
i
d,t
= 0
0 ∃t : o
i
d,t
= 1
In this paper, this approach was applied to NIOM.
However, they had a time resolution of 1 minute and
in their experiments T was set to 15 which corre-
sponds to a duration of 15 minutes which is just our
time interval. Instead of three features maximum,
standard deviation and range of the 15 values, here
only one value for this duration is available due to our
smaller time resolution. So in contrast to NIOM there
is no choice of the statistic for a 15 minute interval:
one can just take the value itself.
In NIOM, the night is considered as occupied if the
evening of the previous day d − 1 is occupied, so in
this case day d can not be a holiday! In this work, this
assumption is therefore not used. It remains that a day
is never occupied, if no consumption during day time
(D = [6h, 23h]) is higher than τ which is the maxi-
mum at night time (N = [1h, 4h]).
4.3 MaxOnly: Improved Plugin-NIOM
Stated in another way NIOM considers a day to be a
holiday, if the maximum during day time is lower than
the maximum during night time. From this formula-
tion it follows that Plugin-NIOM will tend to under-
estimate the number of holidays: In a simple model
for a holiday all values of the day are modeled as
being sampled from a normal distribution with given
background value µ and noise σ. In this model it is
more likely (probability p = 12/15) that the maxi-
mum occurs in the longer day period 6h-23h than in
the shorter night period 1h-4h. In this likely case the
holiday is not predicted as a holiday by NIOM which
consequently leads to a low true positive rate.
The same simple model offers a possible solution.
Comparing the day values with e.g. µ + 4σ would de-
clare only Φ
−1
(4) ≈ 0.01% of the day values as indi-
cating a not-holiday. However, it can not be done ex-
actly that way this since the model is too simple as it
does not take into account the day dependency of the
night values which has been demonstrated in Section
3. Instead, the maximum day value is not compared
with the maximum night value but with the maximum
night value plus a tolerance value δ. In the experi-
ments δ was crudely set to 0.1 kW considering values
of 25W as typical background noise. While this is not
expected to lead a high performance algorithm it can
serve as a first, simple baseline method.
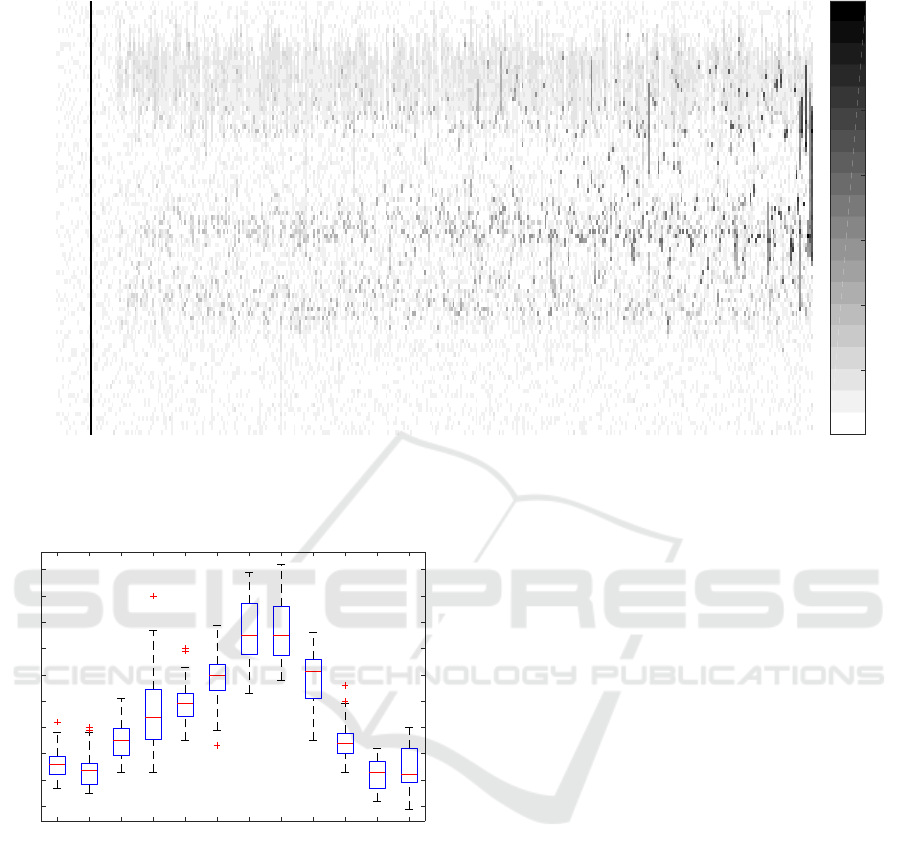
The method is illustrated in Figure 4: In the lower
panel a day where a single day value is below the
threshold line is detected as a holiday (day values are
marked as red circles, the black, dashed threshold line
is 100W above the blue night maximum). For a com-
Unsupervised Holiday Detection from Low-resolution Smart Metering Data
481

parison the upper panel shows the heatmap of all mea-
sured values. While longer holidays can be visually
confirmed, a confirmation can not be done for single-
day-holidays. Section 5 shows how one could try to
validate the result. It should be noted that Figure 4
shows only a rather small fraction of day values, the
bulk of day values is above the upper limit of the y-
axis.
4.4 Logistic Regression based
Algorithm
Figure 4 shows some day values that are just above the
threshold line. In the approach above, the decision is
strictly binary, for ambiguous cases a measure of con-
fidence in the prediction would be desirable. With this
probability one could distinguish days that are quite
surely not holidays, days that are maybe holidays and
quite sure holidays.
The key idea is re-formulating the holiday detec-
tion problem as follows: a holiday is a day where both
the distribution of day values AND the distribution of
night values resemble the night value distribution. In
order to assess the similarity to the night values, for
each household a classifier must be trained that takes
a set of measurements and outputs the probability that
the set of measurements are night measurements (Ta-
ble 2). The measurements of a household are first di-
vided into the day and night values.
Their distributions are described by several quan-
tiles that are the features used by the classifier. For ex-
ample, the 25%, 50%, 75% and 99.9% quantile can be
computed for of the set of measured day and the set of
measured night values, respectively. The 99.9% quan-
tile is used since the maximum is expected to have a
high discriminative power. This is not so clear for the
other quantiles. In a first attempt to assess the differ-
ences, two sets of quantiles were used: logReg (max)
uses only the 99.9% quantile as feature for the clas-
sifier while logReg (more quantiles) uses the set of
quantiles above. For sake of simplicity the training
part in Table 2 is formulated for logReg (max) with
q
Q
denoting the quantile function that gives the Qth
quantile of a set of values. The feature vector charac-
terizing the day values is labeled 0, the feature vector
for the night value is labeled 1.
Using these training data, a classifier can be
trained. In this paper, because of its wide-spread use,
simplicity and probability output logistic regression
is used as the classifier, but in principle any classifier
could be used.
Having trained the classifier, one now can predict
if a day is a holiday using the re-formulation which
is mathematically a joint probability (see Table 3).
Table 2: Training part of algorithm logReg (max).
Output: one classifier f
i
per household i
For all days d of household i:
• Initialization: X
i
=[]
• Separate the measurements of a day d into sets of
day and night values, i.e.,
S
i,day
d
= {x
i
d,t
; t ∈ D} and S
i,night
d
= {x
i
d,t
; t ∈ N }
• Get features: X
i,day
d
= q
99.9
(S
i,day
d
) and
X
i,night
d
= q
99.9
(S
i,night
d
).
• Add two lines to X, where the last coordinate is
the label y
X
i
= X
i
∪ (X
i,day
d
,0) ∪ (X
i,night
d
,1)
• Train a logistic regression classifier f
i
using X
i
Treating day values S
i,day
d
and night values S
i,night
d
as
realizations of independent random variables the joint
probability p
i
d
is the product of the two probabilities
for the two events that has been estimated by the clas-
sifier. In order to get a binary prediction h
i
d
∈ {0,1}
for comparisons with other methods a threshold τ
i
d
is
constructed as follows. Remember that a day is con-
sidered to be holiday if a day is considered as a hol-
iday, i.e. y
i,day
d
> τ
1
and y
i,night
d
> τ
2
. Both, τ
1
and
τ
2
are heuristically chosen as a rather small value that
were gathered from the night values, more precisely
τ
1
= τ
2
= q
25
( f
i
(S
i,night
d
)).
The definition of night and day depending on time
of the day is the same as for NIOM (D = [6h, 23h],
N = [1h, 4h]). Another definition using all values
of a day would be possible where for example night
values are values measured between 23h and 6h. In
preliminary trials this variant showed less clear re-
sults which may be explained by variations between
people. While some people already have low con-
sumption after 23h, some others still have consider-
able consumption during this time. So the time of day
between 23h and 1h, and also the time between 4h and
6h can not be safely considered as day or night for all
people.
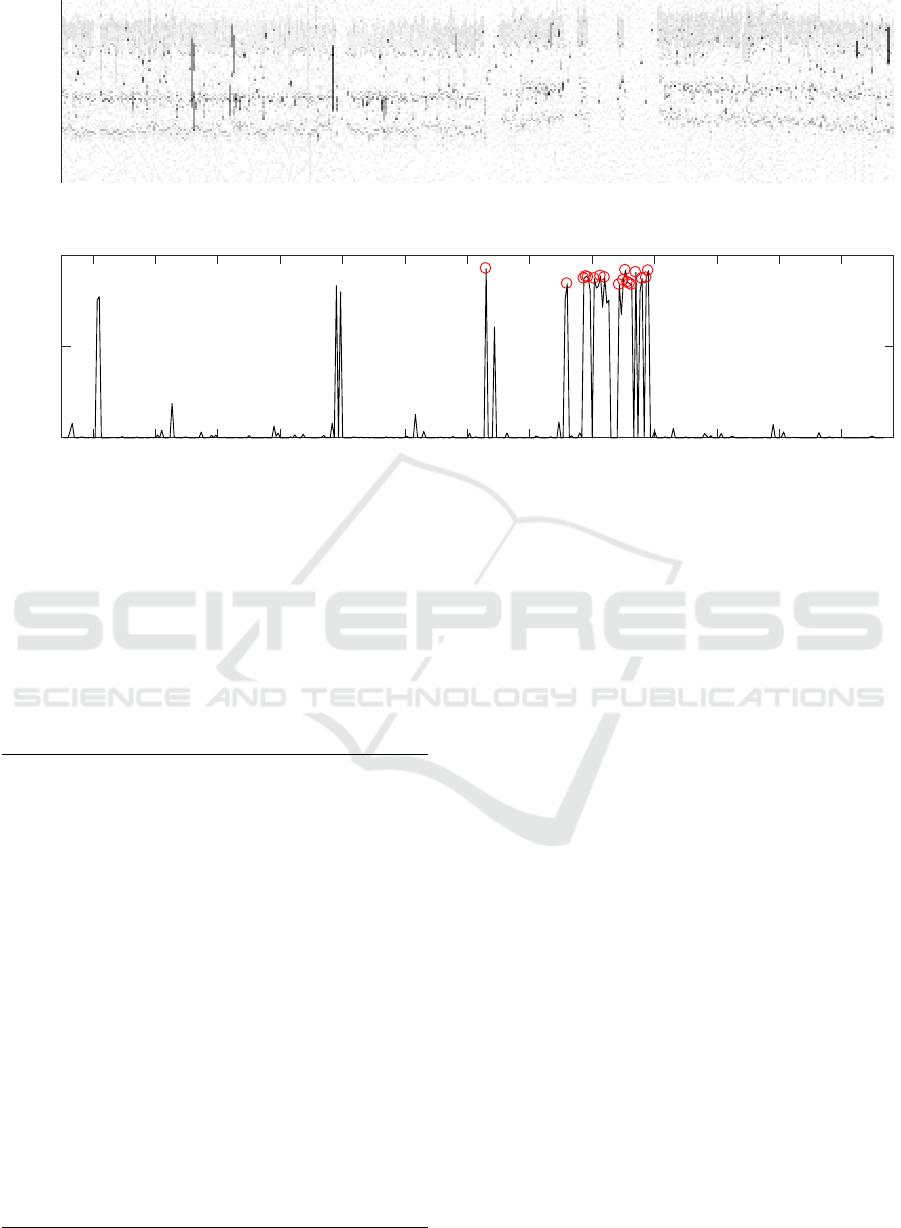
While the resulting probability looks plausible
(Figure 5), no ground truth is available, so some
means of validation are required. The estimation of a
probability offers one way: sorting the classified days
d of a household i by their estimated probability p
i
d
of
being a holiday and visualizing the values using the
heatmap can enable humans to find possible miscon-
ICISSP 2018 - 4th International Conference on Information Systems Security and Privacy
482
Apr May Jun Jul Aug Sep Oct Nov Dec Jan Feb Mar Apr
1
3
5
7
9
11
13
15
17
19
21
23
Apr May Jun Jul Aug Sep Oct Nov Dec Jan Feb Mar Apr
0
0.5
1
P(holiday)
Figure 5: Application of logistic regression: bottom: estimated probability for a holiday, red circles: estimated holidays.
ceptions in this early stage of research. An example
for such a plot is shown in Section 5 (Figure 9).
While here the classifier can only be applied to
past data, it could be used to predict holidays for fu-
ture time periods after all the measurements of the
corresponding day are available.
Table 3: Prediction part of algorithm logReg (max).
Output: soft and hard prediction p
i
d
and h
i
d
• As in the training part, separate the measurements
of day d of household i into sets of day and night
values and get features but no labels .
• Evaluate the classifier f
i
for day and night values
y
i,day
d
= f (X
i,day
d
) and y
i,night
d
= f (X
i,night
d
).
• Calculate the probability for day d to be a holiday
p
i
d
= y
i,day
d
· y
i,night
d
.
• Determine the threshold τ
τ
i
d
=
q
25
( f
i
(S
i,night
d
))
2
• Binary holiday evaluation
h
i
d
=
(
1 p
i
d
> τ
i
d
0 p
i
d
≤ τ
i
d
5 APPLICATION OF DETECTION
METHODS
5.1 Comparison of Algorithms
In this section the different algorithms are applied
to the dataset. The investigated algorithms are
Plugin-NIOM, MaxOnly, logReg (max) and logReg
(more quantiles) with 99.9% and (25%, 50%, 75%,
99.9% quantiles describing the distribution of mea-
surements, respectively
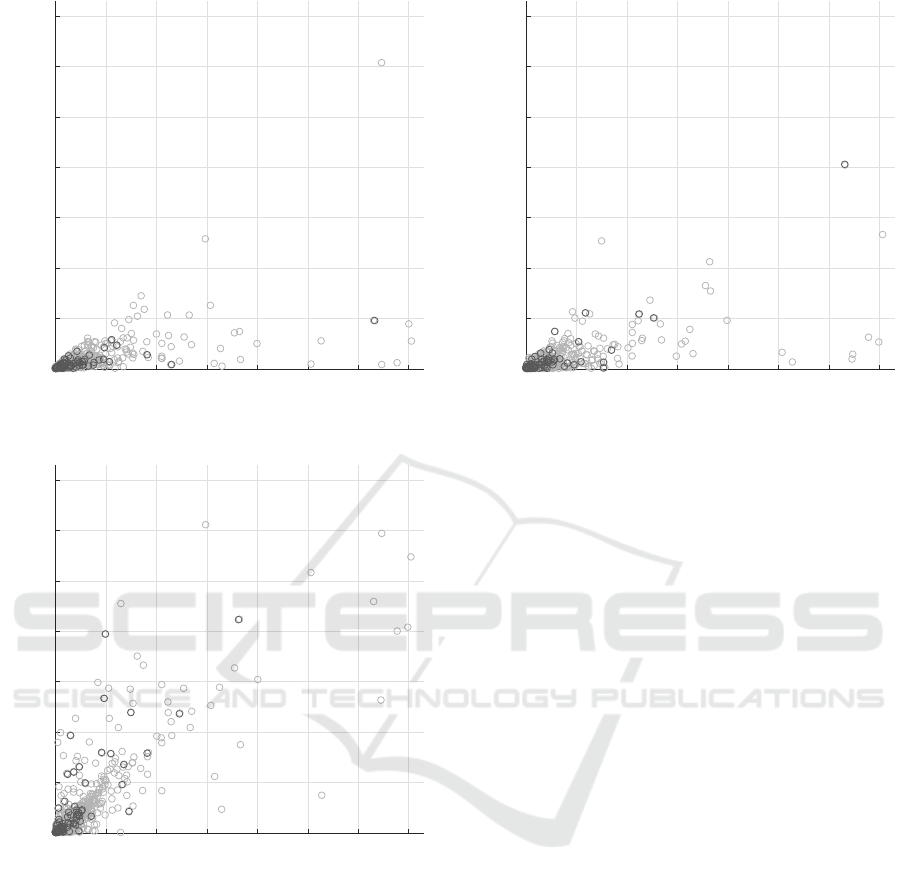
The first comparison is made between Plugin-
NIOM and its noise-tolerant version MaxOnly.
Plugin-NIOM detects considerably fewer holidays
than MaxOnly which can be seen in Figure 6. There
each point shows the estimated number of holidays
of a household. This behavior is as expected and ex-
plained in Section 4.3.
The next comparison (Figure 7) is done between
MaxOnly and the logistic regression approach that
only uses the 99.9 quantile as the feature character-
izing a distribution. While overall the two methods
seem to estimate the same amount of holidays, for
particular households the difference in the prediction
can be huge. Since both methods only use maxima
as features we suppose that the very different way the
problem is modeled and thresholds are constructed is
responsible for these differences. With respect to pri-
vacy, the difference between these two methods could
serve as a first means to estimate the plausibility of
Unsupervised Holiday Detection from Low-resolution Smart Metering Data
483
0 50 100 150 200 250 300 350
Number of holidays MaxTol
0
50
100
150
200
250
300
350
Number of holidays NIOM
Figure 6: Comparison of NIOM with MaxTOL.
0 50 100 150 200 250 300 350
Number of holidays MaxTol
0
50
100
150
200
250
300
350
Number of holidays logReg (max)
Figure 7: Comparison of MaxTOL with logReg (max).
the result.
Finally it can be assessed, how the effect of the
representation of the distribution of values using dif-
ferent quantiles affects the result (Figure 8).
The difference in the predictions is much bigger
than expected: using more quantiles leads to con-
sistently fewer predicted holidays. This result may
indicate that indeed the high quantiles characterize
a holiday better than the low quantiles: considering
a household with low average occupancy during the
day, the 25% and 50% quantiles during the day re-
semble more the corresponding quantiles of the night
values. A more detailed investigation of this behavior
is left for future research.
0 50 100 150 200 250 300 350
Number of holidays logReg (max)
0
50
100
150
200
250
300
350
Number of holidays logReg (more quantiles)
Figure 8: Comparison of results when using different fea-
tures for logistic regression.
5.2 Validation
Since the dataset is unsupervised, no clear perfor-
mance measures can be given. Instead, as suggested
in Section 4.4, a heatmap visualizing the measured
values with days sorted by decreasing probability can
help in finding unplausible results. Such a heatmap is
shown in Figure 9 for the same customer as used in
Section 4. There, the black vertical line separates the
predicted holidays (left) from not-holidays (right).
While the order of the days looks plausible, the
figure suggests that the number of predicted holidays
may be too small in this case: several days to the right
of the black line look as the ones to the right. Also
the bottom panel of Figure 5 suggests that some more
days are holidays. So there seems to be room for im-
provement in the choice of the threshold. While one
could also inspect the original heatmap for plausibil-
ity of the result, due to the high number of days and
the corresponding low resolution the original heatmap
is only suitable to detect holiday periods longer than
one day.
These validation plots were investigated choos-
ing different samples of households, e.g., households
with a high number of predicted holidays where the
result of the method was confirmed by the valida-
tion plots. Interestingly, such investigations suggest
some targets for privacy investigations: for example,
households with many holidays could be considered
as candidates for illegal, secondary residence. Illegal
secondary residences are a problem in highly-touristic
areas, where prices for flats are becoming hardly af-
fordable for locals.
ICISSP 2018 - 4th International Conference on Information Systems Security and Privacy
484
50 100 150 200 250 300 350
Days
1
3
5
7
9
11
13
15
17
19
21
23
Daytime
Number of holidays: 18
0.5
1
1.5
2
2.5
3
Figure 9: Validation plot: sorting days by decresasing probability to be a holiday; black line: threshold.
Jan Feb Mar Apr May Jun Jul Aug Sep Oct Nov Dec
Month
20
30
40
50
60
70
80
90
100
110
Number of holidays
Figure 10: Dependency of holidays on the month.
Finally, one can compare the results with other in-
formation that is available. While no dependency of
the number of holidays on the day of the week or the
income group could be seen, a clear dependency on
the month of the year can be seen in Figure 10, which
shows the number of holidays of all households de-
pending on the month.
A higher number of holidays in summer as shown
in Figure 10 is plausible and expected and therefore
a sign that the result is plausible. However, this de-
pendency on the season may in principle also stem
from the time-dependency of automatic appliances
such as heating in winter or the usage of pools dur-
ing summer. This result would have more impact if it
also holds after automatic appliances such as the one
demonstrated in Figure 2 are removed in a preprocess-
ing step.
6 CONCLUSION AND OUTLOOK
To best of our knowledge, this case study addresses
the problem of unsupervised holiday detection from
energy consumption data for the first time. The avail-
able dataset is the first realistic (in terms of num-
ber of households and measurement duration) smart
meter dataset that is analyzed using occurrence or
holiday detection methods. This enables the check
of plausible assumptions that exist in the literature:
some exemplary households were presented in order
to discuss issues like background appliances, day-
dependent background signal characteristics or the
existence of unplausible values. The methodologi-
cal part showed that a straightforward plugin-version
of occurrence detection methods can lead to wrong
results but a simple ad-hoc solution could given at
least for NIOM. Using a reformulation of the holiday
detection problem as a classification problem a new,
dedicated holiday detection method is presented.
The unexpectedly large differences between the
results of the detection methods indicate that holiday
detection is not as simple as one might think. While
an inspection of the validation plots showed plausi-
Unsupervised Holiday Detection from Low-resolution Smart Metering Data
485

bility of the results, the choice of the thresholds and
the choice of the right features is critical but hard to
achieve in general. While one reason might be the
absence of ground truth information another reason
might be the diversity of the consumption patterns of
the households.
This work sets the starting point for holiday detec-
tion and raises a number of technical issues for future
work: modeling and removal of background appli-
ances, choice of thresholds, feature selection, proper
modeling and smoothing of the day-dependent night
distributions, inclusion of other predictive variables
like day of the week and of course evaluation for la-
beled datasets.
Considering the privacy perspective it would be
interesting to investigate possible privacy conse-
quences apart from the detection of secondary resi-
dences.
ACKNOWLEDGEMENTS
The financial support by the Austrian Federal Min-
istry of Science, Research and Economy, the Aus-
trian National Foundation for Research, Technology
and Development and the Federal State of Salzburg is
gratefully acknowledged.
REFERENCES
Akbar, A., Nati, M., Carrez, F., and Moessner, K. (2015).
Contextual occupancy detection for smart office by
pattern recognition of electricity consumption data. In
IEEE International Conference on Communications,
pages 561–566.
Becker, V. and Kleiminger, W. (2017). Exploring zero-
training algorithms for occupancy detection based on
smart meter measurements. Computer Science - Re-
search and Development, pages 1–12.
Buescher, N., Boukoros, S., Bauregger, S., and Katzen-
beisser, S. (2017). Two Is Not Enough: Privacy As-
sessment of Aggregation Schemes in Smart Meter-
ing. Proceedings on Privacy Enhancing Technologies,
2017(4):118–134.
Chen, D., Barker, S., Subbaswamy, A., Irwin, D., and
Shenoy, P. (2013). Non-Intrusive Occupancy Moni-
toring using Smart Meters. In Proceedings of the 5th
ACM Workshop on Embedded Systems For Energy-
Efficient Buildings - BuildSys’13, pages 1–8.
Eibl, G. and Engel, D. (2015). Influence of Data Granularity
on Smart Meter Privacy. IEEE Transactions on Smart
Grid, 6(2):930–939.
Hart, G. W. (1992). Nonintrusive appliance load monitor-
ing. Proceedings of the IEEE, 80(12):1870–1891.
Hattori, S. and Shinohara, Y. (2017). Actual Consumption
Estimation Algorithm for Occupancy Detection using
Low Resolution Smart Meter Data. In Proceedings of
the 6th International Conference on Sensor Networks
- SENSORNETS, pages 39–48.
Jin, M., Jia, R., and Spanos, C. (2017). Virtual Occu-
pancy Sensing: Using Smart Meters to Indicate Your
Presence. IEEE Transactions on Mobile Computing,
16(11):3264–3277.
Kim, H., Marwah, M., Arlitt, M. F., Lyon, G., and Han,
J. (2011). Unsupervised Disaggregation of Low Fre-
quency Power Measurements. In The 11th SIAM In-
ternational Conference on Data Mining, pages 747–
758.
Kleiminger, W., Beckel, C., and Santini, S. (2015). House-
hold Occupancy Monitoring Using Electricity Meters.
In Proceedings of the 2015 ACM International Joint
Conference on Pervasive and Ubiquitous Computing,
pages 975–986.
Kleiminger, W., Beckel, C., Staake, T., and Santini, S.
(2013). Occupancy Detection from Electricity Con-
sumption Data. In Proceedings of the 5th ACM
Workshop on Embedded Systems For Energy-Efficient
Buildings - BuildSys’13, pages 1–8.
Lisovich, M. A. and Wicker, S. B. (2008). Privacy Concerns
in Upcoming Residential and Commercial Demand-
Response Systems. In Clemson Power Systems Con-
ference.
Tang, G., Wu, K., Lei, J., and Xiao, W. (2015). The meter
tells you are at home! Non-intrusive occupancy detec-
tion via load curve data. In 2015 IEEE International
Conference on Smart Grid Communications, (Smart-
GridComm), pages 897–902.
Zoha, A., Gluhak, A., Imran, M. A., and Rajasegarar, S.
(2012). Non-intrusive Load Monitoring approaches
for disaggregated energy sensing: A survey. Sensors
(Switzerland), 12(12):16838–16866.
ICISSP 2018 - 4th International Conference on Information Systems Security and Privacy
486
