
A Study on Calibration Methods for Infrared Focal Plane Array
Cameras
Rasim Caner C¸ alik, Emre Tunali, Burak Ercan and Sinan
¨
Oz
Software Design Department, ASELSAN Inc. Microelectronics, Guidance and Electro-Optics Division, Ankara, Turkey
Keywords:
Infrared Focal Plane Array, Non-uniformity Correction, Bad Pixel Detection, Bad Pixel Replacement.
Abstract:
Imaging systems that are benefiting from infrared focal plane arrays (IRFPA) inevitably suffer from some
visually unpleasant artifacts due to limits of detector materials and manufacturing processes. To address
these artifacts and benefit the most from IRFPAs, factory level calibrations become obligatory. Considering
nonlinear characteristics of infrared focal plane arrays, fixed pattern noise elimination, a.k.a. non-uniformity
correction (NUC), and bad pixel replacement are considered as the most crucial calibration processes for
capturing details of the scene. In this paper, we present two different NUC methods from two different families
(temperature and integration time based NUC), together with a bad pixel detection strategy in order to achieve
wide dynamic range and maximized contrast span.
1 INTRODUCTION
Infrared (IR) imaging systems are considered to be
functional and fruitful in various military and civil
applications (Gade and Moeslund, 2014). Even if
change in detector types and technologies is a ne-
cessity for measuring radiation levels from different
sections of IR spectrum, all IR imaging systems bene-
fit from infrared focal plane arrays (IRFPA). IRFPAs
consist of multiple independent detectors for scanning
the scene in image pixel form. Although usage of FPA
is a must for composing image, variations in characte-
ristics of each individual detector yields different re-
sponses to unit change in IR radiation. The mentioned
dissonance becomes apparent in form of spatial fixed
pattern noise (FPN) and degrades radiometric accu-
racy, temperature resolution and quality of composed
image (Milton et al., 1985). To compensate FPN, re-
sponses of all detectors must be calibrated in a way to
achieve the same digital intensity level for the same
amount of IR radiation and obtain the same effective
response for unit change in radiation. This calibra-
tion is referred as non-uniformity correction (NUC).
In NUC procedure, detector is assumed to have linear
response (although it is not, see Figure 1) to achieve
detector response characterization with two parame-
ters, gain and offset, for each pixel. Model of detector
response is described as follows:
S
i j
(φ) = K
i j
φ + Q
i j
(1)
where φ represents digital value measured from inci-
dent flux on detector at i
th
row and j
th
column. K
i j
is the gain coefficients of the characteristic curve and
Q
i j
is the offset coefficients. S
i j
is the resultant image
after NUC procedure. In other words, the goal of
NUC procedure is to find K
i j
and Q
i j
such a way that
each pixel should have the same effective response on
unit change in thermal radiation yielding S
i j
without
any fixed pattern noise degradation.
Although NUC procedure achieves uniformity of
pixels in general, usually some of the pixels (detec-
tors) cannot follow the same response curve with ot-
hers. These pixels generally have poor signal-to-noise
ratio comparing to average pixels and referred as bad
pixels. These pixels are observed in the composed
image in form of saturated or flickering pixels; and
can exist either individually or in cluster. As expected,
these pixels are nothing but defects and should be de-
tected and replaced to improve image quality. In or-
der to achieve bad pixel replacement (BPR); a factory
level bad pixel map (spatial locations of bad pixels)
disclosed by bad pixel detection (BPD) procedures,
together with a bad replacement scheme are requi-
red. Although literature includes various schemes for
BPR; simple methods including nearest neighborhood
(Isoz et al., 2005) and median algorithms (Celestre
et al., 2016) are the most frequently used solutions
in practice since BPR procedure should be conducted
online. On the contrary, BPD schemes utilized as fac-
tory calibration and generally performed offline with
Çalık, R., Tunali, E., Ercan, B. and Öz, S.
A Study on Calibration Methods for Infrared Focal Plane Array Cameras.
DOI: 10.5220/0006722402190226
In Proceedings of the 13th International Joint Conference on Computer Vision, Imaging and Computer Graphics Theory and Applications (VISIGRAPP 2018) - Volume 4: VISAPP, pages
219-226
ISBN: 978-989-758-290-5
Copyright © 2018 by SCITEPRESS – Science and Technology Publications, Lda. All rights reserved
219
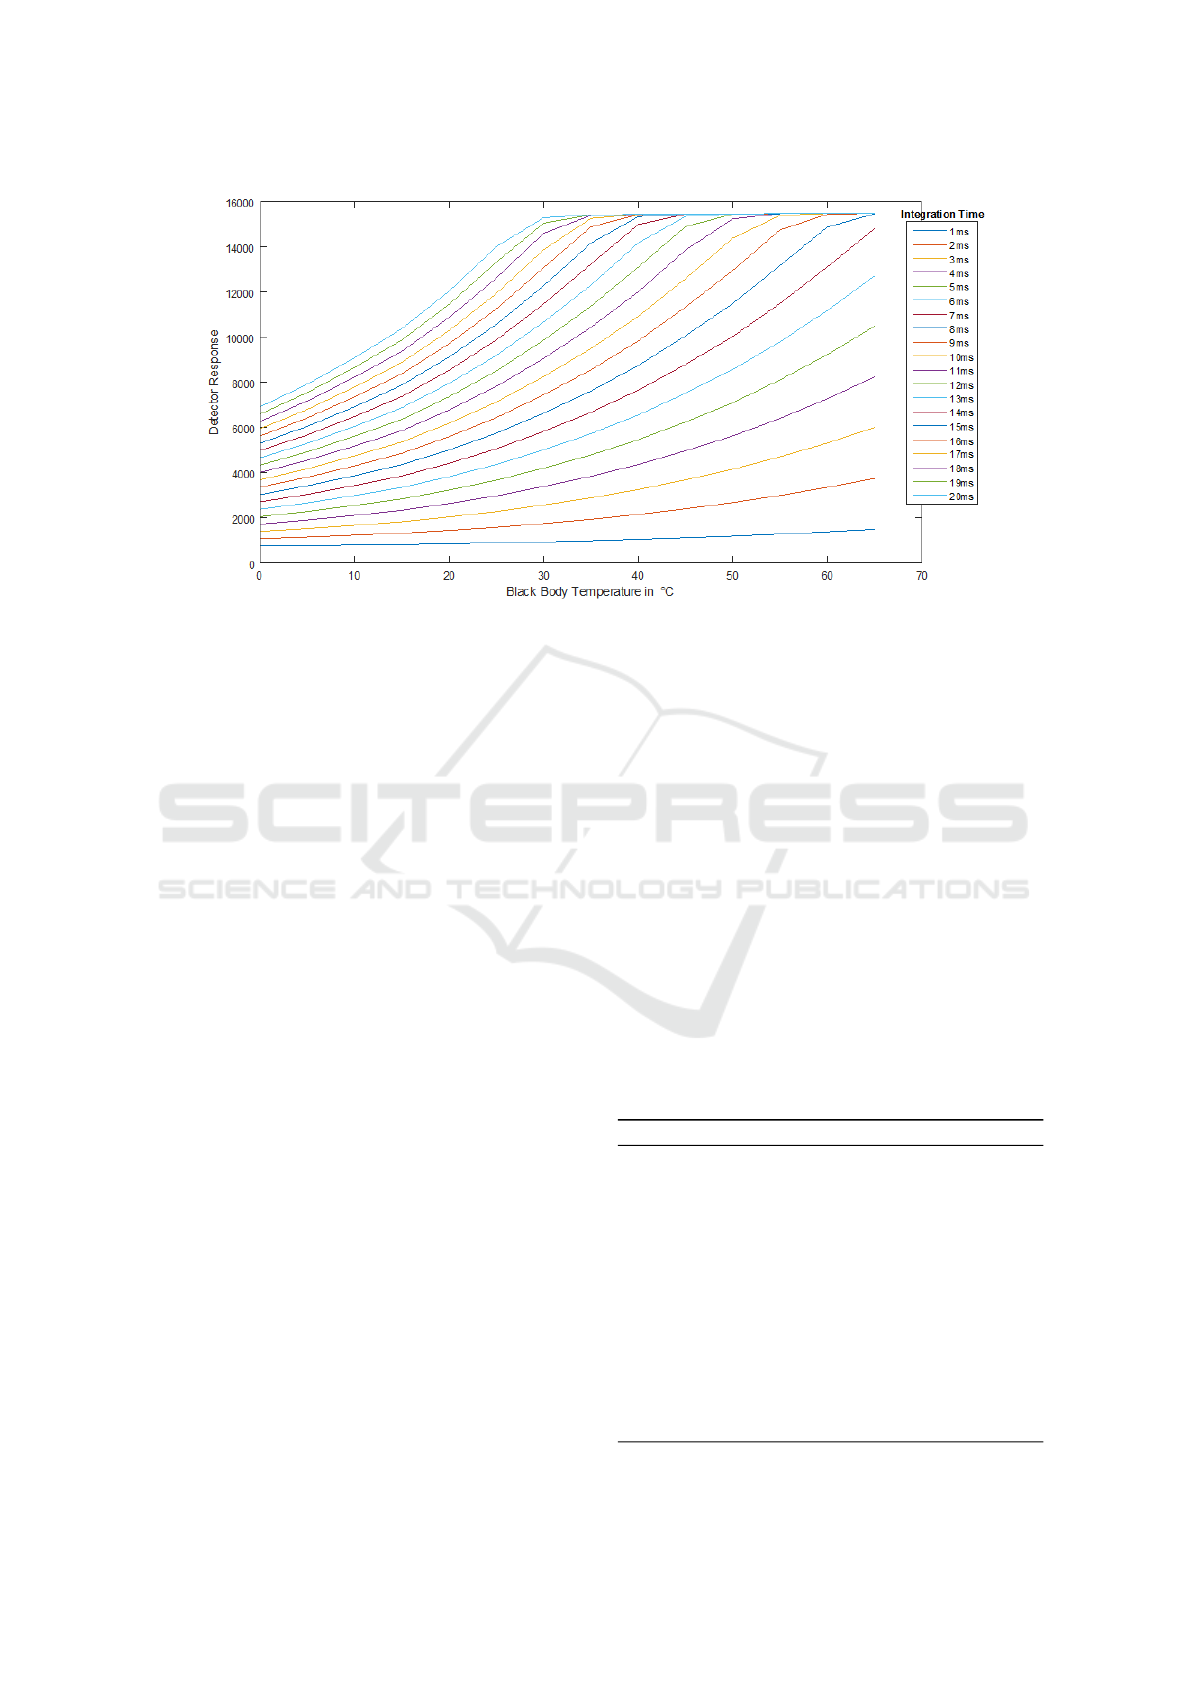
Figure 1: Examplary Characterization Curves of Detector Illustrating Non-linearities.
more complex and iterative solutions.
For factory level calibration of IR imaging devi-
ces, this paper presents two calibration based NUC
methodologies followed by an iterative bad pixel de-
tection algorithm based on responsivity and NETD
statistics of pixels. All procedures are tested on two
different IRFPAs that are Sofradir MWIR MCT and
QWIP (Altun et al., 2017) detectors. The remainder
of the paper is organized as follows: First, we re-
view related work in Section 2. Second, two different
calibration methodologies are introduced in Section
3. Then, the experimental results are presented in
Section 4, and followed by conclusions in Section 5.
2 RELATED WORK
Prior to operate any thermal imaging system on the
field, essential calibrations including non-uniformity
correction and bad pixel detection must be perfor-
med. Therefore, over the years, plenty of algorithms
on non-uniformity correction and bad pixel detection
are proposed in the literature.
Non-Uniformity Correction (NUC)
NUC procedures are categorized into two families
in the literature: calibration based (factory level) and
scene based (run-time) algorithms. Despite their sim-
plicity, calibration based methods generally achieves
satisfactory results without the need of online coef-
ficient calculation which is a critical advantage for
real-time low power systems. To be more specific,
this family estimates gain and offset values mentio-
ned in Eqn. 1 once through a calibration step at the
factory and stores them into the system as tables. The
most well-known and frequently used calibration ba-
sed NUC methods are single point (Ness et al., 2017)
and two point corrections (David L. Perry, 1993). In
single point correction, a uniformly distributed radia-
tion source is placed in front of IRFPA to estimate and
update offset values in an existing NUC table. Details
of single point NUC is given in Algorithm 1.
Two point correction achieves more successful re-
sults since it estimates both gain and offset coeffi-
cients of each pixel. For this estimation, two uni-
formly distributed radiation sources are required, ge-
nerally two uniform IR blackbody sources at different
temperatures. For each reference temperature, frame
averages of collected image sequences are used to es-
timate gain-offset coefficients (David L. Perry, 1993).
Two point correction method can be extended to
multi-point correction to interpret model non-linearity
in terms of piecewise-linear functions; hence achieves
Algorithm 1: Single Point NUC Procedure.
INPUT: ReferenceSet1: imSet
1
, maximum Offset:
O
max
, minimum Offset: O
min
1: msp
1
= mean2D(imSet
1
);
2: msptmp
1
= mean(msp
1
);
3: o = zeros(msp
1
.height,msp
1
.width)
4: rO f f = msptmp
1
;
5: for i = 1 : msp
1
.height do
6: for j = 1 : msp
1
.width do
7: o(i, j) = rO f f − msp
1
(i, j));
8: if (o(i, j) > O
max
) then o(i, j) ← O
max
9: if (o(i, j) < O
min
) then o(i, j) ← O
min
OUTPUT: Offset Table: o
VISAPP 2018 - International Conference on Computer Vision Theory and Applications
220

Algorithm 2: Two Point NUC Procedure.
INPUT: ReferenceSet1-2: imS et
1
− imSet
2
, Max-Min
Gain: G
max
− G
min
, Max-Min Offset: O
max
− O
min
,
1: msp
1
= mean2D(imSet1);
2: msp
2
= mean2D(imSet2);
3: msptmp
1
= mean(msp
1
);
4: msptmp
2
= mean(msp
2
);
5: rGain = msptmp
1
/msptmp
2
;
6: g = ones(msp
1
.height,msp
1
.width)
7: o = zeros(msp
1
.height,msp
1
.width)
8: for i = 1 : msp
1
.height do
9: for j = 1 : msp
1
.width do
10: g(i, j) = rGain/(msp
1
(i, j)/msp
2
(i, j));
11: if (g(i, j) > G
max
) then g(i, j) ← G
max
12: if (g(i, j) < G
min
) then g(i, j) ← G
min
13: rO f f = msptmp
1
;
14: for i = 1 : msp
1
.height do
15: for j = 1 : msp
1
.width do
16: o(i, j) = rO f f − msp
1
(i, j) ∗ g(i, j );
17: if (o(i, j) > O
max
) then o(i, j) ← O
max
18: if (o(i, j) < O
min
) then o(i, j) ← O
min
OUTPUT: Gain Table: g, Offset Table: o
lower FPN (Young et al., 2008). However, this appro-
ach requires more data collection with more complex
test setups during factory calibrations which reduces
applicability. Although some other sophisticated ca-
libration schemes achieving lower FPN levels exists
(Milton et al., 1985; David L. Perry, 1993; Yuan et al.,
1995; Schulz and Caldwell, 1995; Jonah C. McBride,
2009), generally they are not preferred due to their
long and costly calibration processes.
As mentioned previously, second family for FPN
elimination is referred as scene based NUC (Vera
et al., 2011; Liang et al., 2014; Kumar, 2013). They
are based on one simple fact, scene and fixed pattern
noise is uncorrelated. Scene-based techniques calcu-
late gain and offset values at each frame by exploi-
ting motion-related features in image sequences on-
line which restricts usage of this family for some ap-
plications. Since we are more focused on calibration
techniques for low-power thermal imaging systems,
calibration based NUC methods fit better for our pur-
poses rather than scene based approaches.
Bad Pixel Detection and Replacement
After NUC procedure, some of the pixels does not be-
have as expected and produces abnormal values. The-
refore, data provided by these pixels can be conside-
red as completely useless or less reliable than the data
produced by its neighboring pixels. For many appli-
cations, imaging system should be able to correct bad
pixels without disturbing informative parts of image.
This could be achieved by generating a binary map for
bad pixels and performing replacement by obtaining
data from neighboring pixels.
Usage of two point NUC table coefficients is one
of the simplest method for bad pixel detection. In (Lin
and Calarco, 1990), pixels whose gain or offset values
are outside of the expected ranges are labeled as bad
pixels. In (Celestre et al., 2016), bad pixel map is
generated based on linearity as a function of integra-
tion time. First, multiple images are taken at a speci-
fic integration time then integration time is increased
step by step until saturation of the detector is reached.
From this data, ”‘coefficient of determination”’ is cal-
culated as explained in (Anderson-Sprecher, 1994)
and compared with a threshold to label bad pixels.
In median spatial spectral based algorithm, (Amber
D. Fischer, 2007), the ratio of the corresponding and
neighboring pixels is controlled. If this ratio is much
less or much more than an expected value, this pixel
is marked as bad pixel.
For bad pixel replacement, proposed methods usu-
ally benefits from neighboring pixels. For this pur-
pose, nearest neighbor (Isoz et al., 2005), median (Ce-
lestre et al., 2016) and interpolations (Kai et al., 2016)
are the most common replacement methods. Nearest
neighbor is the most simple form of replacement al-
gorithms which uses nearest healthy pixel value for
replacing bad pixel. Median method is also similar
and selects single pixel value for replacement as the
median of neighboring pixels. In interpolation algo-
rithms bad pixels are replaced by weighted average of
neighboring pixels instead of a single pixel value.
3 METHODOLOGY
3.1 Temperature and Integration Time
based Non-Uniformity Correction
Any IR imaging system aims to have wide linear
dynamic range while maintaining maximum contrast
span. However, these two requirements can be con-
flicting. Wide dynamic range is related with simulta-
neously and successfully responding low and high le-
vel radiation sources at the scene (objects at low and
high temperatures together); whereas contrast span
is about responsivity which is aimed to respond unit
change in radiance as high as possible to extract more
details of the target. Actually, selection of which para-
meters to modulate for calibration, either integration
time (IT) or temperature, determines which interest to
be favored more. IT based methods are expected to be
more effective if the temperature span of the scene is
A Study on Calibration Methods for Infrared Focal Plane Array Cameras
221

Algorithm 3: NETD Based BPD Procedure.
INPUT: ReferenceSet1-2: imSet
1
−imSet
2
, Reference
Temperatures: T 1 −T 2, Max-Min Offset: maxO f f −
minO f f
1: respMap = mean2D(imSet
1
)−mean2D(imSet
2
);
2: respAvg = mean(respMap)
3: resp1K = respMap/(T 1 − T 2)
4: f pnIm1 = std(avgFrame1)
5: NET D = f pnIm1/resp1K
6: netdT h = 1
7: for i = 1 : MaxIterationCount do
8: netdT hPrev = netdT h
9: avgNET D = 0
10: validPxlCnt = 0
11: for y = 0 : im1.height do
12: for x = 0 : im1.width do
13: pxlNET D = NET D(y, x)
14: if pxlNET D > netdT h then
15: bpdMap(y,x) = 1
16: else if pxlNET D > 0 then
17: avgNET D+ = pxlNET D
18: validPxlCnt+ = 1
19: avgNET D = avgNET D/validPxlCnt
20: netdT h = avgNET D ∗ 3
21: if abs(netdT h − netdT hPrev) == 0 then
22: break
OUTPUT: Bad Pixel Map: bpdMap
in the vicinity of the reference temperature utilized in
NUC. Obviously, that is a limiting constraint which
restricts their usage in complex scene. To achieve
IT based NUC, two image sequences are collected
from a blackbody on fixed temperature in two diffe-
rent integration times. Frame averages are calculated
for each integration time to estimate reference gain,
which indicates average responsivity between two in-
tegration times. After calculating gain coefficients for
all pixels, one of the image set is selected to calcu-
late offsets. Details on gain offset table calculation is
given in Algorithm 2.
For temperature based method, the same proce-
dure is followed. Instead of changing integration
time, temperature of the blackbody is changed a in-
tegration time fixed. More than one gain offset tables
can be obtained by changing temperature of black-
body for different integration times to optimize wide
dynamic range with better contrast stretch.
3.2 Bad Pixel Detection
Sensor quality assessment metrics are closely rela-
ted with bad pixel detection since they are desig-
ned to measure wellness of each pixel. Responsi-
vity and Noise Equivalent Temperature Difference
(NETD) metrics can be considered as two crucial me-
trics.
Responsivity (R), (Shi et al., 2009), measures the
change of detector response to a unit temperature
change; hence it is a critical performance metric.
R =
∆DigValue
∆T
(2)
Here, ∆T is the temperature change of the blackbody
image, and ∆DigValue is the defined as digitized de-
tector response change. Hence, pixels having signifi-
cantly lower or higher than average responsivity can-
not be considered as healthy pixels.
NETD, (Wang et al., 2015), is another measure for
how well designed for defining the noise characteris-
tic of the IR focal plane arrays by measuring tempo-
ral noise. NETD is typically measured in milliKel-
vin(mK) and obtained by following the steps:
1. Take N images @T
◦
K blackbody and calculate
the standard deviation of the image (noise charac-
teristic).
2. Calculate the temporal average for N images and
assign this image as AVGTK.
3. Take N images @T+∆T
◦
K blackbody
4. Calculate the temporal average for N images and
assign this image as AVGT2K.
5. Subtract AVGTK from AVGT2K to obtain R re-
sponse map.
6. Divide R response by ∆T to obtain 1K change re-
sponse map.
7. Divide the noise by the 1K change map to obtain
the NETD map
We benefited from responsivity and NETD cha-
racteristics of the sensor, in order to disclose bad pixel
map. For measuring these characteristics image se-
quences obtained from blackbody during NUC pro-
cedures are used. Details of the bad pixel detection
procedure is elaborated in Algoritm 3.
For bad pixel replacement, median algorithm pro-
posed in (Celestre et al., 2016) is utilized.
4 EXPERIMENTAL RESULTS
To compare performance of two different NUC al-
gorithms, a series of experiments were repeated for
two different detectors that are Sofradir MWIR MCT
and QWIP. Both detectors produces 14-bit digital out-
puts and has same pixel resolution and dimensions,
640 x 512 and 15 µm x 15 µm respectively. An SR-
800N Extended Area blackbody with emissivity of
VISAPP 2018 - International Conference on Computer Vision Theory and Applications
222

Table 1: Sofradir MWIR MCT Test Results.
Integration Time
(ms)
Temperature
(
◦
C)
Raw Image Temp. Based
IT Based
3
15 6.4302 0.6574 0.4838
30 5.7847 0.4701 0.2300
45 5.6460 0.3312 0.1026
60 5.7132 0.2398 0.1647
5
15 5.5021 0.1652 0.5111
30 5.5368 0.0932 0.2168
45 5.7167 0.0818 0.0818
60 5.9024 0.0953 0.1653
7
15 5.3116 0.3495 0.5401
30 5.5607 0.2284 0.2363
45 5.7968 0.1816 0.1065
60 5.9613 0.1919 0.1792
0.97 ± 0.02 was used. Blackbody is located approx-
imately 15 cm away from detectors. For Sofradir de-
tector, data was collected at integration times 3 ms,
5 ms, 7ms and temperatures 15
◦
C, 30
◦
C, 45
◦
C, 60
◦
C
as the sampling points. For QWIP, data points are
picked from integration times 10 ms, 16 ms, 22 ms
and from temperatures 10
◦
C, 20
◦
C, 30
◦
C, 40
◦
C. After
collection of raw data at specified sample points, this
data processed by first using either IT or temperature
based NUC then bad pixels are corrected. For Sofra-
dir detector, two point NUC is achieved for IT based
method by using data of 45
◦
C with 3ms and 5 ms in-
tegration times; whereas temperature based NUC is
performed for fixed 5ms integration time with 30
◦
C
and 45
◦
C temperature samples. For QWIP detector,
IT based NUC is utilized at integration time 10ms and
16ms at 30
◦
C, while temperature based NUC is achie-
ved for 16ms integration time with 10
◦
C and 30
◦
C.
To compare performances of different NUC results,
well-known non-uniformity parameter (NU) is adop-
ted from (Godoy et al., 2008) is given in Eqn. 3.
NU =
1
¯
I
v
u
u
t
1
MxN − d
M
∑
i=1
N
∑
j=1
(I
i j
−
¯
I)
2
x100%,
¯
I =
1
MxN − d
M
∑
i=1
N
∑
j=1
I
i j
(3)
where
¯
I is the average gray value of all pixels, omit-
ting the bad pixels which are numbered as d, and I
i j
is the gray value of the pixel at i
th
row and j
th
co-
lumn. MxN is the number of total pixels in IRFPA. It
should be noted that lower NU scores indicate better
uniformity (NUC results). NU metrics are evaluated
for each detector for different integration times and
scene temperatures are summarized in Table 1 and 2.
Examining the results, it is observed that IT based
approach always yields minimum NU values for the
scenes with low temperature difference from which
NUC is performed. As temperature difference in-
creases, NU scores of IT based approach rapidly in-
Table 2: QWIP Test Results.
Integration Time
(ms)
Temperature
(
◦
C)
Raw Image Temp. Based
IT Based
10
10 10.0483 3.7559 0.8273
20 10.1154 3.5250 0.3949
30 10.1621 3.1674 0.1290
40 10.2463 2.8281 0.3883
16
10 9.4335 0.0991 0.7951
20 9.5618 0.1087 0.3756
30 9.6802 0.0846 0.084
40 9.8297 0.1016 0.3727
22
10 9.2234 1.6141 0.7695
20 9.3714 1.4539 0.3681
30 9.5208 1.3727 0.1728
40 9.7192 1.2834 0.4709
creases; which shows susceptibility of IT methods to
temperature differences. On the contrary, if scene in-
cludes radiation sources that diverge from NUC refe-
rence temperature, temperature based calibration sco-
res stay more stable for relevant integration times.
Figure 2 and 3 includes scenes with different tem-
perature span and supports previous findings visually.
At each figure, left column includes outputs of tem-
perature based NUC whereas right column illustrates
IT based results. As it can be seen, Figure 2 includes
a scene having tight temperature span around 37
◦
C,
while Figure 3 is mainly around 25
◦
C and has an ex-
tra target at 15
◦
C. Since in Figure 2, scene tempera-
ture is close to NUC temperature, both method achie-
ves successful results, IT is slightly better. However,
when temperature of the scene is not close the NUC
temperature, performance of IT based NUC deterio-
rates, see Figure 3. Considering these results, genera-
tion of multiple NUC tables by using IT based NUC
for various temperatures could be a method for cali-
bration. If these tables could be switched while per-
forming online operating mode, high dynamic range
could be achieved with a good contrast span.
5 CONCLUSIONS
For effectively using any infrared thermal imaging sy-
stem in the field, factory level NUC and BPD cali-
brations are compulsory. Moreover, performance of
these calibrations are directly correlated with the qua-
lity of composed image which is equivalent to quality
of imaging system as a final product. In this paper, we
studied on calibration strategies to achieve IR ima-
ging systems having wide linear dynamic range and
contrast span simultaneously.
Considering the experimental results, we observed
that generation of multiple NUC tables by using IT
based NUC for different temperatures could be a met-
hod for calibration. If these tables could be switched
during online operation, high dynamic range could be
achieved with a good contrast span.
A Study on Calibration Methods for Infrared Focal Plane Array Cameras
223
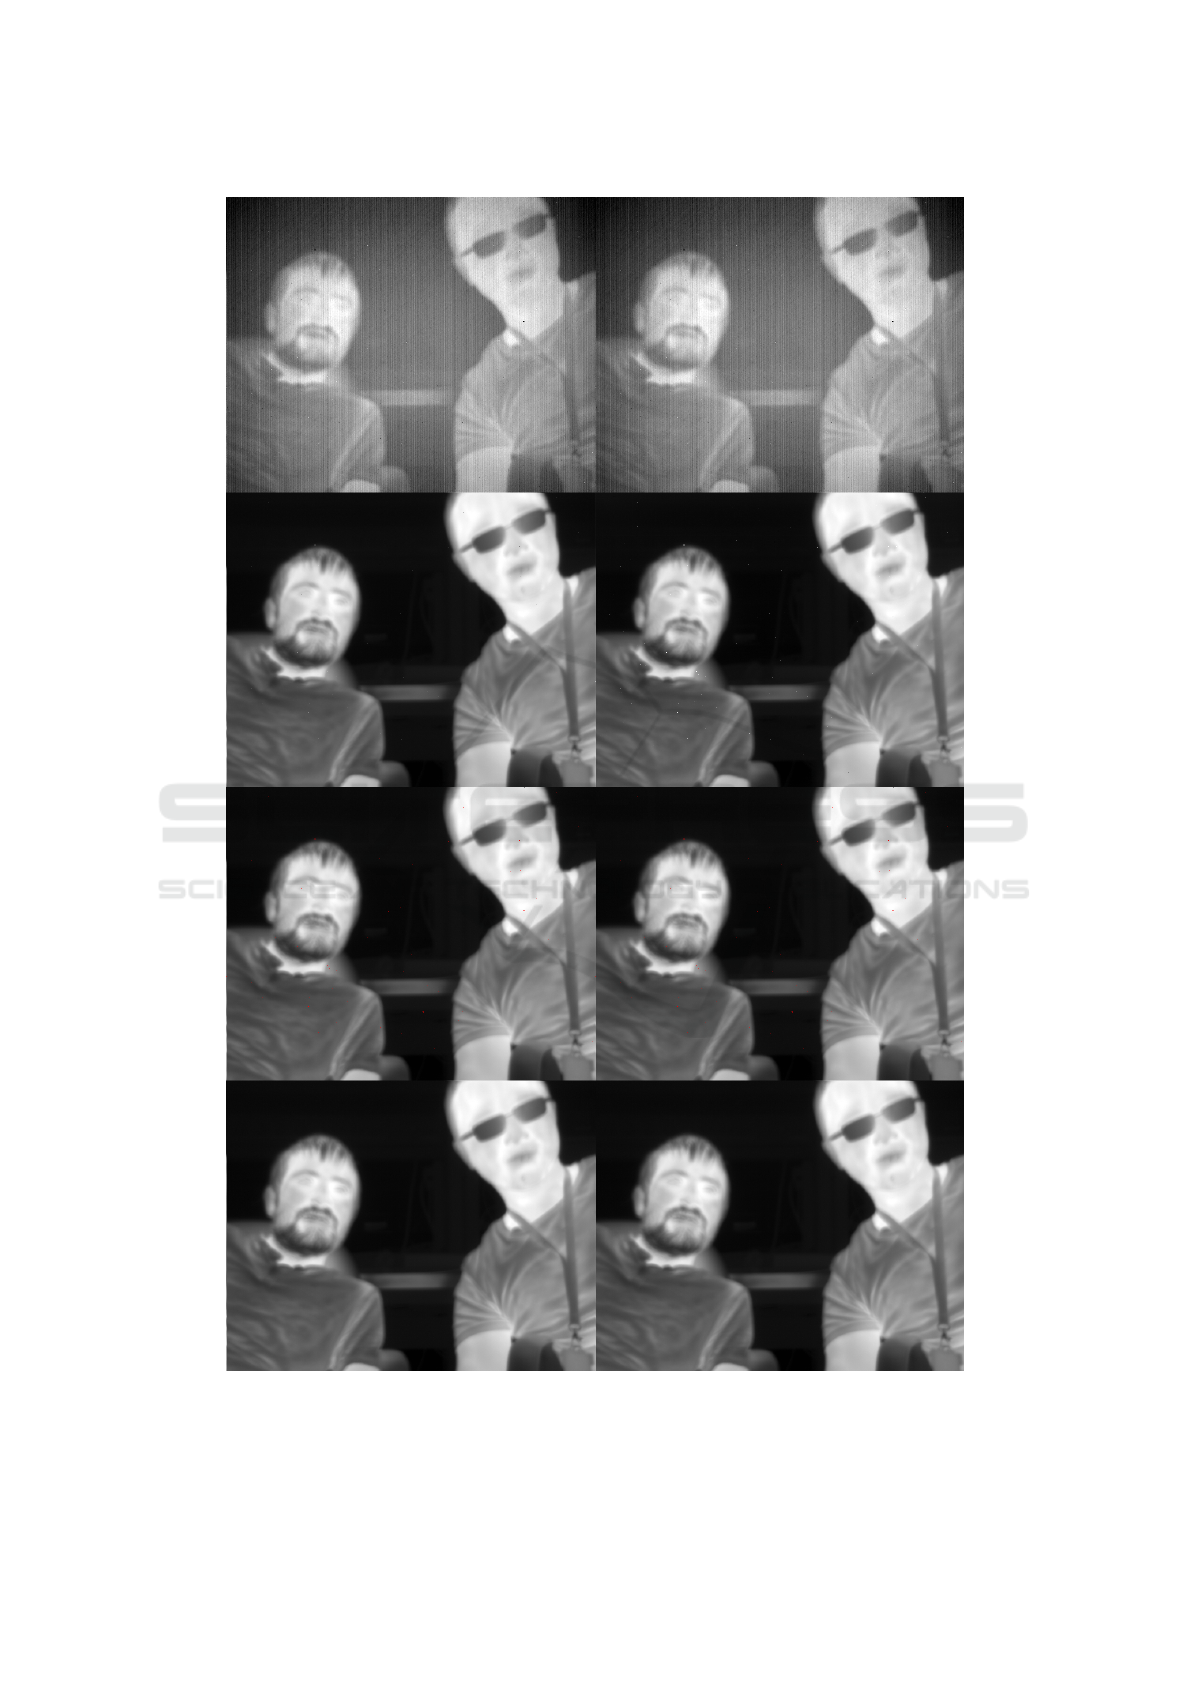
Figure 2: Left column includes outputs of temperature based calibration while right column illustrates integration time based
resuls. Rows demonstrates from top to bottom: raw data, output of performed NUC, bad pixel map (marked with red), and
final calibration result.
VISAPP 2018 - International Conference on Computer Vision Theory and Applications
224
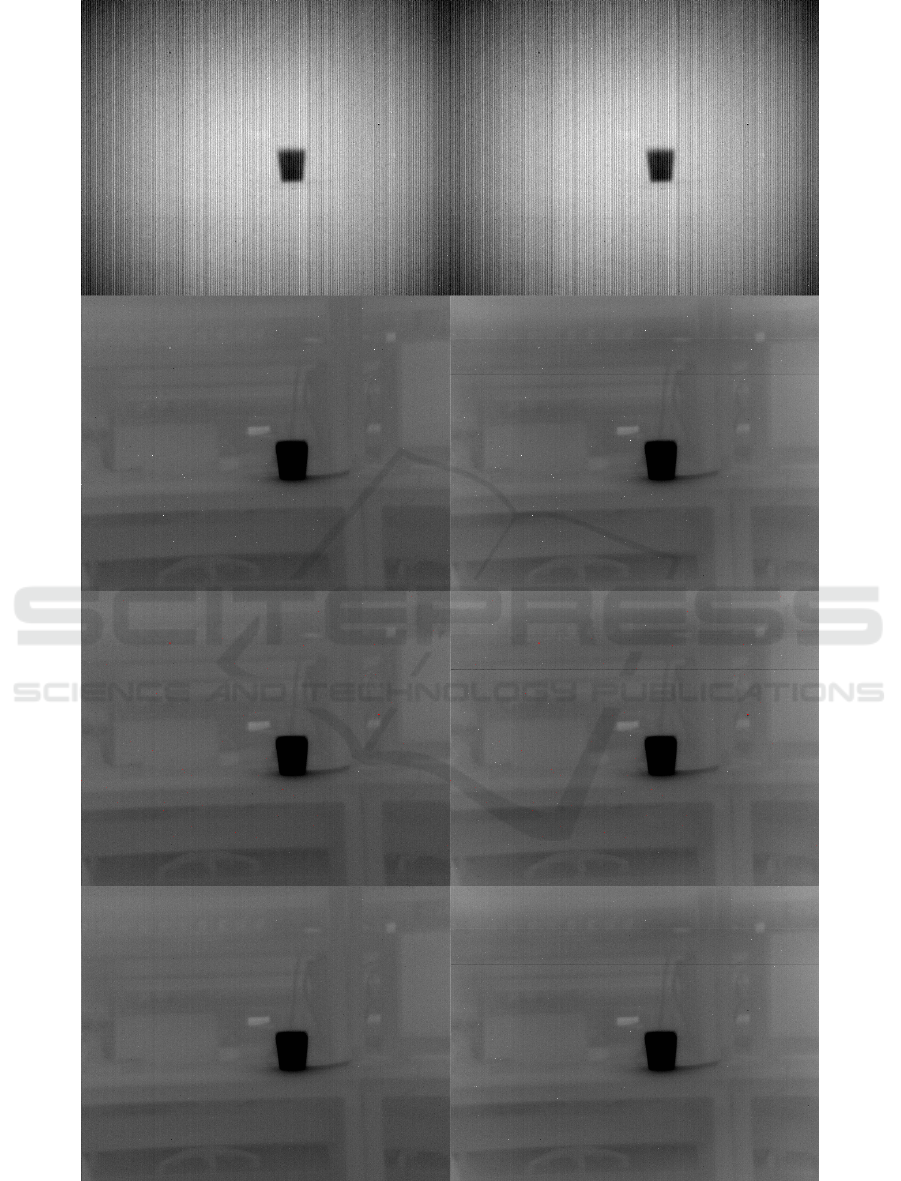
Figure 3: Left column includes outputs of temperature based calibration while right column illustrates integration time based
resuls. Rows demonstrates from top to bottom: raw data, output of performed NUC, bad pixel map (marked with red), and
final calibration result.
A Study on Calibration Methods for Infrared Focal Plane Array Cameras
225

REFERENCES
Altun, O., Kepenek, R., Tasdemir, F., Akyurek, F., Akbu-
lut, C. T. M., Nuzumlali, O. L., and Inceturkmen, E.
(2017). Development of a fully programmable roic
with 15 μm pixel pitch for mwir applications.
Amber D. Fischer, T. V. Downes, R. L. (2007). Median
spectral-spatial bad pixel identification and replace-
ment for hyperspectral swir sensors.
Anderson-Sprecher, R. (1994). Model comparisons and r2.
The American Statistician, 48(2):pp. 113–117.
Celestre, R., Rosenberger, M., and Notni, G. (2016). A no-
vel algorithm for bad pixel detection and correction
to improve quality and stability of geometric mea-
surements. Journal of Physics: Conference Series,
772(1):012002.
David L. Perry, E. L. D. (1993). Linear theory of nonuni-
formity correction in infrared staring sensors. Optical
Engineering, 32:32 – 32 – 6.
Gade, R. and Moeslund, T. B. (2014). Thermal cameras and
applications: a survey. Machine Vision and Applicati-
ons, 25(1):245–262.
Godoy, S. E., Pezoa, J. E., and Torres, S. N. (2008). Noise-
cancellation-based nonuniformity correction algo-
rithm for infrared focal-plane arrays. Appl. Opt.,
47(29):5394–5399.
Isoz, W., Svensson, T., and Renhorn, I. (2005). Nonunifor-
mity correction of infrared focal plane arrays.
Jonah C. McBride, M. S. S. (2009). Improving scene-based
nonuniformity correction for infrared images using
frequency domain processing.
Kai, M., Zhan, S., Xiaodong, P., Yongsheng, W., and Wen-
bin, L. (2016). An interpolation method based on
two-step approach model for bad point in bayer color
image. In 2016 2nd IEEE International Conference on
Computer and Communications (ICCC), pages 599–
602.
Kumar, A. (2013). Sensor non uniformity correction algo-
rithms and its real time implementation for infrared
focal plane array-based thermal imaging system. De-
fence Science Journal, 63(6):589–598.
Liang, C., Sang, H., and Shen, X. (2014). Efficient scene-
based method for real-time non-uniformity correction
of infrared video sequences. Electronics Letters,
50(12):868–870.
Lin, Y. and Calarco, A. (1990). Offset, gain and bad pixel
correction in electronic scanning arrays. US Patent
4,920,428.
Milton, A. F., Barone, F. R., and Kruer, M. R. (1985). In-
fluence of nonuniformity on infrared focal plane array
performance. Optical Engineering, 24:24 – 24 – 8.
Ness, G., Oved, A., and Kakon, I. (2017). Derivative ba-
sed focal plane array nonuniformity correction. CoRR,
abs/1702.06118.
Schulz, M. and Caldwell, L. (1995). Nonuniformity cor-
rection and correctability of infrared focal plane ar-
rays. Infrared Physics & Technology, 36(4):763 – 777.
Shi, H., Zhang, Q., Qian, J., Mao, L., Cheng, T., Gao, J.,
Wu, X., Chen, D., and Jiao, B. (2009). Optical sensi-
tivity analysis of deformed mirrors for microcantilever
array ir imaging. Opt. Express, 17(6):4367–4381.
Vera, E., Meza, P., and Torres, S. (2011). Total variation ap-
proach for adaptive nonuniformity correction in focal-
plane arrays. Opt. Lett., 36(2):172–174.
Wang, M., Tsukamoto, T., and Tanaka, S. (2015). Uncooled
infrared thermal imaging sensor using vacuum-
evaporated europium phosphor. Journal of Microme-
chanics and Microengineering, 25(8):085001.
Young, S. S., Driggers, R. G., and Jacobs, E. L. (2008). Sig-
nal Processing and Performance Analysis for Imaging
Systems. Artech House, Inc., Norwood, MA, USA.
Yuan, X., Wan, W., and Zhao, M. (1995). New method for
nonuniformity correction of solid state image sensor.
Proc.SPIE.
VISAPP 2018 - International Conference on Computer Vision Theory and Applications
226
