
An Evolutionary Approach for Estimating the Blood Glucose by
Exploiting Interstitial Glucose Measurements
Ivanoe De Falco
1
, Antonio Della Cioppa
2
, Tomas Koutny
3
, Michal Krcma
4
,
Umberto Scafuri
1
and Ernesto Tarantino
1
1
ICAR, National Research Council of Italy, Via P. Castellino 111, Naples, Italy
2
NCLab, DIEM, University of Salerno, Via Giovanni Paolo II 132, Salerno, Italy
3
NTIS, Faculty of Applied Sciences, University of West Bohemia, Univerzitni 8, Pilsen 306 14, Czech Republic
4
Diabetology Center at the Pilsen Hospital University, Alej Svobody 80, 323 00 Pilsen, Czech Republic
Keywords:
Blood Glucose Estimation, Interstitial Glucose, Evolutionary Algorithms.
Abstract:
The diabetes is correlated to a malfunction of the pancreas that produces very little or no insulin. A way
to improve the quality of life of people with diabetes is to implement an artificial pancreas able to inject an
insulin bolus when necessary. The aim of this paper is to devise a possibly step in constructing the fundamental
element of such an artificial pancreas - estimation of the blood glucose (BG) through interstitial glucose (IG)
measurements. In particular, a new methodology is presented to derive a mathematical relationship between
BG and IG by exploiting the ability of the evolutionary techniques in solving this regression task. An automatic
procedure is used to estimate the missing BG values within this database. To validate the discovered model a
comparison with other models is carried out during the experimental phase.
1 INTRODUCTION
Diabetes mellitus (DM) is a group of heterogeneous
disorders, which share the common trait of elevated
blood glucose level (BG). A number of medical risks
are associated with diabetes ranging from retinopathy,
neuropathy, and nephropathy or even more serious
complications such as the increased risk of heart dis-
ease and stroke (World Health Organization, 2013).
A large part of the world population is affected by
the diabetes that is a disease with no cure. Therefore,
a methodology able to help the sick persons is very
important not only to improve the patient’s quality of
life, but also to abate the costs of the treatment that
lasts for many years. To succeed in controlling BG,
we need to obtain as precise as possible BG-estimate
to establish the right amount of insulin to inject.
Several devices have been introduced to accom-
plish the task but most of them are invasive. Patients
are reluctant to invasive solution because of the asso-
ciated pain. Moreover, they usually provide measures
in intervals that ranges from about 15 minutes to a
couple of hours with no BG measurements taken dur-
ing the night. All this prevents to adequately take care
of the patient. Instead there is a wide availability of
easier-to-use Continuous Glucose Monitoring System
(CGMS) devices (Vashist, 2013) for the measurement
of the IG, i.e., the glucose in the subcutaneous tissue.
CMGS is minimally-invasive and can be pro-
grammed to take measures with a prefixed frequency
for a number of days, also during the night. Neverthe-
less, CGMS needs BG to calibrate - to transform the
measured electric current to glucose level. Patient has
to calibrate at least two times a day, when BG and IG
are steady. While the patient collects only a few BGs,
CGMS provides 288 measurements a day.
BG and IG can differ considerably due to physio-
logical reasons. Therefore, there is a need for efficient
methodologies to derive a precise estimation of BG by
exploiting the large amount of available IG values.
Several studies (Rossetti et al., 2010) have proved
that the complexity of the relationship between glu-
cose dynamics in BG and IG is far too complex to be
captured in the simple calibration algorithms imple-
mented in CGMS devices available in the market, and
this affects the measurement accuracy. CGMS is a
low-power device that implies low computational ca-
pabilities. Although IG is not considered a perfect BG
indicator, nonetheless it is the only one to be available
with continuous and non-invasive measurements.
De Falco I., Della Cioppa A., Koutny T., Krcma M., Scafuri U. and Tarantino E.
An Evolutionar y Approach for Estimating the Blood Glucose by Exploiting Interstitial Glucose Measurements.
DOI: 10.5220/0006729706250632
In Proceedings of the 11th International Joint Conference on Biomedical Engineering Systems and Technologies (HEALTHINF 2018), pages 625-632
ISBN: 978-989-758-281-3
Copyright
c
2018 by SCITEPRESS – Science and Technology Publications, Lda. All rights reserved

Some analytical models have been introduced in
the literature attempting to describe mathematical re-
lationship of IG and BG, as detailed in Section 2. All
these models represent a basic step to design and im-
plement an artificial pancreas, i.e., an artificial device
able to automatically drive insulin injections in case
of necessity. This device must be able to perform a
glycemic control by forecasting BG course through
the analysis of the IG signal.
The first contribution of the paper is the introduc-
tion of an innovative methodology to put out new
BG values without performing additional measure-
ments. This methodology allows increasing the num-
ber of the BG values contained in the database which
is a critical problem when searching for a prediction
model. The second contribution consists in exploit-
ing such a modified database to symbolically derive
a law able to describe BG values by starting from IG
measurements. These estimation problems are known
as regression problems. Considered the complexity,
we exploit the capability of the Genetic Programming
(GP) (Koza, 1992) in tackling regression problems
to find an effective approximation of relationship be-
tween IG and BG values. The experiments are carried
out over a real-world database containing both BG
and IG measurements for several subjects suffering
from Type 1 DM, i.e., the case in which the pancreas
fails to produce insulin. The scope is to extract an
explicit relationship, i.e., a mathematical expression,
between BG and IG values that could be the core of
the knowledge base of an artificial pancreas.
The paper is structured as follows. In Sect. 2 a
short description of the related work is given. Section
3 outlines the methodology employed, along with an
innovative procedure to enrich the original database
presenting too many missing BG values in Sect. 3.1,
and the genetic-based regression model in Sect. 3.2.
A discussion on the achieved results and a comparison
with other models is reported in Sect. 4. Conclusions
and future work are exposed in Sect. 5.
2 RELATED WORK
Several models have been devised to find a reciprocal
relationship between BG and IG values.
The first, and most widely used, model attempting to
relate BG and IG was proposed by Steil and Rebrin
(Rebrin et al., 1999). It is represented by the follow-
ing equation:
τ
g
·
di(t)
dt
+
1
g
· i(t) = b(t) (1)
where b(t) and i(t) are the BG and the IG at time t,
and the parameters g and τ represent the steady-state
gain and the IG equilibration time constant, respec-
tively. An important task is the estimation of the best
possible values for g and τ so that the precision of the
model can be improved.
Makroglou et al. (Makroglou et al., 2006) pre-
sented an overview of several mathematical mod-
els aimed at describing the glucose-insulin regulatory
system with reference to DM. The described models
ranged from ordinary differential equations to partial
differential equations, to delay differential equations
to the integro-differential ones.
Per
´
ez-Gand
´
ıa (P
´
erez-Gand
´
ıa et al., 2010) em-
ployed an artificial neural network for the prediction
of the blood glucose concentration. The accuracy of
the tool was estimated by using the root mean square
error and the prediction delay.
Del Favero et al. (Del Favero et al., 2014) pro-
posed a model that tries to improve that by Steil and
Rebrin. Basically, they supposed that the value of g
is equal to 1, and added a way to calibrate the model
so that a true IG, represented by i
t
(t), can be restored.
This calibration is expressed by the equation:
i
i
(t) =
i(t) − β − γ · ∆t(t)
α
;∆t(t) = t −tcal (2)
where α, β, and γ are calibration parameters, and their
values must be recomputed each time the CGMS is
calibrated.
Koutny (Koutny, 2014) struggled to improve the
devised model of glucose dynamics to reduce its cal-
culation error, especially with rapid changes of BG
and IG, e.g., due to short-action insulin. This model
heavily relies on biological considerations, as for in-
stance the importance of capillaries and the fact they
have different permeabilities in different compart-
ments. By means of the proposed model tested on
hyperglycemic-clamp data, he succeeded in attaining
an improved model to compute the BG levels.
All the analytic models introduced presents the
problem of estimation of several parameters. This
estimation is usually performed by exploiting math-
ematical, biological or physiological considerations
or, in some cases, by performing an a-posteriori man-
ual tuning. Despite its importance, only in the last
years some attempts have been carried out to automat-
ically extrapolate the parameter estimation by means
of techniques able to deal with this optimization prob-
lem such as the evolutionary methods. Two of these
attempts are reported in the following.
Koutny (Koutny, 2016) combined the analytic
method proposed in 2014 with meta-Differential Evo-
lution (DE) (Price and Storn, 1997). Namely, starting
from a continuously measured level of IG for human

Type-1 diabetic patients, he computed a continuous
BG level. He used six different scenarios to ensure
robust validation of the calculation, and made use of
DE to evaluate the parameters for his model. All the
six scenarios, even the simplest ones, performed bet-
ter than CGMS in estimating BG values.
De Falco et al. (De Falco et al., 2017) proposed
a GP tool to estimate the BG values starting from
the easily available IG values. A relationship under
a form of an explicit mathematical expression was
excerpted. The experimentation was carried out on
a real-world database containing subjects suffering
from Type 1 diabetes. The comparison against state-
of-the-art models attested the effectiveness of the pro-
posed evolutionary approach.
3 THE METHODOLOGY
The methodology proposed within this paper can be
summarized in two basic steps: i) the definition of
a novel automatic procedure to enrich the database
with estimated BG values by exploiting an evolution-
ary optimizer for the calculation of the model param-
eters; ii) the use of an appropriate evolutionary tech-
nique, i.e., a GP algorithm, for solving the regression
model and extracting an explicit symbolic model.
3.1 Database Enrichment
The poor availability of BG values with respect to the
IG ones is one of the major problem in excerpting a
reciprocal and effective mathematical relationship be-
tween them. To overcome this problem we devise a
new procedure able to estimate a number of missing
BG values within the database used to solve the re-
lated regression problem.
Since the Steil-Rebrin model (Rebrin et al., 1999)
is still one of the most widely used to establish a rela-
tion between BG and IG, we have employed it to esti-
mate the missing BG values. To proceed in this direc-
tion, it is necessary to estimate the model parameters
of Eq. (1), i.e., the steady-state gain g and the equili-
bration constant τ, so to enhance the model precision.
Following the approach of Koutny in (Koutny, 2016),
this estimation is performed by using as optimizer an
evolutionary algorithm, namely the DE. Such an al-
gorithm works on a population of potential candidate
solutions representing the model parameters. Start-
ing from a population of randomly chosen parameter
values, the population evolves by performing recom-
bination and mutation of the current solutions through
specific evolutionary operators. The details related
to these operators can be found in (Price and Storn,
-
*
6.4
+
y
4.7
x
Figure 1: An exemplary tree-structured solution in GP.
1997). During the evolution the quality of the cur-
rent parameters is evaluated through a fitness func-
tion. This function computes the mean square error
between the BG values estimated through the Steil-
Rebrin model endowed with the current parameters
and the available measured BG values of the original
database. The evolutionary procedure is applied it-
eratively until a fitness of desired quality is achieved
or a fixed number of iteration is performed. By ex-
ploiting the calculated parameter values at the end of
the evolution, we are able to estimate the BG values in
correspondence of all the IG values for which they are
missing. In this way a complete correspondence be-
tween all the IG and BG values is available. Naturally
the measured values in the original database are left
unchanged. The so-modified database is then used for
solving the symbolic regression problem. By consid-
ering that the number of estimated BG values in this
enriched database are much higher than those truly
measured, it will be necessary to introduce a correc-
tion factor to avoid a bias in the model extraction. The
detail of this correction factor will be reported in the
experimental section.
3.2 The General GP Framework
Genetic Programming (GP) is a heuristic methodol-
ogy well suited for optimization purposes (De Falco
et al., 2005; De Falco et al., 2006), and has its roots
in the implementation in a computer of mechanisms
borrowed from the natural evolution process that hap-
pens in populations.
Given a problem, GP works on a set, referred to as
population, of its solutions. Each solution, called in-
dividual, is a program represented under a tree struc-
ture form. The inner nodes in any individual denote
elementary functions, while the leaf nodes contain
terminals, i.e., either variables of the problem or con-
stant values. By reading a starting tree in pre-order
the corresponding program is got. An example is out-
lined in Fig. 1 in which the tree represents the in-order
expression 6.4 − (4.7 ∗ y) + x.
In GP the quality of each individual in solving the

Table 1: The set of the elementary functions along with the
related symbols.
Symbol Description
+ Addition
- Subtraction
* Multiplication
/ Protected division (is 1 if the denominator is 0)
sqrt Square root
pow Power
given problem is evaluated by means of a fitness func-
tion Φ that should be tailored to the specific prob-
lem. The population of solutions evolve iteratively
from one generation to the next one by applying evo-
lutionary operators with the aim to improve the fit-
ness function. This evolution ends when a fixed maxi-
mum number of generations g
max
is reached A general
pseudo-code describing GP is reported the following:
• randomly generate an initial population with P in-
dividuals;
• evaluate the quality of each individual with the
help of the appropriate fitness function;
• at each generation create a new population by re-
peating the steps below:
– randomly choose an evolutionary operator; i.
e., crossover, mutation, and copy;
– select as many individuals as needed by the op-
erator chosen in the current population;
– let the selected individuals undergo the operator
so as to generate a new individual;
– insert this latter into the new population being
created;
– assess the quality of the new individual through
the fitness function;
• keep on creating a new population at each gener-
ation until reaching a preset g
max
.
The quality of the solutions achieved by GP, in terms
of fitness function values, typically improves as the
number of generations increases. For a detailed de-
scription of the three operators the interested reader
can refer to (Koza, 1992).
3.2.1 GP for Regression
Since we wish to tackle a regression task, the popu-
lation will be constituted by a set of regression mod-
els. Each such model is encoded as a ‘formula’, repre-
sented as a tree whose nodes can include either func-
tions or terminals. The complete set of the functions
employed within this paper is outlined in Table 1.
The terminal set consists of the set of the indepen-
dent variables of the problem, plus the Const symbol
that denotes a constant value. This latter is always
used in relation to a problem variable, and its value
is randomly selected in a range suited to the specific
variable involved.
Aiming at obtaining a (sub)–optimal regression
model, a division of the database items into either
two or three sets takes typically place for learning pur-
poses. Due to the limited amount of measured items
in the available database, we have opted for a two-set
division, namely train and test sets. Learning is car-
ried out over the items of the train set with the goal
to attain a model useful to approximate the dependent
variable values as a function of the values of the in-
dependent problem variables. The quality of the best
model (in terms of best fitness value over the train set)
provided by GP at the end of the execution is eval-
uated over the test set, whose items had been never
previously displayed to the GP algorithm.
To numerically assess the quality of each regres-
sion model S achieved during the GP execution, we
have employed the Root Mean Square Error (RMSE)
as fitness function Φ, i.e:
Φ(S) =
r
∑
n
i=1
(y
calc
(i) − y(i))
2
n
(3)
where y
calc
(i) represents output value for the i–th item
of the database by the model S under examination,
whereas y(i) is the value of the dependent variable for
the same i–th item. With this choice the regression
problem becomes a minimization problem.
4 EXPERIMENTAL RESULTS
The Database. From the Diabetology Center at the
Pilsen Hospital University, we received anonymized
datasets of Type 1 diabetic patients. We transformed
the datasets into a database. The database comprises
5 different patients. Each patient comprises several
time segments. Time segment is a period for which
the patient wore CGMS. There are 9, 30, 31, 38 and
38 time segments per patient, respectively. In total,
there are 146 time segments, which contain 342 BGs
and 36256 IGs.
The Findings. On the database, we apply the
methodology described in 3.1 to estimate the missing
BG values. This procedure necessitates of the estima-
tion of the parameters of the Steil-Rebrin model. The
estimation performed by means of the DE algorithm
has resulted in the following values for the parame-
ters: g = 0.98 and τ = 0.02. These values have been
used to enrich the dataset with the missing BG val-
ues. As already said, the truly measured BG are left
unchanged. The enriched dataset has been employed

to assess whether or not a general behavior, able to
suitably describe all of the involved subjects, can be
identified. If it were possible, this would result in an
unique model without the necessity to personalize it
as a function of the subject. The eventual existence
of a single model would simplify also the knowledge
base for the artificial pancreas.
To perform all the reported experiments GPTIPS
(Searson, 2009), a tool executing GP and running in
the MATLAB environment, has been used. The GP
parameters have been set at the following values: P=
500, g
max
= 500, tourn size = 30, p mutate = 0.1,
p cross = 0.9, and p copy = 0.02 after a preliminary
tuning phase. To simplify the results the maximum
tree depth and the maximum number of the tree nodes
have been set equal to 4 and 8 respectively.
We have assigned the first 70% of its items to
the train set (25,370 items) and the remaining 30%
of items to the test set. Then we have executed the
tool for 10 times. The reason is that GP is a nonde-
terministic algorithm whose results depends on a ran-
dom integer value that should be assigned as seed to a
random number generator. Different seeds can yield
different results. Therefore, GPTIPS has been run 10
times over the dataset. The run reaching the lowest
RMSE value over the test has been taken into account
because its associated final model has the highest abil-
ity to correctly compute unseen data.
Furthermore, the GP considers for the indepen-
dent variable IG a time interval of 30 minutes before
and 30 minutes after around a selected time t that is
the time at which the dependent variable BG has to
be computed. Considered that the IG values are taken
with a ∆t = 5 minutes, the values considered with re-
spect to IG at time t, i.e., i(t), ranges from i(t − ∆t) to
i(t −6∆t) for the past, and from i(t + ∆t) to i(t +6∆t)
for the future total of 14 independent variables, yield-
ing for GPTIPS 13 possible terminals, plus the const
node. In addition to these 13 variables, the dataset
contains also the estimated BG values b
s
(t) and the
measured BG values b
m
(t).
In Equation (3) y(i) represents the measured BG
value in the i–th item of the set, and y
calc
(i) is its esti-
mate through the use of the IG values.
As explained in Section 3.1, to avoid bias in the
model extraction a fitness function with a correction
factor p
s
has been devised. To this aim a global fitness
function RMSE
ALL
arranged as the sum of two sub-
fitness functions appropriately weighted by an appro-
priate correction factor p
s
is introduced. In formula
this function can be expressed as follows:
RMSE
ALL
= (1 − p
s
) · RMSE
s
+ p
s
· RMSE
m
(4)
where RMSE
s
is the error evaluated on the estimated
values while RMSE
m
is the error computed on the
Table 2: RMSE
m
values obtained by the different methods.
GP GP IGBG IGBG S-R
opt
S-R
opt
Train Test Train Test Train Test
9.65 10.15 17.17 18.27 14.71 13.82
measured values.
The correction factor is given by p
s
= n
s
/n
t
where
n
s
is the number of the estimated values and n
t
is the
total number of values in the dataset. The choice for
the correction factor in Eq. 4 is due to the fact that the
number of measured values is about 1% with respect
to the number of estimated values. Therefore, consid-
ered that RMSE
s
weights much more than RMSE
m
,
in order to avoid bias toward the estimated values we
have decided to assign to the correction factors values
inversely proportional to the weights of the respective
sub-fitness functions.
Throughout our experiments, we compare our GP-
based method endowed the new methodology to esti-
mate the missing BG values against a GP approach
which makes use of the measured IG values as if
they were the exact measured values of the BG. This
method is denoted as IGBG. The last comparison is
performed with the state-of-the art Steil-Rebrin model
(Rebrin et al., 1999) with the parameters optimized
through DE. Hereinafter this model is named S-R
opt
.
The best model found for the global database is:
b(t) =1.16 · i(t + ∆t)) − 0.00369 · i(t − 6∆t)−
0.141 · i(t −∆t) +
(10.6 · (i(t) + (i(t) − ∆t))
i(t + 3∆t)
− 20.6
where i is the measured IG and b is the computed BG.
The obtained model uses five out of the thirteen
inputs, namely the IG values at times t, t − ∆t, t −
6∆t, t + ∆t and t + 3∆t. This confirms the statement
in (Boyne et al., 2003; Steil et al., 2000) that delays
of up to 13 minutes take place between IG and BG.
From a quantitative viewpoint, Table 2 shows the
RMSE
m
of the different models over train and test
sets. Of course, for the IGBG method there is no
learning. Our method has the best performance with
respect to the other models, and obtains an RMSE
m
value equal to 9.65 over the train set, and to 10.15
over the test set. This is a very good result, because
this means that the difference between a BG value es-
timated by this model and the real BG value is about
10 mg/dl in a typical range between 50 and 400. This
relatively small RMSE
m
ensures that the use of the
above model can be of great help in assessing whether
the subject is in a normal state, or is undergoing a hy-
perglycemic or a hypoglycemic episode.
Figure 2 shows how well the BG values estimated
by the computed model fit the BG measured data over
both train and test sets. As a general comment, fitting
is very satisfactory also over test set data, never shown
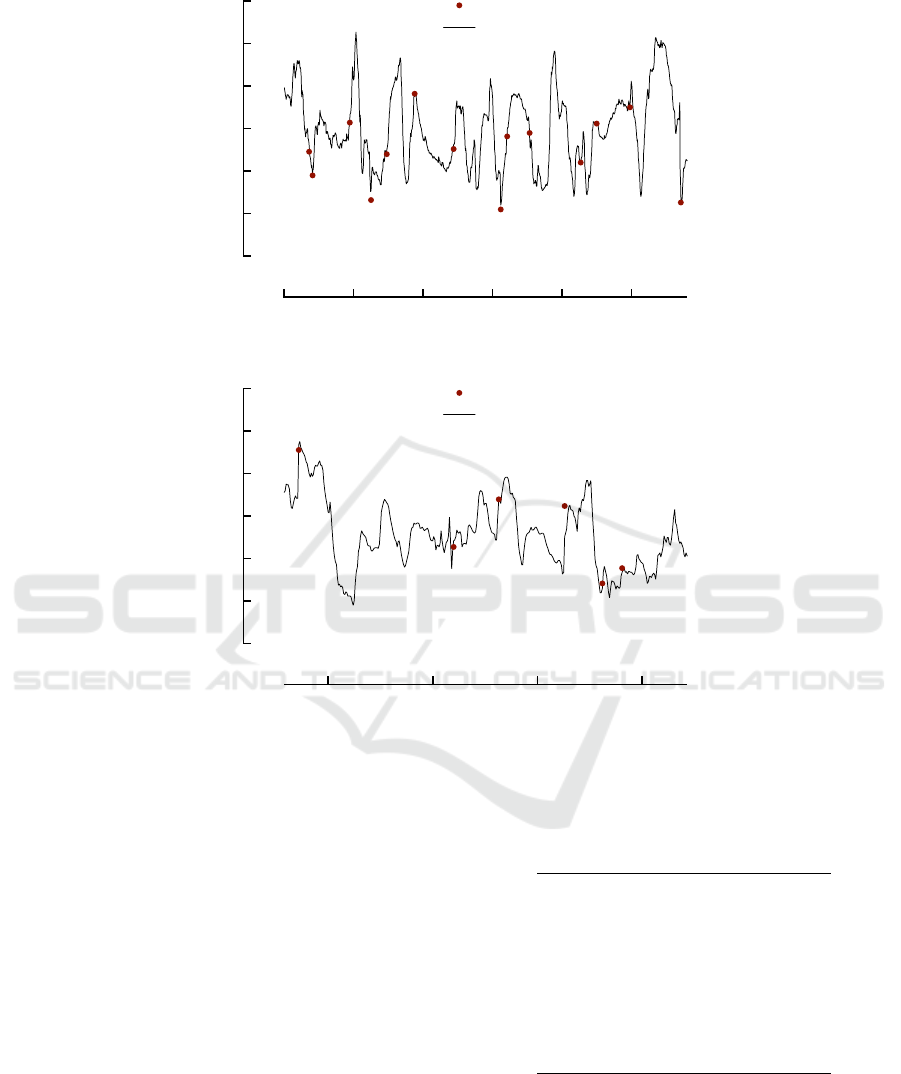
0 200 400 600 800 1000
0
50
100
150
200
250
300
Time [Δt ticks, Δt = 5min]
Glucose [mg/ml]
Measured Blood Glocose
Computed Blood Glucose
35900 36000 36100 36200
0
50
100
150
200
250
300
Time [Δt ticks, Δt = 5min]
Glucose [mg/ml]
Measured Blood Glocose
Computed Blood Glucose
Figure 2: The estimate of the values through GP. Top: first 2 segments on train set. Bottom: last 4 segments on test set.
to the system during learning, BG peaks are very of-
ten caught in terms of both time and magnitude.
The frequency of relative errors for the three in-
vestigated models is reported in Table 3. As it can be
appreciated from the table, for our model 87.74% of
the items has a relative error lower than 10%, which is
an excellent result. Moreover, more than 95% of the
items has an error lower than 20%, which is also good
with respect to ISO 15197:2003 and 15197:2013 ac-
curacy standards for blood glucose meters. The table
also evidences that these results are much better than
those achieved when IG is used as the real value of
BG, and better also than S-R
opt
model for the items
with relative errors lower than 10% and 20%. S-R
opt
model has slightly better values than GP for a relative
error lower than 5% while the results are the same
for the other relative errors. This means that the pro-
posed GP-based approach can actually help in better
estimating BG.
Table 3: The frequency of relative errors: cumulative prob-
ability of lower than or equal to relative error.
Relative error GP IGBG S-R
opt
≤5% 59.43% 41.51% 60.38
≤10% 87.74% 72.64% 83.02
≤15% 90.57% 84.91% 90.57
≤20% 95.28% 90.57% 92.45
≤25% 98.11% 93.40% 98.11
≤30% 98.11% 96.23% 98.11
≤35% 98.11% 96.23% 98.11
≤40% 100.0% 98.11% 100.0
≤45% 100.0% 98.11% 100.0
≤50% 100.0% 100.0% 100.0
Figure 3 shows the results in terms of the Clarke
Error Grid analysis (Clarke et al., 1987), that is widely
used in the studies about diabetes. Basically, the 2D-
estimate space is subdivided into five zones labeled
from A to E. The higher the number of points falling
in zones A and B, the better the estimate. Points
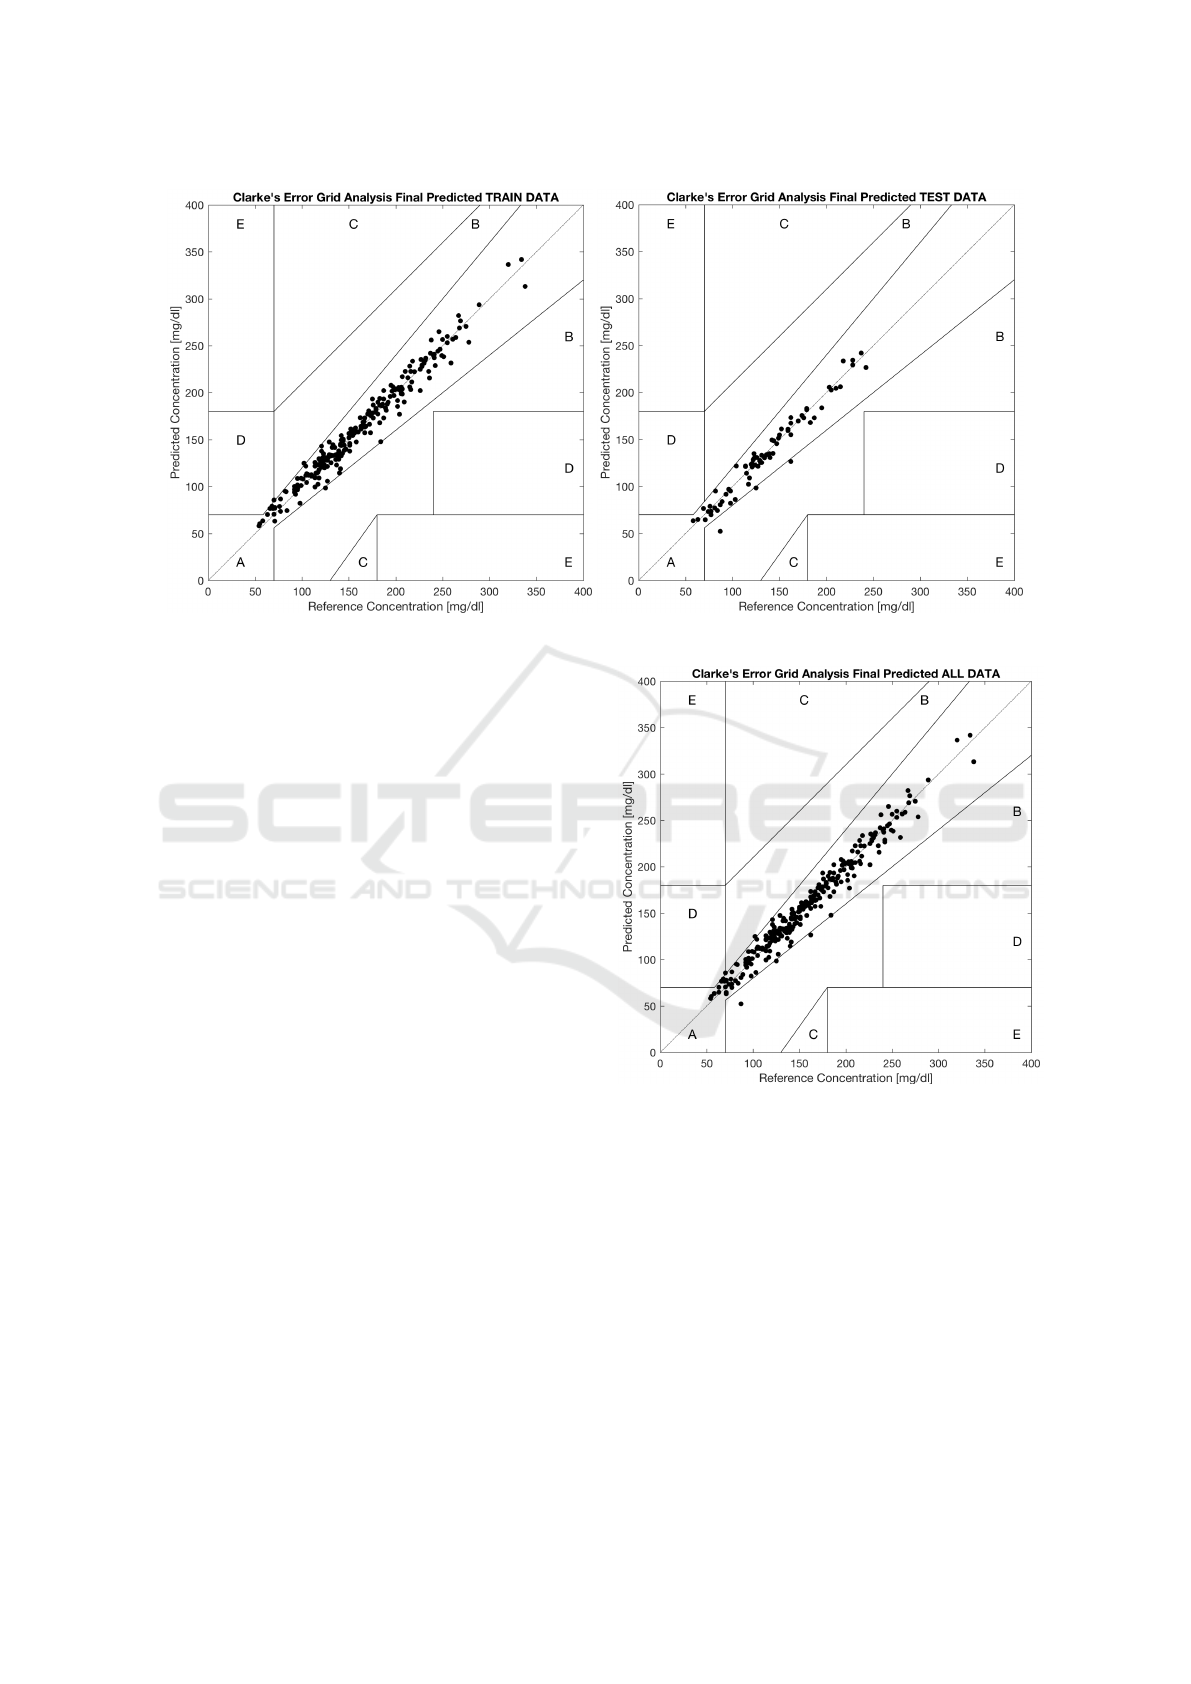
Figure 3: Clarke grid analysis. Left: train set. Right: test set.
falling in the other zones represent different types of
situations that should be avoided. As it can be seen,
almost all of the points lie in the zones A and B, and
this holds true not only for the train set but for the
test set too, which is a hint of a very good estimate.
Numerically, the percentage of points falling in the
different zones is reported in Table 4 for the test set,
and this for all the models. For GP we report also the
results over the train set, and for IGBG the results are
related to the whole database.
Figure 4 reports the same diagram on all the
dataset. For GP the zones A and B contain more than
99% of the points in test set (ISO 15197:2013 require-
ment), which is very good and is superior to IGBG,
and slightly outperforms also the S-R
opt
method. Also
the absence of points related to situations C and E is
an excellent outcome of the proposed model. As a
comparison, GP has a lower number of points lying
in the zone D than IGBG and the S-R
opt
models. This
is a very important outcome because zone D points
out a possible risky inadequacy for hypoglycemia or
hyperglycemia identification.
Summarizing, the results obtained seem to imply
that a unique model extracted by using GP can fit
all of the subjects involved in this study, and the ar-
tificial pancreas for all of them could be based on
evolutionary-devised models.
5 CONCLUSIONS
The main problem for a regression model in finding
a relationship between variables is the absence of a
sufficient number of value of the variables to be cor-
Figure 4: Clarke grid analysis on the whole dataset.
related. This situation is usual in the field of diabetes
research where the easily available number of IG val-
ues contrast with the low number of corresponding
number of BG values. Within this paper, to overcome
the problem we have devised an evolutionary proce-
dure to enrich the database made up of many miss-
ing BG values by exploiting the Steil-Rebrin model
and the DE technique to estimate these missing BG
values. Afterward, a GP algorithm has been used to
excerpt an explicit relationship between BG and IG
values under the form of a mathematical expression.
This model has been compared both against a GP
approach which makes use of the measured IG val-

Table 4: The Percentage of Points Falling in the Different Zones of the Clarke Error Grid.
Zone GP Train GP Test IGBG Train IGBC Test S-R
opt
Train S-R
opt
Test
A 98.73% 95.28% 94.49% 90.57% 97.46% 93.40%
B 0.85% 4.72% 4.24% 8.49% 1.69% 6.60 %
A + B 99.58% 100% 98.73% 99.06% 99.15% 100%
C 0.00 % 0.00% 0,00% 0.0% 0% 0%
D 0.42% 0% 1.27% 0.94% 0.85% 0%
E 0.00% 0.00% 0.00% 0.00% 0.00% 0.00%
ues as if they were the exact measured values of
the BG, and against the state-of-the-art Steil-Rebrin
model with optimized parameters. The results have
shown its superiority in terms of lower RMSE, and
of better fitting in the Clarke Error Grid. The find-
ings obtained seem to imply that a unique model can
fit all of the subjects involved in this study, and the
artificial pancreas for all of them could be based on
evolutionary-devised model.
Future work implies the use of evolutionary-
devised model in a clinical trial to estimate the BG
values of the involved subjects, so as to further test its
effectiveness. In the positive case, this model could
be added to an under-development artificial pancreas
device for a real experimentation.
ACKNOWLEDGEMENTS
This publication was partially supported by the
project LO1506 of the Czech Ministry of Education,
Youth and Sports.
REFERENCES
Boyne, M., Silver, D. M., Kaplan, J., and Saudek, C. D.
(2003). Timing of changes in interstitial and venous
blood glucose measured with a continuous subcuta-
neous glucose sensor. Diabetes, 52:2790–2794.
Clarke, W. L., Cox, D., Gonder-Frederick, L., Carter, W.,
and Pohl, S. (1987). Evaluating clinical accuracy of
systems for self-monitoring of blood glucose. Dia-
betes Care, 10:622–628.
De Falco, I., Della Cioppa, A., Scafuri, U., and Tarantino,
E. (2017). Accurate estimate of blood glucose through
interstitial glucose by genetic programming. In Pro-
ceedings of the International Symposium on Comput-
ers and Communications, pages 284–289. IEEE Press.
De Falco, I., Della Cioppa, A., Tarantino, E., and
Fontanella, F. (2005). A novel grammar-based genetic
programming approach to clustering. In Proceedings
of the ACM Symposium on Applied Computing, vol-
ume 2, pages 928–932. ACM Computing.
De Falco, I., Della Cioppa, A., Tarantino, E., and
Fontanella, F. (2006). An innovative approach to ge-
netic programming-based clustering, volume 34 of
Advances in Soft Computing, pages 55–64. Springer.
Del Favero, S., Facchinetti, A., Sparacino, G., and Co-
belli, C. (2014). Improving accuracy and precision of
glucose sensor profiles: retrospective fitting by con-
strained deconvolution. IEEE Trans. Biomed. Eng.,
61(4):1044–1053.
Koutny, T. (2014). Blood glucose level reconstruction as a
function of transcapillary glucose transport. Comput.
Biol. Med., 53:171–178.
Koutny, T. (2016). Using meta-differential evolution to
enhance a calculation of a continuous blood glu-
cose level. Computer methods and programs in
biomedicine, 133:45–54.
Koza, J. (1992). Genetic programming: on the program-
ming of computers by means of natural selection, vol-
ume 1. MIT Press.
Makroglou, A., Li, J., and Kuang, Y. (2006). Mathemati-
cal models and software tools for the glucose-insulin
regulatory system and diabetes: an overview. Applied
Numerical Mathematics, 56:559–573.
P
´
erez-Gand
´
ıa, C., Facchinetti, A., Sparacino, G., Cobelli,
C., G
´
omez, E., Rigla, M., de Lieiva, A., and Her-
nando, M. E. (2010). Artificial neural network al-
gorithm for online glucose prediction from contin-
uous glucose monitoring. Diabetes Technol. Ther.,
12(1):81–88.
Price, K. and Storn, R. (1997). Differential evolution. Dr.
Dobb’s Journal, 22(4):18–24.
Rebrin, K., Steil, G., van Antwerp, W., and Mastrototaro,
J. (1999). Subcutaneous glucose predicts plasma glu-
cose independent of insulin: implications for continu-
ous monitoring. Am. J. Physiol. 277, 277:E561–E571.
Rossetti, P., Bondia, J., Veh
´
ı, J., and Fanelli, C. (2010). Es-
timating plasma glucose from interstitial glucose: the
issue of calibration algorithms in commercial contin-
uous glucose monitoring devices. Sensors, 10:10936–
10952.
Searson, D. (2009). GPTIPS: Genetic program-
ming and symbolic regression for MATLAB.
http://gptips.sourceforge.net., 2009.
Steil, G., Bernaba, B., Saad, M., Mastrototaro, J., and Re-
brin, K. (2000). Accurate determination of plasma
glucose during hyper- and hypoglycemia with a sub-
cutaneous glucose sensor. Diabetes, 49 (Suppl.
1):A126.
Vashist, S. K. (2013). Continuous glucose monitoring sys-
tems: a review. Diagnostics, 3(4):385–412.
World Health Organization (2013). Diabetes fact sheet n.
312.
