
Dynamic Gait Monitoring Mobile Platform
Robin Amsters
1,4
, Ali Bin Junaid
1,4
, Nick Damen
1
, Jeroen Van De Laer
1
, Benjamin Filtjens
1,2,3,4
,
Bart Vanrumste
2,3
and Peter Slaets
1,4
1
Department of Mechanical Engineering, KU Leuven, 3000 Leuven, Belgium
2
Department of Electrical Engineering (ESAT), STADIUS - IMEC, KU Leuven, 3001 Heverlee, Belgium
3
eMedia Research Lab, KU Leuven, 3000 Leuven, Belgium
4
Intelligent Mobile Platform Research Group, KU Leuven, 3000 Leuven, Belgium
Keywords:
Gait Analysis, Kinect, Mobile Robot, Kalman Filter.
Abstract:
Human gait is an important indicator of health. Existing gait analysis systems are either expensive, intrusive,
or require structured environments such as a clinic or a laboratory. In this research, a low-cost, non-obtrusive,
dynamic gait monitoring platform is presented. By utilizing a mobile robot equipped with a Kinect sensor,
comprehensive gait information can be extracted. The mobile platform tracks the skeletal joint movements
while following the person. The acquired skeletal joint data is filtered to improve detection. Gait parameters
such as step length, cadence and gait cycle time are extracted by processing the filtered data. The proposed
approach was validated by using a VICON motion capture system. Results show that the proposed system
is able to accurately detect gait parameters but requires a calibration procedure. Even though the camera is
moving while tracking, the performance is on par with existing works. Step times can be detected with an
average accuracy of around 10 milliseconds. Step length can be detected with an average accuracy of a few
centimeters.
1 INTRODUCTION
An aging society is widely considered to be one of
the main socio-political challenges of the 21
st
cen-
tury. Demographic studies conclude that the Euro-
pean population is aging rapidly (European Commis-
sion, 2014). The share of those aged 80 years or above
is projected to more than double between 2015 and
2080 (from 5.3% to 12.3%). Due to the decreasing
number of nursing professionals, the lack of avail-
able assisted living facilities and the growing num-
ber of people who require regular monitoring, there is
a serious imbalance in providing satisfactory health-
care services (Liu and Liu, 2014). Automated health-
care systems are, therefore, in high demand and there
is growing attention for technologies that support el-
derly people. Robotic systems are an example of
such technologies. They can assist in the rehabilita-
tion and care of patients or elderly in their own home.
Researchers aim to develop systems which can au-
tonomously monitor health indicators with minimal
human intervention.
One of the most important indicators of health de-
cline is human gait. The use of gait data covers a wide
range such as treatment of diabetes (Hodgins, 2008)
and neurological diseases (Keijsers et al., 2006; Haus-
dorff et al., 2000). It can also be used to detect other
adverse events such as decline of physical functions
and fall incidents (Hausdorff et al., 2001; Van Kan
et al., 2009; Viccaro et al., 2011; Peel et al., 2013).
Non-intrusive and precise gait measurement systems
can be applied in diagnosis, health monitoring, treat-
ment and rehabilitation (Hodgins, 2008; Wren et al.,
2011), assisting in early diagnosis and assessment
(Keijsers et al., 2006; Hoff et al., 2001) and measur-
ing medication effectiveness at home (Keijsers et al.,
2003) without the need for patients to reside in reha-
bilitation or nursing homes.
Researchers have proposed several methods for
gait analysis. The most popular tool to study gait is
based on motion capture systems which use IR cam-
eras and markers placed on the subject (Mihradi et al.,
2011a; Mihradi et al., 2011b). Despite being accu-
rate and precise, these systems are often very expen-
sive and require complex setup by placing markers on
the subject’s body before each recording. This makes
them suitable only for laboratory settings. Force
plates are also used for gait analysis, which are also
Amsters, R., Bin Junaid, A., Damen, N., Van de Laer, J., Filtjens, B., Vanrumste, B. and Slaets, P.
Dynamic Gait Monitoring Mobile Platform.
DOI: 10.5220/0006733200490061
In Proceedings of the 4th International Conference on Information and Communication Technologies for Ageing Well and e-Health (ICT4AWE 2018), pages 49-61
ISBN: 978-989-758-299-8
Copyright
c
2019 by SCITEPRESS – Science and Technology Publications, Lda. All rights reserved
49

very costly and thus only applicable in labs and clin-
ics. Furthermore, continuous analysis is not possible
due to a fixed sensor setup and a limited measurement
range or field of view.
Recent studies proposed the use of wearable
sensors (Yang and Hsu, 2010; O’Donovan et al.,
2009). Such systems are more suitable for ambu-
latory measurements in mobile settings as they are
small, lightweight and less expensive. Insole pres-
sure sensors are also used to measure gait parameters
(Crea et al., 2014). However, wearable sensors have
some drawbacks as well. Gravity, noise and signal
drift must be taken into account (Luinge and Veltink,
2005). Sensors must also be placed correctly before
analysis (Kavanagh and Menz, 2008). Markerless op-
tical gait detection systems have been discussed in
the context of biometric identification and surveil-
lance. Single or multiple video cameras can be used
to recognize individuals (Goffredo et al., 2010). An-
other markerless technique was proposed in (Yoo and
Nixon, 2011) but the accuracy of extracted stride pa-
rameters was not verified. Leu et al. (Leu et al., 2011)
focused on extraction of knee joint angles, but not on
standard stride requiring complex setup and calibra-
tion. Van Den Broeck et al. proposed a monitoring
system based on audio senors (Van Den Broeck et al.,
2013). Small and relatively low-cost microphone ar-
rays were used to estimate the location of footsteps.
A best median of errors of 31cm was achieved, but
this accuracy depends on the relative position of the
microphones and the feet.
In this research, a non-intrusive, low-cost system
that can accurately measure a wide range of gait pa-
rameters is proposed which offers a solution for the
aforementioned problems. The system utilizes a mo-
bile robot equipped with a Kinect depth camera. This
is an array of sensors, including a stereo camera and a
depth sensor, enabling it to extract a 3D virtual skele-
ton of the body (Shotton et al., 2013). Being an af-
fordable choice, several researchers have already pro-
posed the usage of a Kinect for monitoring and gait
analysis (Stone and Skubic, 2011a; Stone and Sku-
bic, 2011b; Baldewijns et al., 2014). The combina-
tion with a mobile platform enables continuous moni-
toring by following a person and capturing the move-
ment and trajectory of the subject. The field of view
is concentrated on the person itself and is less dis-
turbed by influences such as other people or moving
objects. With our proposed active subject tracking
system, limitations of the fixed test space and cam-
era occlusions are minimized. Post-processing of the
acquired data allows us to evaluate the gait ability in
terms of cadence, step length and gait cycle time. The
proposed study presents a method for mobile monitor-
ing of gait parameters which can be applied in many
environments. The only requirement is that the floor
should be relatively even (as is the case in most in-
door space without stairs). This will allow the subject
to perform their regular daily activities while the robot
simultaneously tracks the movement and extracts gait
parameters.
2 METHODOLOGY
The proposed solution enables dynamic gait monitor-
ing by following a person and tracking it’s joint po-
sitions. The robot starts by finding a person in the
environment. Presence of a person is detected via im-
ages from the webcam on a laptop. A detection al-
gorithm was written based on the open source image
processing library OpenCV
1
. More specifically, the
Haar feature-based cascade classifier that is proposed
in (Viola and Jones, 2001) was used. This is a ma-
chine learning based approach that trains a cascade
function from images. Alternatively, one could use
the images from the kinect instead of the webcam.
However, the webcam was much easier to interface
with OpenCV. The OpenNI package that tracks the
joint positions occupies the kinect USB port and does
not provide access to the images. Accessing these
images with other programs would require significant
modifications to the OpenNI source code. Seeing as
a laptop was already present on the platform for user
interaction (see section 3.1), we opted to use the on-
board laptop for presence detection. The kinect is
solely used to track the joints.
If a person is detected for the first time, a sound is
played to indicate that the user should perform a ’psi
pose’ (see Figure 1). When the psi pose is success-
fully detected, another sound is played. This tells the
user that they can turn around and start walking. The
robot then initializes the skeleton tracking and starts
following the person while maintaining a fixed dis-
tance from the person. The joint coordinates are saved
and gait data is extracted in post-processing (see sec-
tion 2.3). In case the target is not in the field of view
of the camera, the robot starts looking for the target
again. If the person is then found again, tracking re-
sumes. Figure 2 shows the aforementioned control
scheme.
2.1 Following the Subject
The mobile platform serves as a tool to track and mon-
itor the person simultaneously. Figure 3 illustrates the
process.
1
http://opencv.org/
ICT4AWE 2018 - 4th International Conference on Information and Communication Technologies for Ageing Well and e-Health
50
Figure 1: Initializing the tracking of a person by performing
the ”psi pose”.
Figure 2: Control Scheme.
The Kinect provides depth measurements of the
subject. To keep the person in the middle of the image
frame, a controller was implemented. This enables
better detection of the joints. The goal of this con-
troller is to keep a constant distance of 1.3m between
the person and the robot. This distance provides a
good view for a person of average height. Addition-
ally, the robot should drive in the same direction as
the person is walking. Both the distance and the an-
gle can be controlled by applying either a linear or a
rotational velocity to the robot. The linear velocity is
controlled with a state feedback controller. This type
of controller places the poles of the closed loop sys-
tem at a pre-determined place in the imaginary plane
(Sontag, 2013). Figure 4 shows the feedback loop of
the controller.
This control scheme relies on the formulation of
a state-space model. The model can be obtained by
applying a step input to the motors of the robot, and
identifying the parameters from the subsequent re-
sponse. This leads to the following state space model:
A =
0 1
−0.2 −0.5
B =
0
2
C =
1 0
(1)
Figure 3: Human tracking with the mobile robot. Left: top
view of the system. Right: side view of the system.
Figure 4: State feedback controller (Wahid et al., 2010).
The state vector consists of the robot speed and accelera-
tion along the x-axis ([s] =
˙x, ¨x
), the reference r
re f
is the
desired distance between the robot and the person, the out-
put o is the translational speed of the robot. K and N are
the feedback and feedforward matrices, respectively.
The closed loop poles are defined by the desired con-
troller response. The feedback matrix K can then be
determined via pole placement. A feedforward gain
matrix N is added to control the state around a con-
stant value other than 0. This leads to the following
controller parameters:
K =
22.2057 4.75
N =
2.2239
(2)
These parameters provide satisfactory steady state be-
havior. However, in case the robot is starting from a
stationary position, then the response is too fast. Test
subjects did not have enough time to comfortably start
walking from a standstill. Therefore we also deter-
mined a feedback and feedforward gain matrix that
provide a slower response. These parameters are only
used at the start of the experiment.
K =
0.8064 0.75
N =
0.4888
(3)
Besides keeping an appropriate distance, the heading
angle of the robot should also be aligned with the
Dynamic Gait Monitoring Mobile Platform
51
Figure 5: 3D Joint proposal from depth image (Mac-
Cormick, 2011).
walking direction of the person. In this work, it is
assumed that the person will approximately walk in a
straight line. Therefore the robot angle can be regu-
lated by a much simpler controller. An angular veloc-
ity is applied when the difference between the heading
angle and the torso angle of the person is greater than
0.1 radians.
2.2 Skeleton Tracking
Skeleton tracking is a feature provided by the Mi-
crosoft Kinect sensor. This depth camera consists of
an infrared laser projector combined with a CMOS
sensor, which captures 3-D real-time data. The sens-
ing range of the depth sensor is adjustable, and the
Kinect embedded software is capable of automati-
cally calibrating the sensor based on the environment,
accommodating for the presence of furniture or other
obstacles. Due to the fact that the Kinect uses an in-
frared sensor, it can also operate in low lighting condi-
tions. It produces a virtual skeleton which is detected
by first composing a depth image, then labelling the
body parts and finally estimating the positions of the
joints in 3D. (MacCormick, 2011). Figure 5 gives a
representation of the process.
The OpenNI Tracker package (Field, 2015) pro-
vides an interface for the skeleton detection software
in the Robotic Operating System (ROS). It is provided
by PrimeSense
TM
and returns 3D positions of the fol-
lowing joints: head, torso, neck, shoulders, elbows,
hands, hips, knees and feet.
2.3 Gait Parameters Extraction
The OpenNI tracker returns the raw joint coordinates
of a subject’s skeleton in the camera frame. Addi-
tional post-processing is required to obtain gait pa-
rameters from this data. Figure 6 illustrates the post-
processing steps.
As explained in section 2.1 , the robot follows
Figure 6: Calculating Gait Parameters.
the person during experiments. The joint coordinates
are therefore expressed in a moving coordinate frame.
The first step in obtaining the gait parameters is then
to express the joint coordinates in a static frame. The
camera is mounted at an angle relative to the floor. A
rotation about the local y-axis can be used to align
the joint coordinates with the floor (see Figure 3).
Next, we transform the measurements from the mov-
ing frame to the fixed world frame. This transforma-
tion is achieved by using the robot pose (position and
orientation). The internal encoders give the displace-
ment of the robot between each timestep. By integrat-
ing these displacements, one can obtain a pose at each
timestep relative to the initial pose. The joint posi-
tions in the aligned camera frame should thus also be
rotated by the robot heading angle θ , and translated
by the position of the robot. The joints in the world
frame are thus obtained by:
P
world
= T
R,rob
T
T,rob
T
cam
P
cam
T
cam
=
cosβ 0 sinβ 0
0 1 0 0
−sin β 0 cos β 0
0 0 0 1
T
T,rob
=
1 0 0 x
rob
0 1 0 y
rob
0 0 1 z
rob
0 0 0 1
T
R,rob
=
cosθ −sin θ 0 0
sinθ cosθ 0 0
0 0 1 0
0 0 0 1
(4)
Where P
world
is the joint position in the world frame,
T
cam
is the camera rotation matrix, T
T,rob
is the robot
translation matrix, T
R,rob
is the robot rotation matrix,
P
cam
is the joint position in the camera frame, β is the
camera angle and θ is the robot heading angle (see
ICT4AWE 2018 - 4th International Conference on Information and Communication Technologies for Ageing Well and e-Health
52
Figure 7: Movement of the joints in the world frame.
figure 3). Figure 7 shows the movement of the joints
detected by the depth camera when converted to the
world frame.
The most commonly used gait parameters are the
gait cycle time, the cadence and the length of the
steps. These can all be detected based on the feet po-
sitions. Figure 8 shows the movement of both feet
during a typical gait cycle. At time t
1
, the right foot
is behind the left foot. The distance between the feet
(d
F
, see Figure 8) is maximum at this moment. Next,
the person lifts their right foot and moves it next to
the left foot at time t
2
. The right foot is still in the
air and d
F
is now minimum. Finally, the person com-
pletes the step by moving the right foot in front of the
left foot and placing it on the ground at t
3
. The time
difference between t
1
and t
3
is equal to the gait cycle
time t
g
. This can be converted to a number of steps
per minute:
C
g
=
60
t
g
(5)
Where C
g
is the cadence in steps per minute and t
g
is the gait cycle time in seconds. The step length S
L
is defined as the distance between the positions at the
beginning and end of a step (positions at time t
1
and
t
3
in Figure 8, respectively):
S
L
=
q
(x
b
− x
e
)
2
+ (y
b
− y
e
)
2
+ (z
b
− z
e
)
2
(6)
Where x, y and z are used to represent the coordinates
of the feet positions in the world frame and subscripts
b and e are used to denote the start and end of a step,
respectively.
It is clear that d
F
will be an oscillating signal. Fig-
ure 9 shows an example of d
F
as a function of time.
Both the start and end of a step show up as a peak in
this signal. Therefore we extract the timestamp and
feet positions of every second peak. The time differ-
ence between two peaks is equal to the gait cycle time.
Y
X
S
L
d
F
t
3
t
2
t
1
Figure 8: Movement of a persons feet during a step.
4 6 8 10 12 14
Time [s]
0.0
0.1
0.2
0.3
0.4
0.5
d
F
[m]
d
F
peaks
Figure 9: Distance between feet as a function of time.
The distance between every consecutive peak is equal
to the step length.
This approach does not strictly require the rota-
tion of the camera and robot frame to extract the gait
parameters. Because this extraction is only based on
distance vectors, it will still work even if the robot and
camera angles are not compensated. While the move-
ment along the individual coordinate axes in a rotated
frame might be different, the total distance traveled
is the same regardless of the orientation of the co-
ordinate frame. This means that these angles do not
have to be accurately measured, which reduces hard-
ware requirements for our mobile platform. However,
compensating the angles does enable better visualiza-
tion. Translation to a fixed coordinate frame is re-
quired, and is prone to position measurement errors
(see section 4.4).
Dynamic Gait Monitoring Mobile Platform
53

2.4 Kalman Filter and RTS Smoother
The raw data that is returned by the OpenNI software
is subject to noise. This can result in poor detec-
tion of the gait parameters. Better performance can
be achieved by filtering the data before analysis. In
order to achieve this we implemented a Kalman fil-
ter. The original formulation is a recursive algorithm
that computes the state of a system at each time step.
Additionally, the filter returns the uncertainty on each
state estimate. The algorithm works according to a
two step process. In the first step, a prediction of the
next state is made based on a model of the system’s
dynamics. This step is also called the prediction step.
The second step takes a state-dependent measurement
as an input. This measurement is then compared to a
model that predicts measurements based on the pre-
dicted state. The difference between the predicted and
the real measurement is new information (also called
the innovation). This is weighed with the predicted
state in order to obtain the new state estimate. Math-
ematically, this is expressed as (Thrun et al., 2005):
ˆq
n|n−1
= F
n
˜q
n−1|n−1
+ B
n
u
n
ˆ
P
n|n−1
= F
n
˜
P
n−1|n−1
F
T
n
+ Q
n
ν
n
= z
n
− H
n
ˆq
n|n−1
K
n
=
ˆ
P
n|n−1
H
T
n
H
n
ˆ
P
n|n−1
H
T
n
+ R
n
−1
˜q
n|n
= ˆq
n|n−1
+ K
n
ν
n
˜
P
n|n
= (I − K
n
H
n
)
ˆ
P
n|n−1
(7)
Where q is the state vector, F is the state transition
matrix, B is the control input matrix, u is the con-
trol vector, P is the covariance matrix, Q is the pro-
cess noise covariance matrix, ν is the innovation, z
is a measurement, K is the Kalman gain, H is the
state observation matrix, R is the measurement noise
covariance matrix and I is the identity matrix. Bold-
face symbols are used to represent matrix quantities
(e.g., F ). A tilde symbol is used for estimated quan-
tities (e.g., ˜q
n
), and a hat symbol is used for predicted
quantities (e.g., ˆy
n
). Subscripts n, and n − 1 are used
to denote timesteps.
In our case the goal is simply to smooth the data.
Therefore: F
n
= 1, H
n
= 1, B
n
= 0 and u
n
= 0.
From (7) it can be seen that the state estimate at
timestep n is only directly based on the estimate from
timestep n − 1 and the measurement at timestep n.
This means that the estimate from timestep n − 1 is
in turn based on timestep n − 2, and so on. Hence,
the estimate at timestep n depends on all of the previ-
ous measurements, though to varying degrees. n − 1
has the most influence, n − 2 has the next most, and
so on (Labbe, 2017). In our application, all the data
has already been gathered. Therefore online state es-
timation is not necessary. The estimates can thus be
improved by incorporating future data, which is the
purpose of a smoothing filter. In this work, a fixed-
interval Kalman smoother was implemented. This
type of smoother uses all the measurements from a
fixed observation interval in order to provide an op-
timal state-estimate (Sage and Melsa, 1971). We
used the algorithm proposed in (Rauch et al., 1965).
This is an efficient implementation of a fixed-interval
smoother that is easy to implement. It makes two
passes over the data. In the first or forward pass,
the algorithm works like a regular Kalman filter. The
state estimates and corresponding covariance matri-
ces at each step are saved. In the second or backward
pass, the Rauch, Tung and Striebel smoother (RTS
smoother) runs over the data in the opposite direction
according to the following equations:
C
n
= P
n|n
F
T
n+1
P
−1
n+1|n
ˆq
n|k
= ˆq
n|n
+ C
n
ˆq
n+1|k
− ˆq
n+1|n
P
n|k
= P
n|n
+ C
n
P
n+1|k
− P
n+1|n
C
T
n
(8)
It is clear that during the second pass, knowledge of
the future is incorporated in the state estimate. When
the first measurement is reached, the filtered output
includes all information in a maximally optimal form
(Labbe, 2017).
3 EXPERIMENTAL SETUP
3.1 Mobile Platform
A ROS-based mobile robot (TurtleBot) was used for
the experiments. ROS allows researchers to easily
modify and extend the software according to their de-
sired application. Built-in wheel encoders enable the
estimation of the robot’s position relative to the start-
ing location. The TurtleBot is able to acquire visual
information using the Microsoft Kinect Sensor.
The mobile platform also has a laptop on top
which is running the subject tracking and following
algorithms. The robot was covered with a custom
made dress to obtain a more appealing look to the sub-
jects. Furthermore, the laptop display was used as an
interaction device through an animated face. The face
animation changes according to the robot state. A
happy face animation provides feedback of success-
ful subject detection and tracking, while a sad face is
displayed if there is no subject or in case the subject is
ICT4AWE 2018 - 4th International Conference on Information and Communication Technologies for Ageing Well and e-Health
54
Figure 10: (left) Front of the mobile platform (right) Back
of the mobile platform.
lost. Sound feedback is also used during tracker ini-
tialization. Figure 10 shows the front and back of the
mobile platform.
3.2 Validation
In order to compare and validate the joint move-
ments tracked by the mobile platform, experiments
were performed in the MALL (Movements posture &
Analysis Laboratory Leuven) of Faculty of Kinesiol-
ogy and Rehabilitation Sciences, Leuven. A motion
capture system based on 10 VICON cameras enables
the measurement of 3-D joint motion. This system al-
lows analysis of human movement by placing passive
markers on the subject to measure the orientation and
rotation of body segments. By combining the infor-
mation of adjacent segments, joint angle trajectories
can be calculated. The length of the testing area is
limited to six meters.
3.3 Experiments in the Care Home
Besides validation experiments, informal tests were
also conducted in the care facility Edouard Remy in
Leuven. These tests were conducted within the ethical
and social guidelines of the carehome, and with con-
sent of both the staff and the residents. Additionally, a
staff member was always present during testing. The
residents are mainly seniors aged 65 or above. Some
still have the ability to take care of themselves but
need help with cooking or cleaning, while others have
a mental or physical illness that makes them require
regular assistance. The goal of these experiments was
to evaluate the behavior in a more crowded environ-
ment. Additionally, we wanted to get the response of
residents to our system.
0 2 4 6 8
Time [s]
0.0
0.1
0.2
0.3
0.4
0.5
0.6
0.7
d
F
[m]
kinect
VICON
peaks
peaks (VICON)
Figure 11: Feet distance based on raw measurements (cam-
era angle = 25
◦
).
4 EXPERIMENTAL RESULTS
4.1 Raw Gait Data
A total of 9 experiments were conducted, 4 with a
camera angle of 25
◦
and 5 with a camera angle of 30
◦
.
For each experiment, between 5 and 7 steps could
be measured by the VICON camera before the test
subject moved out of the field of view. One dataset
with a camera angle of 30
◦
was chosen as a calibra-
tion dataset to determine the filter parameters. This
dataset was therefore not included in the error calcu-
lations. One of the co-authors (a healthy adult male)
was used as a test subject for all experiments. The
procedure outlined in section 2.3 was followed to ob-
tain the gait parameters from the joint data. The same
procedure was used to obtain gait parameters from the
VICON data. Figure 11 shows the distance between
the feet as measured by the Kinect and VICON sys-
tems. From this figure it can be seen that the Kinect
systematically overestimates the distance between the
feet. This is in part likely due to the fact that the VI-
CON and the Kinect detect different markers. If the
VICON detects a marker at the inside of a foot, and
the Kinect detects a marker at the middle or outside
of a foot, then this will give an offset difference. The
difference observed in Figure 11 is quite large though,
indicating that there are other sources of error as well.
Most likely the Kinect suffers from detection errors.
The Kinect measurements are assessed in terms of
absolute error and relative error with respect to the VI-
CON measurements which serve as the ground truth.
Table 1 shows the average error ( ¯e) and standard de-
viation (σ
e
) for both camera angles. From the results,
it can be observed that the proposed monitoring setup
is able to accurately detect the times at which a step
occurs. At a camera angle of 25
◦
, the average error
is less than 1 step per minute (approximately 2%). At
a camera angle of 30
◦
, the error is slightly larger at
approximately 2 steps per minute or 5%. The stan-
dard deviation in this case is quite large relative to the
Dynamic Gait Monitoring Mobile Platform
55
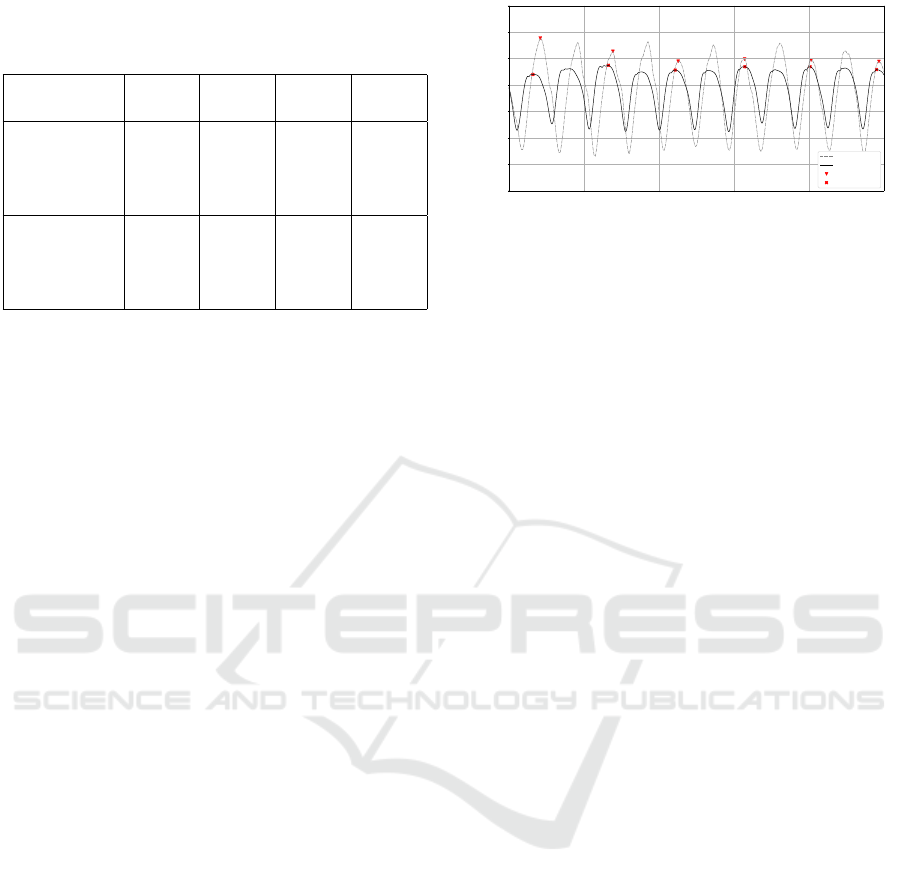
Table 1: Error of raw Kinect measurements. Top: absolute
error with respect to VICON measurements. Bottom: rela-
tive error with respect to VICON measurements.
¯e
(25
◦
)
σ
e
(25
◦
)
¯e
(30
◦
)
σ
e
(30
◦
)
C
g
[SPM] 0.68 0.61 -1.73 2.13
t
g
[s] -0.03 0.03 0.10 0.13
S
L
left [m] 0.24 0.05 0.13 0.05
S
L
right [m] 0.22 0.05 0.12 0.05
C
g
[%] 1.91 1.66 -5.15 6.37
t
g
[%] -1.86 1.59 5.79 7.13
S
L
left [%] 60.86 14.81 30.92 14.17
S
L
right [%] 51.98 11.43 29.29 14.07
mean, indicating a wide spread of the data and thus an
imprecise measurement. Calculation of step length
proves to be much more challenging. The proposed
approach consistently overestimates the step length.
The camera angle also plays a more important role
compared to step time detection. For an angle of 25
◦
,
the average error on a single step is a little over 20
cm (50% - 60%), while for 30
◦
, the average error is
a slightly more than 12 cm (approximately 30%). Al-
though changing the camera angle results in signifi-
cant improvement, the error on the step length is too
large and hence not directly suitable for clinical appli-
cations.
4.2 Kalman Filter
It can be observed from Figure 11 that the raw data
from the Kinect has a significant degree of noise. The
sudden changes and noisy peaks result in poor gait
parameters extraction compared to the VICON data.
Additionally, the feet distance is much larger than
for the VICON measurements, which causes a con-
sistent overestimation of the step length. In order to
improve performance, we implemented a Kalman fil-
ter. In its standard form, this algorithm only relies
on past data. So even though we use it to filter the
data in postprocessing, the Kalman filter could also
be used to estimate the gait parameters during the ex-
periment. The filtering is carried out on the raw joint
coordinates in the world frame (before the calculation
of d
F
). The process and measurements variances (Q
and R, respectively) are therefore expressed in meters.
One dataset with a camera angle of 30
◦
was chosen
as a calibration dataset. Through trial and error, we
determined that a Q of 0.0003m and a R of 0.01m
provide satisfactory results on this calibration dataset.
The same parameters were then applied to the other
datasets. Our filter is thus only calibrated on a single
dataset. Figure 12 shows d
F
after applying a Kalman
filter to the raw data. It can be seen that the filter is
0 2 4 6 8
Time [s]
0.0
0.1
0.2
0.3
0.4
0.5
0.6
0.7
d
F
[m]
kinect (KF)
VICON
peaks
peaks (VICON)
Figure 12: Feet distance based on Kinect measurements af-
ter Kalman filtering (camera angle = 25
◦
).
able to smooth most of the noisy peaks that can be ob-
served in Figure 11. Additionally, the measurements
now more closely resemble the VICON data. The
Kalman filter does introduce a small delay. However,
it is not necessary for the validation that the Kinect
and the VICON measurements are exactly time syn-
chronized, as long as the same steps are measured.
Figure 11 is only for visualization purposes and is not
exactly time synchronized.
Table 2 summarizes the absolute and relative error
after filtering, respectively. It can be observed that the
use of a Kalman filter drastically improves gait pa-
rameter extraction on most fronts. For a camera angle
of 25
◦
, the average error on the cadence is only 0.3
steps per minute. The standard deviation did however
increase to about 1 step per minute. For a camera
angle of 30
◦
, there is almost no error on step time
detection, and the standard deviation is only 30 mil-
liseconds. The step length is still consistently over-
estimated, however. On average, the estimate based
on the filtered measurements deviates from the VI-
CON measurements by approximately 10 cm (20% to
30%). Again, one can observe that using a camera an-
gle of 30
◦
improves results further. There is almost no
difference in cadence compared to the VICON mea-
surements. The error on the step length is in this case
approximately 5cm (10% to 12%). Though the spread
of these results is larger.
4.3 RTS Smoother
A final improvement to the detection process can be
made by smoothing the data after the experiment has
been completed. In contrast to the Kalman filter, this
approach cannot be used for online estimation of the
gait parameters. However, this is not necessary in all
applications. Therefore we also present the results of
this method. Figure 13 shows d
F
after processing the
kinect data with an RTS smoother. The same values
for Q and R as in section 4.2 were used. Improvement
is more gradual then when we added the Kalman fil-
ter to the raw data. One can observe, however, that
ICT4AWE 2018 - 4th International Conference on Information and Communication Technologies for Ageing Well and e-Health
56
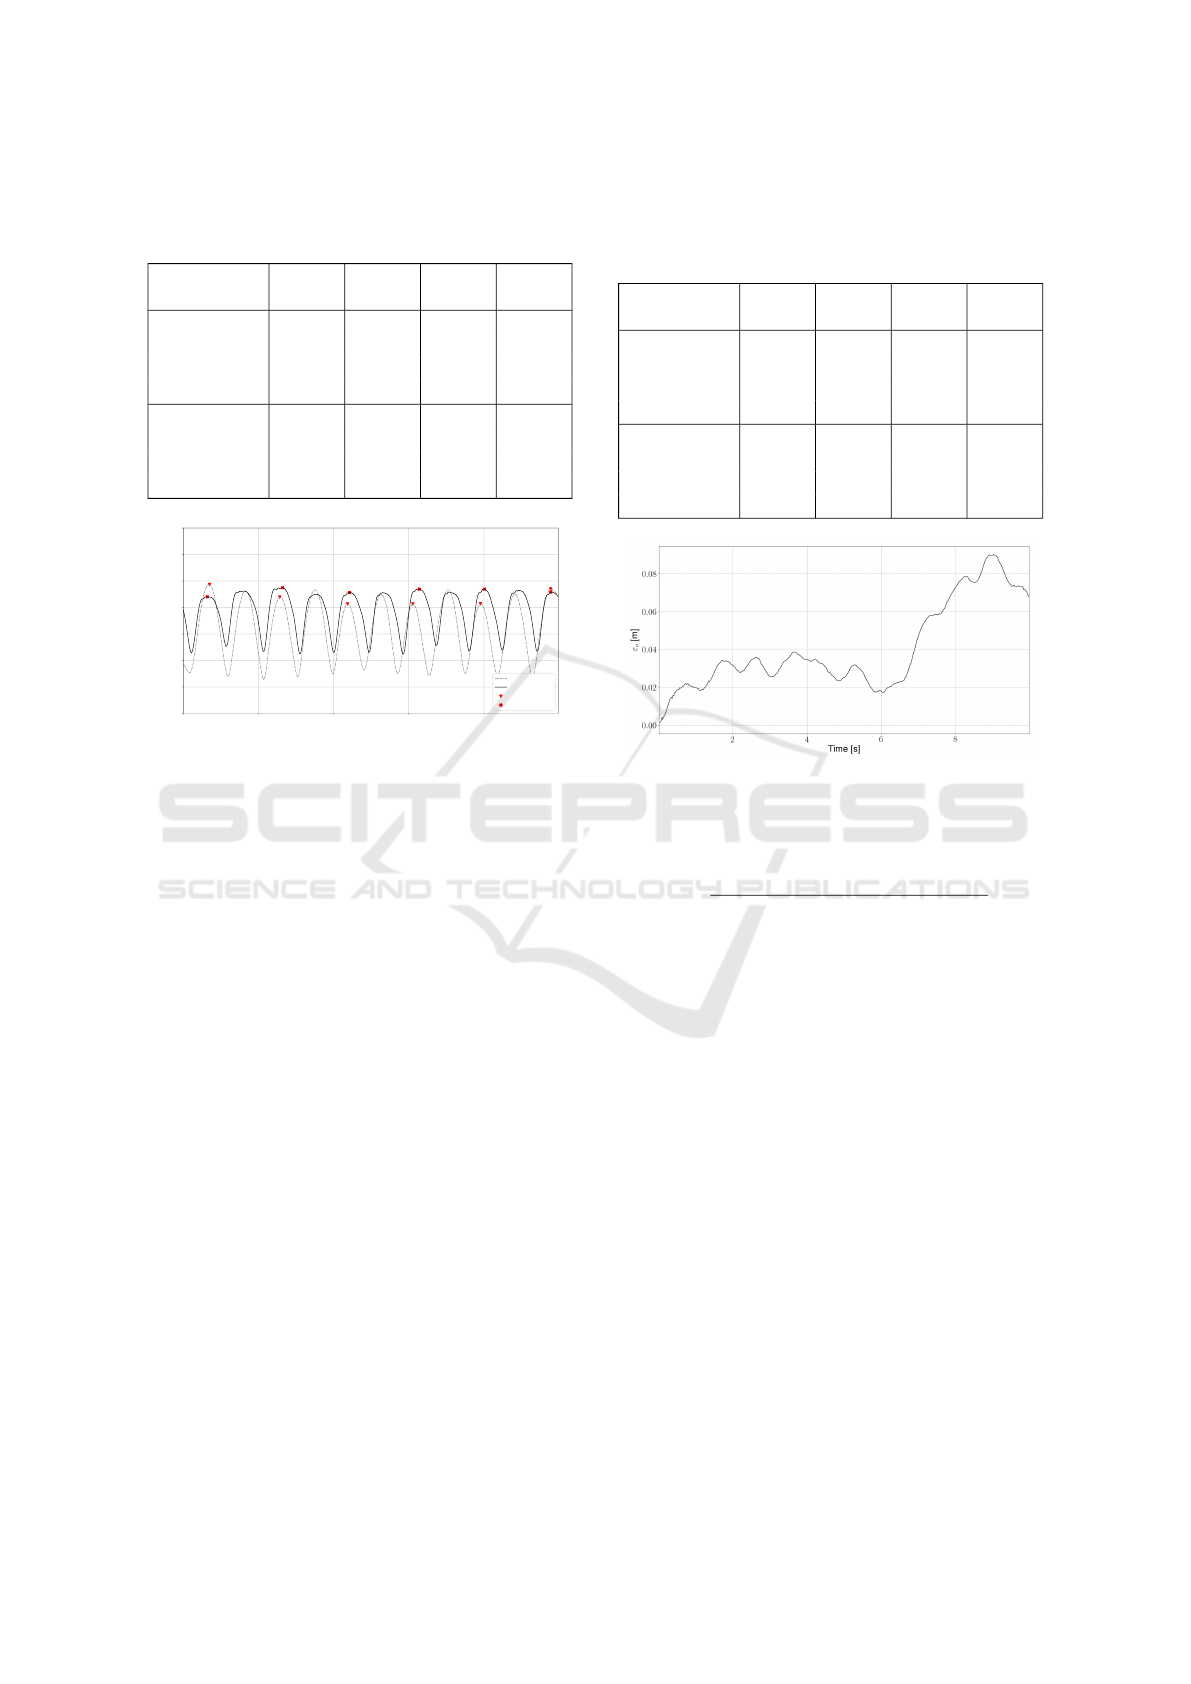
Table 2: Error of measurements after Kalman filtering. Top:
absolute error with respect to VICON measurements. Bot-
tom: relative error with respect to VICON measurements.
¯e
(25
◦
)
σ
e
(25
◦
)
¯e
(30
◦
)
σ
e
(30
◦
)
C
g
[SPM] -0.30 1.27 0.06 0.59
t
g
[s] 0.01 0.06 0.00 0.03
S
L
left [m] 0.12 0.02 0.05 0.06
S
L
right [m] 0.09 0.04 0.04 0.02
C
g
[%] 0.31 1.82 -1.11 3.47
t
g
[%] 0.87 3.66 -0.16 1.77
S
L
left [%] 31.16 8.44 12.05 14.07
S
L
right [%] 20.34 10.17 10.33 6.15
0 2 4 6 8
Time [s]
0.0
0.1
0.2
0.3
0.4
0.5
0.6
0.7
d
F
[m]
kinect (RTS)
VICON
peaks
peaks (VICON)
Figure 13: Feet distance based on Kinect measurements af-
ter RTS smoother (camera angle = 25
◦
).
the RTS-smoother flattens the residual deformations
that can be seen in Figure 12. Additionally, the oscil-
lations are now of the same order of magnitude as the
VICON measurements.
Table 3 gives the absolute and relative error with
respect to the VICON data after applying the RTS
smoother. No large improvements can be observed
for cadence detection apart from the lower standard
deviation of the cadence for a camera angle of 25
◦
.
However, these results were already satisfactory. Im-
provements have been made in regards to step length
detection. The error on the detected step length is now
between 2 cm and 4 cm. This translates to a relative
error between 4% and 8%. For the first time, little
difference can be observed between a camera angle
of 25
◦
and a camera angle of 30
◦
. This illustrates the
increased robustness of the RTS smoother.
4.4 Robot Position Estimates
The robot pose estimates are used to transform the
joint coordinates to a static world frame. These pose
estimates are achieved by integrating the displace-
ments provided by the internal encoders. Because
each measurement has a slight error, this leads to a
drift in position over time. As a result, the world
frame will not be fixed. This has an influence on the
Table 3: Error of Kinect measurements after RTS smoother.
Top: absolute error with respect to VICON measurements.
Bottom: relative error with respect to VICON measure-
ments.
¯e
(25
◦
)
σ
e
(25
◦
)
¯e
(30
◦
)
σ
e
(30
◦
)
C
g
[SPM] 0.26 0.35 -0.10 0.57
t
g
[s] -0.01 0.02 0.01 0.03
S
L
left [m] 0.03 0.01 -0.04 0.05
S
L
right [m] 0.01 0.02 0.02 0.03
C
g
[%] 0.72 0.98 -0.30 1.70
t
g
[%] -0.71 0.97 0.32 1.72
S
L
left [%] 8.60 2.94 -8.26 11.36
S
L
right [%] 1.25 5.42 3.93 6.15
Figure 14: Drift of the robot frame.
gait parameter extraction. Because the orientation of
the VICON coordinate system is not known, this can
only be verified based on the distance to the origin:
r
o
=
q
(x
1
− x
0
)
2
+ (y
1
− y
0
)
2
+ (z
1
− z
0
)
2
(9)
Where r
o
is the distance to the origin, and subscripts
1 and 0 are used to denote the position at the start and
end of the experiment, respectively. Figure 14 shows
the difference between the distance to the origin of
the robot frame as measured by both the VICON and
the encoders (that is, ε
o
= r
o,V ICON
− r
o,robot
). From
this figure it can be seen that the error occasion-
ally decreases, as negative errors get integrated for
a short period. Overall though, the positioning er-
ror increases. At the end of the 5 m trajectory, the
error is approximately 7 cm. We repeated this pro-
cess for other datasets. On average, the error for each
dataset is 10 cm. However, it is not the total drift that
determines the accuracy. Because we are using dis-
placements, only the drift between steps will have an
influence on the gait parameter extraction. This drift
will be much smaller. Therefore we also calculated
the drift between steps for all datasets, which is equal
to 1cm on average.
Dynamic Gait Monitoring Mobile Platform
57

4.5 Experiments in the Care Home
In the first phase, we conducted tests without the dress
and face. Residents were much more disapproving of
the robot in this form, which prompted us to overhaul
its appearance. This lead to a much more positive re-
sponse. Residents were interested about our robot and
were much more willing to participate in our experi-
ments.
Both the person detection and joint tracking soft-
ware were able to perform their tasks satisfactory
even in the presence of multiple persons. The person
that was most visible in the image during initializa-
tion (i.e. was the biggest detected blob) was chosen
as the subject to track. After which, the tracking al-
gorithms were able to distinguish between different
persons in the image. However, in areas with insuf-
ficient lighting, the webcam was not always able to
detect the presence of a person.
Even though the residents generally have slower
walking speed than healthy adults, they still reported
that the speed of the robot was too slow for them.
Finally, tracking has to be initialized by having the
subject perform a psi-pose, which could be a problem
for patients that have limited mobility. However, all
subjects in the care facility were able to initialize the
tracking. A patient who had previously sustained a
stroke had some difficulty, but was also able to per-
form the psi-pose and initialize the tracking on his
own.
5 DISCUSSION
The cost of the proposed system is minimal compared
to other optical gait analysis systems (Mihradi et al.,
2011a). Other cost-effective methods for gait analy-
sis, such as wearable devices (Yang and Hsu, 2010;
O’Donovan et al., 2009) or pressure insoles (Crea
et al., 2014), are usually limited to measuring very
few gait parameters, thus requiring an array of sen-
sors. Our method can be extended to measure other
parameters, such as lower limb angular velocities and
core posture, at the cost of increased computational
complexity. By using the distance between the feet in-
stead of the motion along a single coordinate axis (for
example the z-axis of the foot), we eliminate the need
for an accurate determination of the robot or camera
angle. By mounting the depth camera on a mobile
platform, we are not limited to the field of view of the
camera, as is the case with static cameras. This allows
for much longer continuous measurements. Important
gait indicators can be extracted unobtrusively while
the subject performs daily activities as the robot ac-
tively follows and tracks the skeletal joint movements
unlike static systems (Geerse et al., 2015; Fern’ndez-
Baena et al., 2012). The raw Kinect data is subject
to a relatively high degree of noise. This is partly
due to fluctuations in the detected feet positions. An-
other contributing factor is the vibrations of the robot
platform while it is driving. Loose clothing can also
cause errors in detecting the joint positions. More-
over, the foot displacements are consistently overes-
timated. Therefore the raw Kinect data is not di-
rectly suitable for gait detection and filtering is thus
required. This can be done while the experiment is
taking place with the Kalman filter, though better per-
formance can be reached by using an RTS-smoother
after the experiment has finished. Estimating the gait
parameters during an experiment can be useful for re-
habilitation. Patients could get immediate feedback
that tells them whether they are putting in too much
or too little effort.
The ability to extract gait quality parameters such
as step lengths, cadence and gait cycle with a dy-
namic platform could benefit a variety of populations
requiring rehabilitation and assistive care. Provid-
ing that an overall view of the patients gait quality
is needed, results in this paper showed that measur-
ing these parameters with our mobile robot has simi-
lar performance to what was reported in (Baldewijns
et al., 2014) and (Geerse et al., 2015). The results
were validated with VICON motion analysis system.
We showed that orientation of the camera influences
results significantly when using the raw data or the
Kalman filter. At 30
◦
, the Kinect camera sees a big-
ger section of the person. This allows it to more ac-
curately estimate the positions of the feet. As a result,
the gait parameters can be estimated more accurately.
The RTS smoother is less dependent on the camera
angle.
Future improvements will result in a much more
complete mobile biomonitoring solution. One of the
current limitations is the maximum speed of the robot
of 0.2 m/s. This necessitates a slower than normal
walking speed during the experiments. Thus, a robot
platform with higher maximum speed would be a nec-
essary improvement. Moreover, wheel encoders do
not provide a very accurate position estimation over
long distances. The integration of measurement errors
will cause a drift in position over time, thus affecting
the gait measurements. Relying only on encoder mea-
surements does not provide a global position or a rel-
ative position of obstacles with respect to the robot.
Hence, it is not possible to avoid unexpected obsta-
cles or let the robot navigate autonomously when it
is not monitoring people. Thus, extending the sens-
ing ability of the robot with a laser scanner will allow
ICT4AWE 2018 - 4th International Conference on Information and Communication Technologies for Ageing Well and e-Health
58

the robot to autonomously navigate, avoid obstacles
and localize itself more accurately in a known map.
Alternatively, data from the Kinect could be used for
localization. As mentioned in section 2, this requires
modifications to the OpenNI source code. However,
this would allow the use of a single sensor for both
localization, joint and person detection, which signif-
icantly lowers hardware costs. The controller that was
used is quite a simple implementation. It keeps a rel-
atively constant distance between the person and the
robot. Future experiments could determine the opti-
mal following distance and angle, and optimally con-
trol the robot trajectory accordingly. Additionally, a
single state-feedback controller could be used to con-
trol all variables of interest. Tracking has to be initial-
ized by letting the subject perform a psi-pose, which
impairs autonomous operation of the system. This is
an important drawback over other systems which do
not require this initialization.
Finally, the Kalman filter variances were deter-
mined through trial and error with a single calibration
dataset. Therefore a reference system is still needed
to calibrate the system once with a single dataset. Af-
terwards, the robot can be used without the external
reference. By automatically calculating these param-
eters, the robustness of the proposed approach could
be increased. This could be achieved by, for example,
using the expectation-maximization algorithm (Khan
and Dutt, 2007).
6 CONCLUSION
In this paper, we proposed a marker less gait param-
eter extraction method with simultaneous tracking of
the subject by using a Kinect sensor mounted on a
mobile robot. This overcomes the limitations of a
fixed test space for gait analysis. Compared to the
existing gait analysis systems, this proof of concept
work proposes a cost effective approach which can be
used in different clinical applications. The acquired
skeletal joint data is further processed to extract im-
portant gait parameters such as gait cycle time, step
length and cadence, which are related to different dis-
eases and neurological disorders. We propose meth-
ods for online and offline gait parameter extraction
and compare the results for both methods. The state
feedback controller allows continuous following of
the subject while measuring joint positions. We suc-
ceeded in visualizing the gait performance and vali-
dated the extracted information with a VICON motion
capture system. We confirmed the usefulness of our
proposed method by comparing the results with previ-
ous studies. The results presented in this research are
in good agreement with previous studies despite being
dynamic. However, a calibration with a more accurate
monitoring system is required. Future work will focus
on developing a more suitable robot platform, that has
a higher maximum speed and more interaction capa-
bilities such as a touchscreen. Additionally, a more
sophisticated controller would enable better follow-
ing behavior in more complex environments. Finally,
tracking has to be initialized manually by performing
a psi pose. Automatic starting and stopping of mea-
surements would allow fully autonomous operation of
the robot.
ACKNOWLEDGEMENTS
The authors would like to thank MALL (Movements
posture & Analysis Laboratory Leuven) of the Fac-
ulty of Kinesiology and Rehabilitation Sciences Leu-
ven for providing the motion analysis facilty equipped
with a VICON motion capture system in order to val-
idate the proposed platform. Special thanks goes out
to the care facility Edouard Remy in Leuven, for the
opportunity to perform experiments and for their in-
put. Robin Amsters is an SB fellow of the Research
Foundation Flanders (FWO) under grant agreement
1S57718N.
REFERENCES
Baldewijns, G., Verheyden, G., Vanrumste, B., and Croo-
nenborghs, T. (2014). Validation of the kinect for gait
analysis using the gaitrite walkway. In Engineering
in Medicine and Biology Society (EMBC), 2014 36th
Annual International Conference of the IEEE, pages
5920–5923. IEEE.
Crea, S., Donati, M., Rossi, S. M. M. D., Oddo, C. M., and
Vitiello, N. (2014). A Wireless Flexible Sensorized
Insole for Gait Analysis. Sensors (Basel, Switzerland),
14(1):1073–1093.
European Commission (2014). The 2015 ageing report: Un-
derlying assumptions and projection methodologies.
Fern’ndez-Baena, A., Susn, A., and Lligadas, X. (2012).
Biomechanical validation of upper-body and lower-
body joint movements of kinect motion capture data
for rehabilitation treatments. In 2012 Fourth Interna-
tional Conference on Intelligent Networking and Col-
laborative Systems, pages 656–661.
Field, T. (2015). openni tracker-ros wiki.
Geerse, D. J., Coolen, B. H., and Roerdink, M. (2015).
Kinematic validation of a multi-kinect v2 instru-
mented 10-meter walkway for quantitative gait assess-
ments. PLOS ONE, 10(10):1–15.
Goffredo, M., Bouchrika, I., Carter, J. N., and Nixon, M. S.
(2010). Performance analysis for automated gait ex-
Dynamic Gait Monitoring Mobile Platform
59

traction and recognition in multi-camera surveillance.
Multimedia Tools and Applications, 50(1):75–94.
Hausdorff, J. M., Lertratanakul, A., Cudkowicz, M. E.,
Peterson, A. L., Kaliton, D., and Goldberger, A. L.
(2000). Dynamic markers of altered gait rhythm in
amyotrophic lateral sclerosis. Journal of applied phys-
iology, 88(6):2045–2053.
Hausdorff, J. M., Rios, D. A., and Edelberg, H. K. (2001).
Gait variability and fall risk in community-living older
adults: A 1-year prospective study. Archives of Physi-
cal Medicine and Rehabilitation, 82(8):1050 – 1056.
Hodgins, D. (2008). The importance of measuring human
gait. Medical Device Technology, 19(5):42–44.
Hoff, J., Wagemans, E., Van Hilten, J., et al. (2001). Ac-
celerometric assessment of levodopa-induced dyski-
nesias in parkinson’s disease. Movement disorders,
16(1):58–61.
Kavanagh, J. J. and Menz, H. B. (2008). Accelerometry:
a technique for quantifying movement patterns during
walking. Gait & posture, 28(1):1–15.
Keijsers, N. L., Horstink, M. W., and Gielen, S. C. (2003).
Movement parameters that distinguish between vol-
untary movements and levodopa-induced dyskinesia
in parkinsons disease. Human movement science,
22(1):67–89.
Keijsers, N. L., Horstink, M. W., and Gielen, S. C. (2006).
Ambulatory motor assessment in parkinson’s disease.
Movement Disorders, 21(1):34–44.
Khan, M. E. and Dutt, D. N. (2007). An Expectation-
Maximization Algorithm Based Kalman Smoother
Approach for Event-Related. Transaction of biomedi-
cal engineering, 54(7):1191–1198.
Labbe, R. R. (2017). Kalman and Bayesian Filters in
Python.
Leu, A., Risti
´
c-Durrant, D., and Gr
¨
aser, A. (2011). A robust
markerless vision-based human gait analysis system.
In Applied Computational Intelligence and Informat-
ics (SACI), 2011 6th IEEE International Symposium
on, pages 415–420. IEEE.
Liu, T. and Liu, J. (2014). Mobile robot aided silhou-
ette imaging and robust body pose recognition for
elderly-fall detection. International Journal of Ad-
vanced Robotic Systems, 11(3):42.
Luinge, H. J. and Veltink, P. H. (2005). Measuring orien-
tation of human body segments using miniature gyro-
scopes and accelerometers. Medical and Biological
Engineering and computing, 43(2):273–282.
MacCormick, J. (2011). How does the kinect work. Pre-
sentert ved Dickinson College, 6.
Mihradi, S., Dirgantara, T., Mahyuddin, A. I., et al. (2011a).
Development of an optical motion-capture system for
3d gait analysis. In Instrumentation, Communications,
Information Technology, and Biomedical Engineering
(ICICI-BME), 2011 2nd International Conference on,
pages 391–394. IEEE.
Mihradi, S., Dirgantara, T., Mahyuddin, A. I., et al. (2011b).
Development of an optical motion-capture system for
3d gait analysis. In Instrumentation, Communications,
Information Technology, and Biomedical Engineering
(ICICI-BME), 2011 2nd International Conference on,
pages 391–394. IEEE.
O’Donovan, K. J., Greene, B. R., McGrath, D., O’Neill,
R., Burns, A., and Caulfield, B. (2009). Shimmer: A
new tool for temporal gait analysis. In Engineering
in Medicine and Biology Society, 2009. EMBC 2009.
Annual International Conference of the IEEE, pages
3826–3829. IEEE.
Peel, N. M., Kuys, S. S., and Klein, K. (2013). Gait speed as
a measure in geriatric assessment in clinical settings:
a systematic review. The Journals of Gerontology: Se-
ries A, 68(1):39–46.
Rauch, H. E., Striebel, C. T., and Tung, F. (1965). Maxi-
mum likelihood estimates of linear dynamic systems.
AIAA Journal, 3(8):1445–1450.
Sage, A. and Melsa, J. (1971). Estimation theory with ap-
plications to communications and control. Technical
report, Southern methodist univ Dallas tex informa-
tion and control sciences center.
Shotton, J., Sharp, T., Kipman, A., Fitzgibbon, A., Finoc-
chio, M., Blake, A., Cook, M., and Moore, R. (2013).
Real-time human pose recognition in parts from sin-
gle depth images. Communications of the ACM,
56(1):116–124.
Sontag, E. D. (2013). Mathematical control theory:
deterministic finite dimensional systems, volume 6.
Springer Science & Business Media.
Stone, E. E. and Skubic, M. (2011a). Evaluation of an in-
expensive depth camera for passive in-home fall risk
assessment. In Pervasive Computing Technologies for
Healthcare (PervasiveHealth), 2011 5th International
Conference on, pages 71–77. Ieee.
Stone, E. E. and Skubic, M. (2011b). Passive in-home
measurement of stride-to-stride gait variability com-
paring vision and kinect sensing. In Engineering in
Medicine and Biology Society, EMBC, 2011 Annual
International Conference of the IEEE, pages 6491–
6494. IEEE.
Thrun, S., Burgard, W., and Fox, D. (2005). Probabilistic
robotics. MIT press.
Van Den Broeck, B., Vuegen, L., Van Hamme, H., Moo-
nen, M., Karsmakers, P., and Vanrumste, B. (2013).
Footstep localization based on in-home microphone-
array signals. Assistive Technology: From Research
to Practice: AAATE 2013, 33:90.
Van Kan, G. A., Rolland, Y., Andrieu, S., Bauer, J.,
Beauchet, O., Bonnefoy, M., Cesari, M., Donini, L.,
Gillette-Guyonnet, S., Inzitari, M., et al. (2009). Gait
speed at usual pace as a predictor of adverse outcomes
in community-dwelling older people an international
academy on nutrition and aging (iana) task force. The
journal of nutrition, health & aging, 13(10):881–889.
Viccaro, L. J., Perera, S., and Studenski, S. A. (2011). Is
timed up and go better than gait speed in predicting
health, function, and falls in older adults? Journal of
the American Geriatrics Society, 59(5):887–892.
Viola, P. and Jones, M. (2001). Rapid object detection using
a boosted cascade of simple features. In Computer Vi-
sion and Pattern Recognition, 2001. CVPR 2001. Pro-
ceedings of the 2001 IEEE Computer Society Confer-
ence on, volume 1, pages I–I. IEEE.
Wahid, N., Rahmat, M. F., and Jusoff, K. (2010). Compara-
tive assesment using lqr and fuzzy logic controller for
ICT4AWE 2018 - 4th International Conference on Information and Communication Technologies for Ageing Well and e-Health
60

a pitch control system. European Journal of Scientific
Research, 42(2):184–194.
Wren, T. A., Gorton, G. E., Ounpuu, S., and Tucker, C. A.
(2011). Efficacy of clinical gait analysis: A systematic
review. Gait & posture, 34(2):149–153.
Yang, C.-C. and Hsu, Y.-L. (2010). A review of
accelerometry-based wearable motion detectors for
physical activity monitoring. Sensors, 10(8):7772–
7788.
Yoo, J.-H. and Nixon, M. S. (2011). Automated marker-
less analysis of human gait motion for recognition and
classification. Etri Journal, 33(2):259–266.
Dynamic Gait Monitoring Mobile Platform
61
