
GNSSGET and GNSSPLOT Platforms
Matlab GUIs for Retrieving GNSS Products and Visualizing GNSS Solutions
Maria Kaselimi, Nikolaos Doulamis, Demitris Delikaraoglou and Eftychios Protopapadakis
National Technical University of Athens, Department of Rural and Surveying Engineering,
Heroon Polytechnioy 9, Zografou 15780, Athens, Greece
Keywords: Graphical User Interface (GUI), Global Navigation Satellite System (GNSS), Information Communication
Technology (ICT), Multi-GNSS Experiment (MGEX), Visualization, GNSS Data Processing.
Abstract: The emergence of new satellite systems such as Galileo and BeiDou, as well as the modernization of GPS
and GLONASS, indicate dramatic changes in the field of satellite positioning. IGS initiated the MGEX
(Multi-GNSS Experiment) campaign to overcome the challenges that scientific community has to face due
to the arrival of new satellite systems. The variety of products improves and enhances the solution provided
by multi-GNSS techniques. However, these heterogeneous products are provided by various Data Centers
(DC) and Analysis Centers (AC) in many different locations. Users are therefore required to acquire their
data across multiple FTP Servers, a rather cumbersome and time consuming task. The aim of the work
described in this paper is to create a platform for the acquisition of GNSS data from heterogeneous sources,
for performing high accuracy position solutions and building data visualizations concerning positioning
error and solution accuracy. All of these tasks are essential for the purpose of making complex GNSS data
more accessible, understandable and useful for precise point positioning, atmospheric research and other
applications.
1 INTRODUCTION
Current satellite-based navigation systems include
the following technologies: GPS (American),
GLONASS (Russian), GALILEO (European),
BeiDou (Chinese), QZSS (Japanese) and IRNSS
(Indian). The number of satellites of the newly
developed GNSS systems continues to increase, thus
steadily improving accuracy and reliability in
positioning (Li et al., 2015). New signals are more
resistant to environmental conditions and multipath
errors, while also enabling easier detection of low
level signals (Hofmann-Wellenhof et al., 2008). In
addition, the availability of non-encrypted signals at
multiple frequencies gives a new dimension to
resolving the ambiguity resolution and may also
contribute to the analysis of ionosphere delays
(Montenbruck et al., 2014). However, from the
combination of multi-GNSS observations various
other practical problems have emerged concerning
the compatibility and interoperability between
GNSS systems (Håkansson et al., 2016). To
overcome these difficulties, various Analysis
Centers of the International GNSS Service (IGS)
provide new products so as to improve and enhance
the solution provided by multi-GNSS systems:
tracking station data, coordinates and velocities,
satellite ephemeris, earth rotation parameters, zenith
tropospheric path delay estimates and global
ionospheric maps. Among several institutes and
agencies providing such products are: CODE
(Center for Orbit Determination in Europe), GFZ
(Geo Forschung Zentrum), CNES (Centre National
d'Etudes Spatiales), TUM (Technische Universität
München), WU (Wuhan University) and JAXA
(Japan Aerospace Exploration Agency) (Guo et al.,
2017). Over the past five years, the Multi-GNSS
Experiment (MGEX) has been set-up by the IGS to
track and analyze all available GNSS signals and to
extend its services to GNSS user community by
contributing multi-GNSS observations and data
products from newly established or modernized
monitoring IGS stations (Montenbruck et al., 2017).
In this paper, we describe new software suitable for
gathering distributed data needed for GNSS
processing and visualization of the GNSS data
solutions. This software works in full synergy with
Kaselimi M., Doulamis N., Delikaraoglou D. and Protopapadakis E.
GNSSGET and GNSSPLOT Platforms - Matlab GUIs for Retrieving GNSS Products and Visualizing GNSS Solutions.
DOI: 10.5220/0006756206260633
In Proceedings of the 13th International Joint Conference on Computer Vision, Imaging and Computer Graphics Theory and Applications (VISAPP 2018), pages 626-633
ISBN: 978-989-758-290-5
Copyright
c
2018 by SCITEPRESS – Science and Technology Publications, Lda. All rights reserved
the open source RTKLIB during the stage of data
processing.
The remainder of the paper is structured as
follows: The second section of the paper presents a
brief introduction in GNSS positioning theory. The
third section outlines the features of relevant GNSS
processing software solutions and tools provided by
GNSS receiver’s manufacturers, universities,
institutes and online services, pointing to their
shortcomings with regard to the user effort required
to retrieve various IGS products needed for
processing and to visualize the processing results in
a readily manner. In the fourth section, in lieu of a
comparison, we present the newly created platforms,
highlighting the added functionalities they provide
to the end user. Finally, the fifth section concludes
the paper with a summary of findings.
2 BASIC CONCEPTS IN GNSS
DATA PROCESSING
A variety of applications such as environmental
monitoring, earth-resource mapping and navigation
require high resolution data. These data are derived
from sensors, radars and satellite systems (Massinas
et al., 2017, Protopapadakis et al., 2017).
GNSS positioning is based on the concept of
trilateration, which is the method of determining the
position of an unknown point by measuring
distances to it from points at known coordinates. At
a minimum, GNSS absolute positioning, requires
four simultaneous “pseudoranges” to four satellites,
in order to compute a receiver’s coordinates (x
r
, 𝑦
𝑟
,
𝑧
𝑟
) and time (t) (Figure 1).
Figure 1: Geometric interpretation of absolute positioning
(after http://gisgeography.com/trilateration-triangulation-
gps/).
The transmitted signal from each satellite is
encoded with the navigation message in the so-
called broadcast ephemeris, which can be read by
the user’s GNSS receiver (Blewitt, 1997). The
navigation message includes orbital parameters and
other necessary information, from which the receiver
can compute satellite coordinates (𝑋
𝑆
, 𝑌
𝑆
, 𝑍
𝑆
).
Knowing the signal travel time between receiver and
satellite, the receiver coordinates could be computed
with high accuracy depending on the availability of
the various code and phase measurement
observables.
The observation equations for code and phase
measurements are (Teunissen et al., 2017):
s
r
s
r
s
r
s
r
s
r
s
r
eIT)dtdt(cp
(1)
s
r
s
r
s
r
s
r
s
r
s
r
s
r
MIT
)dtdt(c
(2)
where, dt
r
and dt
s
are receiver and satellite clock
offset from GNSS system time, T
r
S
is troposphere
delay, I
r
S
is ionospheric delay, e
r
S
and ε
r
S
represent
unmodeled errors, λ is the carrier wavelength, 𝑀
𝑟
𝑆
=
𝑁
𝑟
𝑆
+ 𝛿
𝑟
− 𝛿
𝑆
is the carrier phase-ambiguity with an
integer part N
r
S
and the instrumental receiver and
satellite phase delays 𝛿
𝑟
− 𝛿
𝑆
(cycles).
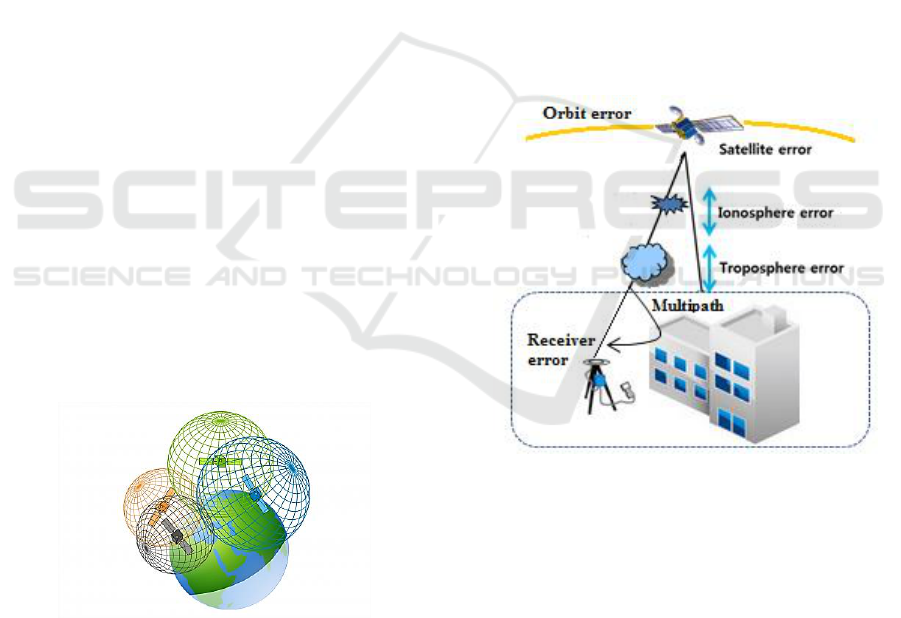
Figure 2: GNSS measurement errors.
The code pseudoranges and phase-based ranges
are affected by various systematic errors or biases
and random noise effects. The error sources can be
classified into three groups, namely satellite-related
errors, propagation-medium-related errors, and
receiver-related errors (Figure 2). Some of the
systematic errors can be modelled and give rise to
additional terms in the observation equations or can
be eliminated by appropriate combinations of the
observables (Hofmann-Wellenhof et al., 2008).
Through a least squares adjustment process of
the available observations, during which all
corrections are made, the adjusted coordinates of the
user receiver’s position can be obtained as a time
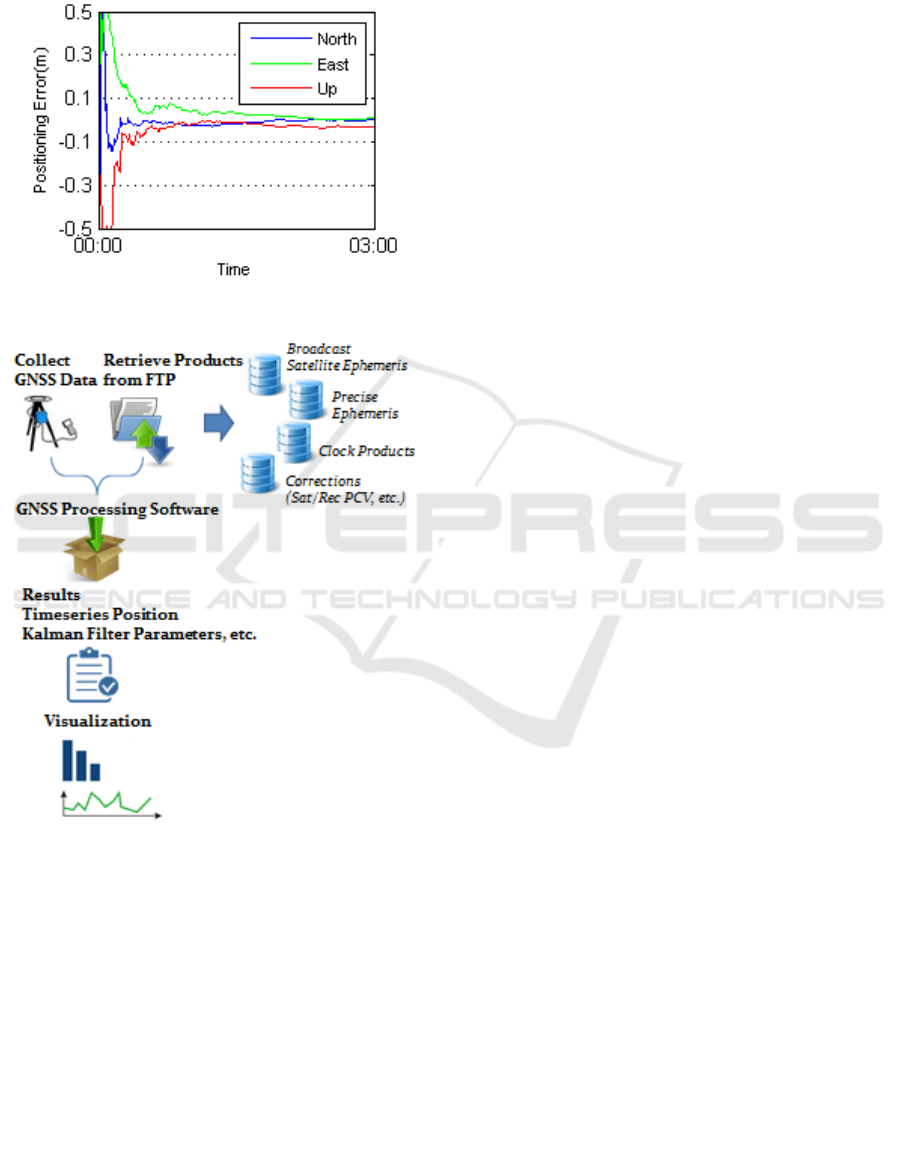
series depicting the convergence of the solution for
each (X, Y, X or North, East, Up) coordinate (Figure
3), and similarly for other estimated parameters (e.g.
tropospheric delays).
Figure 3: GNSS positioning error.
Figure 4: GNSS data processing workflow.
Figure 4 presents schematically the field data
collection and the subsequent computational
procedure involved in order to come up in an
accurate positioning solution, from a given set of
GNSS observations and associated auxiliary IGS
products. First, GNSS receivers collect observations,
remaining in the field for a specific duration (from a
few minutes to several hours or days). Then, the
available products are gathered via FTP Servers.
Having decided on the analysis mode to be applied
to the data, suitable processing is carried out in a
software package with inputs all the data and
available products. The output, in most cases, is a
text file with the positioning solution results
described by time series of various parameters, such
as the estimated states of a Kalman filter, and
residuals of the measurements. For interpreting and
validating the processing results, visualization of the
available position-related time series are used
pervasively in order to enable a rapid visual
assessment and to provide informative ways of
understanding the data itself, as well as the quality
of the positioning solutions obtained.
3 RELATED WORK
Currently, there are many software packages
available for GNSS data processing and
visualization. Most manufactures of GNSS receivers
produce their own software for processing the
observed field data in order to obtain adjusted results
(Mohammed and Eldin, 2011). A typical
shortcoming of available commercial software
solutions is that they do not target many of the
current GNSS data processing and analysis issues
involved. On the other end, universities and research
institutes have developed many high precision
GNSS data processing packages, such as BERNESE
(Dach et al., 2015), developed at the Astronomical
Institute of the University of Bern (AIUB),
GAMIT/GLOBK (MIT) and GIPSY-OASIS (JPL).
Although these packages provide high
performance and high accuracy processing
techniques, currently they only support processing of
GPS and GLONASS observations. Furthermore,
they are not addressed to all professionals and the
average user, as they are not very easy to use. There
are also online tools for post-processing GNSS data,
including the CSRS-PPP (Canadian Spatial
Reference System, Natural Resources Canada), the
Australian GPS processing service AUSPOS, the
GNSS analysis and positioning software GAPS
provided by the University of New Brunswick,
online service APPS (Jet Propulsion Laboratory),
and the commercial magicGNSS by GMV and
CenterPoint RTX post-processing service provided
by Trimble. The processing method mostly used by
many of these online services is based on the Precise
Point Positioning (PPP) technique and the output is
usually a positioning solution file solution and report
is generated in ASCII format. Characteristically,
most of the above services do not provide a user-
oriented graphical interface platform for exploitation
of advanced GNSS algorithms and available IGS
products. Furthermore, they don’t provide the

capability for interactive visualization of GNSS
position tracks for each station, for the purpose of
enabling the identification of temporal relationships,
jumps or deviations from expected trends etc.
The RTKLIB (Takasu, 2013) suite is open
source software for standard and high-precision
positioning using observations from all currently
available GNSS satellite systems (GPS, GLONASS,
Galileo, BeiDou, QZSS). It was developed by T.
Takasu at Tokyo University of Marine Sciences and
Technology and has been available for free since
2006. The fact that RTKLIB code is accessible to
users, allows code modification and improvement,
meeting user’s needs. Since 2006, major
improvements have been made to the software
(latest version v.2.4.2), both by its developers and
RTKLIB users. RTKLIB consists of a portable
program library and several APs (application
programs) utilizing the library in order to facilitate
satellite data processing and determine the exact
station’s location. In addition, RTKLIB supports
several file formats, such as RINEX, RTCM,
NTRIP, ANTEX, and IONEX files. Also provides
limited capability to process and convert data, to
visualize the visibility (azimuths and elevations) and
the number of the used satellites against time, and to
export position results. This paper targets to deal
with RTKLIB's disadvantages by improving
RTKLIB's platforms for data acquisition and
visualization. One disadvantage is that RTKGET has
a complex procedure for data acquisition, causing
confusion in most of the users. RTKPLOT interface
doesn’t include statistics and metrics of computed
solutions. Furthermore, RTKLIB’s interface doesn’t
plot code and phase residuals.
4 THE GNSSGET AND
GNSSPLOT PLATFORMS
The newly developed GNSSGET and GNSSPLOT
platforms have been created with the aim to allow
the user, in a more transparent way, to communicate
with the RTKLIB software while retrieving data
from FTP Servers and performing user-selected
visualization tasks at the end of the data processing
stage. The technology and programming techniques
applied for the development of these platforms was
based mainly on MATLAB which provides the
ability to develop GUI applications through the
GUIDE (Graphical User Interface Development
Environment). GUIDE is a graphical environment
where a developer can build a GUI application, by
selecting various objects -included in the final
application- and by selectively adjusting various
application parameters related to the GUI. In that
way, certain properties of the user interface and
graphics components corresponding to a specific
user action can be associated with specific call-back
functions. This provides point-and-click control of
software applications, eliminating the need to learn a
language or type commands in order to run the
application. These platforms aren’t open source and
freely available to the users as they have been
developed with MATLAB 2008 version.
GNSSGET is essentially an Information
Communication Technology (ICT) platform which
acts like an umbrella, collecting information from
distributed data sources. Products vary, based on
parameters such as: time, space, file format,
Analysis Centers and product type. Various IGS-
coordinated Institutes and Data Centers provide
GNSS data via communication protocol FTP. The
objective of the application is to retrieve data from
isolated data sources and store them in the local
disk. This is accomplished by selecting few desired
parameters. The application functions are: storage of
GNSS observations and preview, retrieval of
broadcast and post-fit precise orbital data and
associated products and their storage on the local
hard disk. GNSS data and products, retrieved from
FTP Servers, are spatiotemporal big data, that is can
be in high volumes, and in compressed or
uncompressed form. Following the data collection,
GNSS data processing is carried out, by
communicating automatically the data to RTKLIB
and applying appropriate models and methods for
positioning and eventually generating position
solution results.
The next stage is the visualization of the results
which prompted us to build GNSSPLOT GUI.
Visualization includes time series diagrams,
statistics and metrics, plotting position history of
each GNSS station or georeferenced ground tracks
using Google Maps as background, Kalman filter
residuals and parameters as a function of time.
These two interfaces aim to direct the user,
minimizing errors from handling the available data.
In order to achieve this goal, these platforms provide
dynamic lists and warning messages to prevent the
user from frequent or common mistakes. The most
important functions are:
Gathering isolated GNSS data and products
via numerous FTP servers
Capability of local data storage and
decompression
Positioning error time series visualization
Code and phase residual visualization
GNSS systems and satellites residuals
isolation
Kalman filter parameters visualization
These platforms cooperate fully with the
RTKLIB software in order to provide the best
possible result.
4.1 GNSSGET Platform
GNSSGET platform has the ability to gather the
distributed information needed through separated
servers. A major advantage is that GNSSGET
platform is already interconnected with these FTPs,
so user doesn’t need to establish data
communication links.
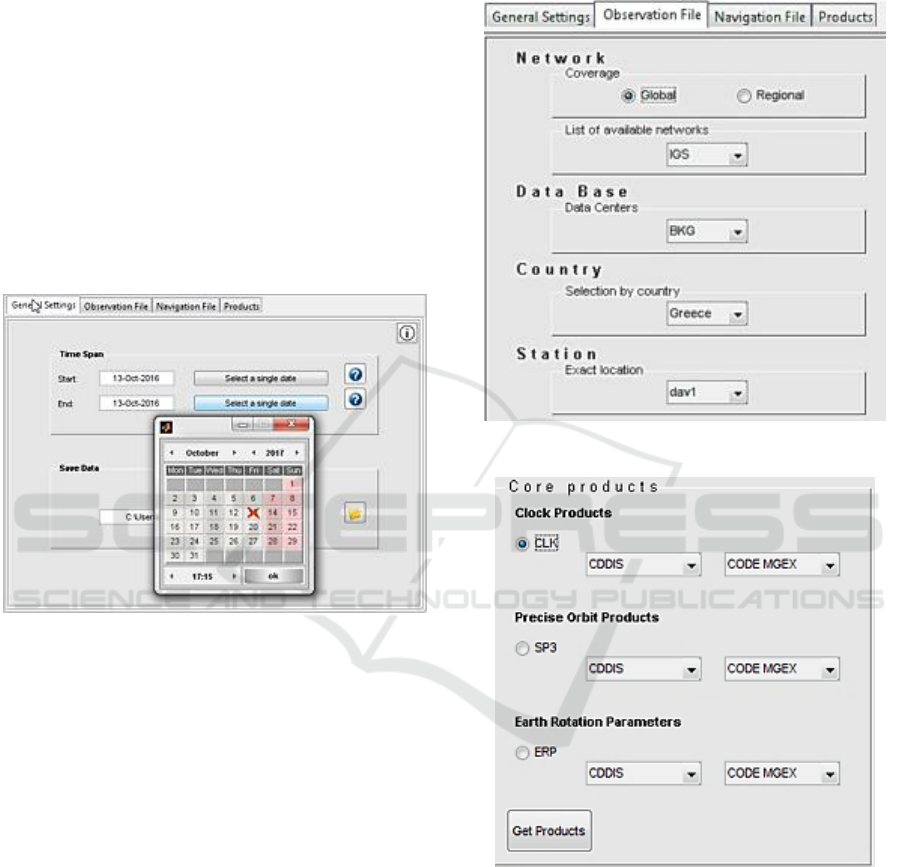
Figure 5: GNSSGET platform overview.
The user has the ability to select a specific data
time duration, which is necessary in order to pick the
suitable data from the FTP servers. Also, the user
should fill in the tab showing the local path where
downloaded data will be stored (Figure 5).
In the next step, the user is required to select the
desirable parameters concerning the observation
data, through multiple sets of paired drop down lists.
The option between selecting global or regional
networks triggers different categories of available
networks appearing in the pop-up menu that follows.
Subsequently, the Data Centers pop-up menu
changes dynamically, depending on the selected
network. Each selected Data Center deals with data
from stations in different countries. Having selected
the preferred location (country), the associated
stations list is displayed. Hence, the user selects via
a menu with variable networks, the data bases
containing specific types of data and the desirable
location of each station. (Figure 6).
Selected observation and navigation files could
be previewed, pressing the corresponding button.
Also, the platform has the ability to inform the user
in case of a missing file.
Figure 6: Options for observation files selection.
Figure 7: Selection of download data type products, in
GNSSGET.
From the tab named “Products”, the user can
choose through a variety of products such as: clock
products, precise orbit ephemeris and earth rotation
parameters, as they provided by various data bases
and institutes that can be seen through the click-and-
display menus (Figure 7). Among each product
(CLK, SP3, ERP), a set of two paired select boxes
exists. User’s selection in the first select box affects
the options in the other select box. By pressing the
button “Get Products”, the desirable products are
downloaded and stored in the local disk. When the
process is finished, a suitable message appears on
the white bar.
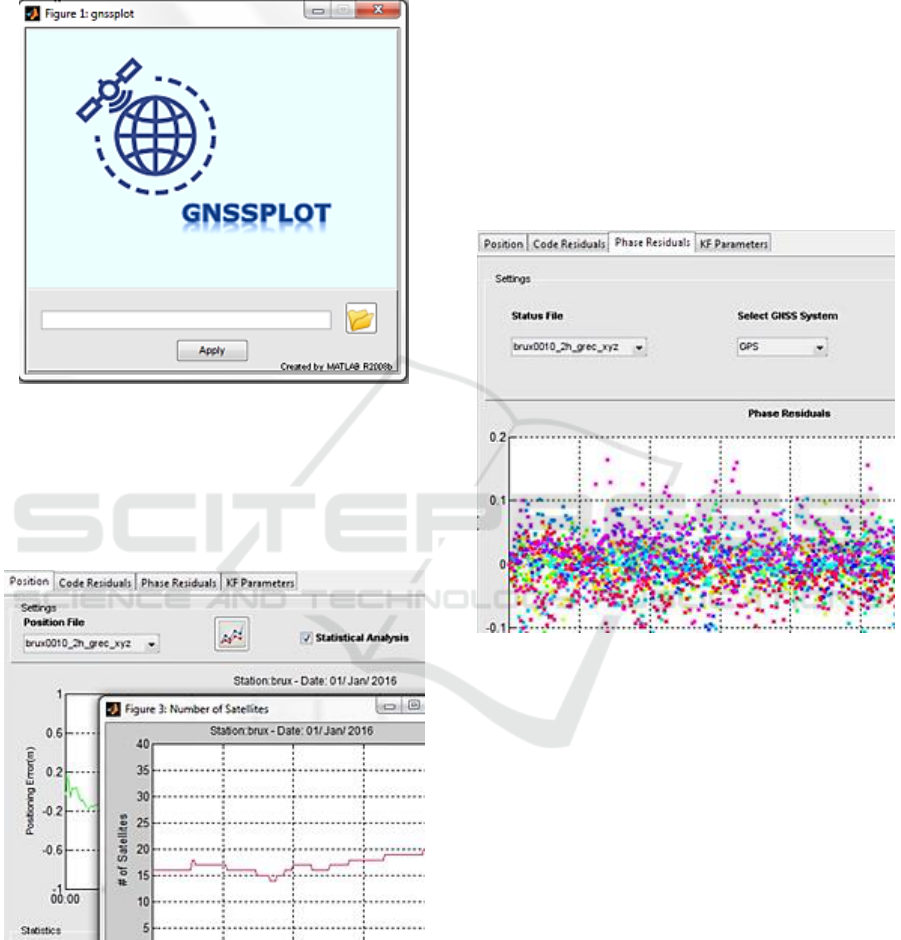
Figure 8: Introductory menu, in GNSSPLOT.
4.2 GNSSPLOT Platform
GNSSPLOT is a platform for GNSS solutions
visualization, including time series diagrams,
statistics and metrics.
Figure 9: Tab “Position”, in GNSSPLOT.
Initially, an introductory menu is displayed as
“welcome window”, to allow the user to enter into
the program. Platform has the capability to search
the file folder as extracted from RTKLIB. The
platform has been created to automatically recognize
the number and useful types of files (.pos, .stat) that
are contained in this folder. In the event that the
folder does not contain files with .pos format, as
extracted from RTKLIB, then a corresponding
warning message appears on the screen (Figure 8).
On the other hand, GNSSPLOT reads
positioning files (.pos) and status files (.stat) and
stores their names in order to appear in the main
interface, in a pop-up menu form. Then, a window
with four tabs -displaying the main menu- opens. As
already mentioned, the select box up-left contains
the file names that exist in the specified folder. Thus,
the activation of the first tab named “Position”
(Figure 9) requires the existence of a positioning file
in the specified folder.
Figure 10: Code residuals visualization.
Among GNSSPLOT’s advantages, the
visualization of positioning errors is included.
Furthermore, statistics such as mean and standard
deviation are computed. This platform also allows
users to visualize the georeferenced ground track (by
pressing the button “Ground Track”), in Google
Maps background. GNSSPLOT provides the ability
to easily display ground track at any scale, using the
zoom in property, thus it is possible to visualize the
ground track. In addition, the number of visible
satellites over time can be plotted (by pressing the
button “View of satellites”).
Reading a status file, if it exists, code and phase
residuals can be plotted, in the second (Figure 10)
and the third tab.
Selecting a single GNSS system, from the second
pop-up menu, the residuals from all observations to
this satellite system are plotted (Figure 11).
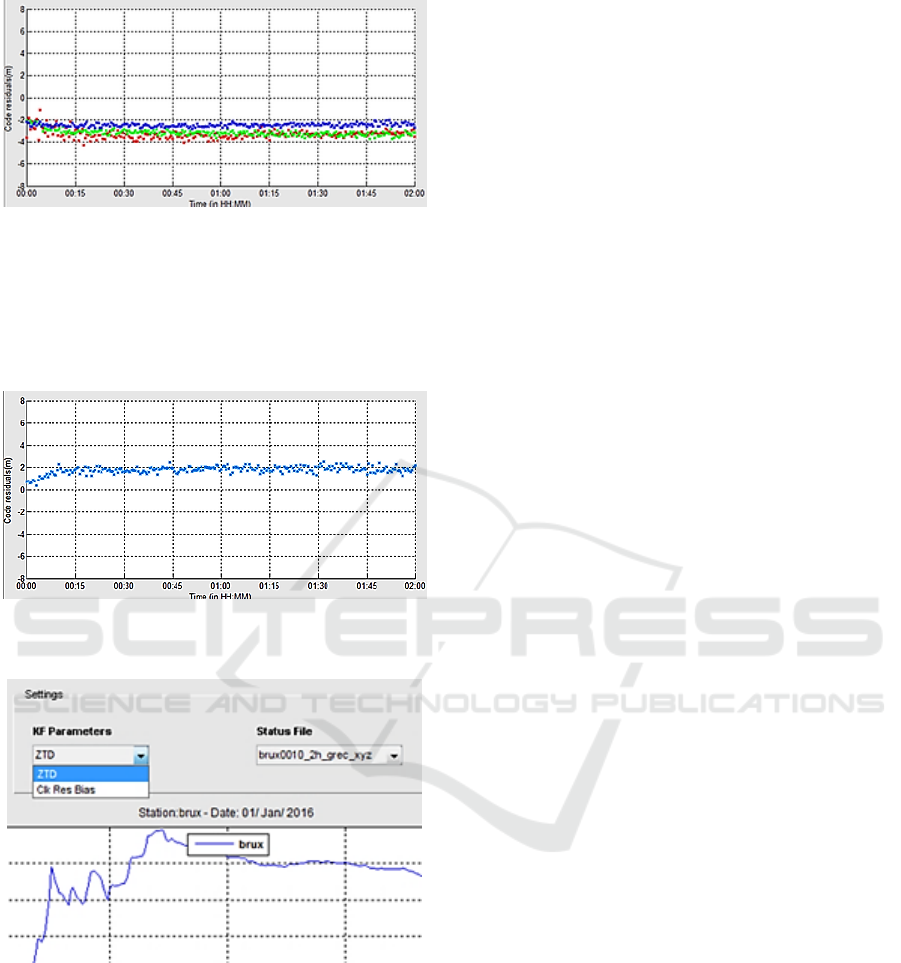
Figure 11: Code residuals for Galileo satellites, G31, on
1/1/2016.
Also, there is the possibility of selecting a single
satellite from the third pop-up menu (Figure 10).
This way the errors from this specific satellite can be
displayed (Figure 12).
Figure 12: Code residuals for GPS satellite, G31, on
1/1/2016.
Figure 13: Kalman filter parameters visualization.
Finally, zenith total delay (ZTD) and receiver
clock bias are displayed in the fourth tab (Figure
13). In the first step, the user selects the type of data
between ZTD and receiver clock bias in order to be
plotted. In the next step, the user selects the status
file name. Selecting any of the above-mentioned
lists the plot is triggered.
All plots can be locally stored by pressing right-
click on the image. Both newly developed platforms
can be extracted in an application executable from
MATLAB environment, thus providing a standalone
application running in Windows. Necessary libraries
needed for installation, are extracted from MATLAB
and are installed together with a standard application
installation.
5 CONCLUSIONS
The usage of multi-GNSS positioning systems offers
several advantages for the user, mainly due to the
increased number of available satellites and the
enhanced user-to-satellites relative geometry (Cai et
al., 2015, Li et al., 2015). As a result, the quality of
positioning solutions is being improved, while the
time required for field observations is being reduced.
System interoperability is very important towards
ensuring, higher accuracies in the future.
Many services and Analysis Centers provide
products and observations from permanent stations
which can be extremely useful in that respect.
However, their proper usage is often confusing to
the new users. To ease the tasks involved,
GNSSGET is a platform, which can be used to
download data and products from existing online
databases through the FTP communication protocol.
Proposed platform provides the ability of data
extraction among different Analysis Centers. This is
achieved by selecting a desirable set of features
provided by dynamically changing lists that
communicate with each other and at the same time
complement one another. Data are stored in a
location per service, type of processing, and time,
with the initial path for the storage of data indicated
by the user. GNSSPLOT, focuses on visualizing
solutions, derived from RTKLIB.
Unlike the extension of RTKLIB -RTKPLOT-
which permits the visualization of a single set of
solutions, the GNSSPLOT interface has the ability
to visualize multiple sets of solutions by simply
changing the options of a dynamic list. Furthermore,
GNSSPLOT is a powerful tool to visualize GNSS
position time series and other corrections and
residuals.
The authors plan to create a web service in order
to fully provide the platform’s abilities to the users.
This future service will include all the above
mentioned functions that are provided through
platforms GNSSGET and GNSSPLOT.
Furthermore, the web service is more convenient as
the installation of a standard application in the PC
wouldn’t be prerequisite. The exploitation of similar
platforms should be considered in other applications
as well (e.g. intangible cultural heritage digitization).

ACKNOWLEDGEMENTS
This work was supported by the EU H2020
TERPSICHORE project “Transforming Intangible
Folkloric Performing Arts into Tangible
Choreographic Digital Objects” under the grant
agreement 691218.
REFERENCES
Blewitt, G., 1997. Basics of the GPS Technique:
Observation Equations. Appears in the textbook
“Geodetic Applications of GPS,” published by the
Swedish Land Survey
Cai, C. and Gao, Y., Pan, L., Zhu, J., 2015. Precise point
positioning with quad-constellations: GPS, BeiDou,
GLONASS and Galileo. Advances in Space Research,
April 56(1). 133-143
Dach, R., Lutz, S., Walser, P., Fridez, P., 2015. User
manual of the Bernese GNSS Software, Version 5.2.
Astronomical Institute, University of Bern
Guo, F., Li, X., Zhang, X., Wang, J., 2017. The
contribution of Multi-GNSS Experiment (MGEX) to
precise point positioning. Advances in Space Research
59(11)
Håkansson, M., Jensen, A., Horemuz, M., Hedling, G.,
2016. Review of code and phase biases in multi-GNSS
positioning. GPS Solutions 21(3)
Hofmann-Wellenhof, B., Lichtenegger, H., Wasle, E.,
2008. GNSS – Global Navigation Satellite Systems
GPS, GLONASS, Galileo, and more.
SpringerWienNewYork
Li, X., Zhang, X., Ren, X., Fritsche, M., Wickert, J.,
Schuh, H., 2015. Precise positioning with current
multi-constellation Global Navigation Satellite
Systems: GPS, GLONASS, Galileo and BeiDou.
Scientific Reports 5
Massinas, B. A., Doulamis, A., Doulamis, N.,
Protopapadakis, E., & Paradissis, D. (2017). Deep
Convolutional Neural Networks for Modeling Patterns
of Spaceborne Interferometric SAR Systems Signals.
In AIAA SPACE and Astronautics Forum and
Exposition (p. 5164)
Mohammed, N.Z. and Eldin, M.B., 2011. Software
Testing of GPS Data Processing. International Journal
of Computer Science and Telecommunications 2(2)
Montenbruck, O., Steigenberger, P., Prange, L., Deng, Z.,
Zhao, O., Perosanz, F., Romero, I., Noll, C, Stürze, A.,
Weber, G., Schmid, R., MacLeod, K., Schaer, S.,
2017. The Multi-GNSS Experiment (MGEX) of the
International GNSS Service (IGS) – Achievements,
prospects and challenges. Advances in Space Research
59(7). 1671-1697
Protopapadakis, E., Voulodimos, A., Doulamis, A.,
Doulamis, N., Dres, D., & Bimpas, M. (2017). Stacked
Autoencoders for Outlier Detection in Over-the-
Horizon Radar Signals. Computational Intelligence
and Neuroscience, 2017
Takasu, T. (2013) - RTKLIB ver. 2.4.2 Manual,
http://www.rtklib.com/prog/manual_2.4.2.pdf (last
accessed Nov. 2017)
Teunissen, P. and Montenbruck, O., 2017. Springer
Handbook of Global Navigation Satellite Systems.
Springer
