
Delimitation of Urban Areas with Use of the Plataform Google
Engine Explorer
Sherlyê Francisco de Carvalho
1
, Jhonatha Fiorio Conceição Guimarães
1
,
Carla Bernadete Madureira Cruz
2
and Elizabeth Maria Feitosa da Rocha de Souza
2
1
Institute of Geosciences, Rio de Janeiro Federal University, Computer and Mathematical Science, Rio de Janeiro, Brazil
2
Department of Geography, Rio de Janeiro Federal University, Rio de Janeiro, Brazil
Keywords: Google Engine Explorer, Urban Expansion, Mapping Urban, Remote Sensing.
Abstract: Google Earth Engine is a cloud computing platform for developing and hosting web applications that allows
for the automatic sorting and mapping of terrestrial coverage. The objective this research is to evaluate the
tool's potential for the generation of thematic maps of urban areas, using a big data plataform, with data in
the cloud. The proposed methodology evaluate the CART classifier for different scales. The local scale
considered the area of Rio de Janeiro city. A simplified legend (urban and non-urban) and other with greater
detailing (different types of urban intensify), were tested. The main input was the Landsat TOA (Top of
Atmosphere) mosaic. Potential, classification time, and results were evaluated. The main products generated
were the temporal classifications, in which one can observe the expansion of urban areas and some
confusion between classes. In this case editing is necessary. The rapidity in the classification and generation
of products is one of the most important positive points of the analysis. The tool is very interactive and easy
to handle, even by users with little experience. The urban areas delimitation and identification were
promising, requiring more research on the best techniques to be adopted at each geographic scale.
1 INTRODUCTION
Geography as a science deals with the analysis of
space and the actions of transforming agents of this
space.
The traditional mapping based on the use of
desktop tools, in actual moment has been
complemented by the use of online platforms for
data storage and processing.
In this context, cloud computing and the use of
Big Data are presented as a potential model for
spatial analysis, and mapping.
The Google Earth Engine, and in special the
Earth engine Explorer, is a tool with enormous
potential to create geographic analyzes, in
attending to several applications in the geosciences,
and to the Geography.
Among the potential analyzes is the
delimitation of urban areas and their expansion,
from mappings and the monitoring of these areas.
2 RELEVANCE
Given the increasing volume of data generated daily
it is important to consider the use of spatial analysis
tools that allow integration, ease of access and speed
in data processing.
The access and sharing of the web, brings in this
way, the discussion about of the Big Data concept of
and the online systems for the generation of
mappings and geographic analyzes.
The evolution of cloud computing is one of the
greatest advances in the history of computing,
becoming a new paradigm in recent years. Among
the various existing definitions, cloud computing can
be defined as a collection of virtualized and
interconnected computers that provide computing
resources and services and are dynamically
provisioned and presented based on an agreement
between the service provider and the consumer
(R.Buyya, 1999). In a simpler way, it can be
considered as a virtualization of a data center,
where servers are virtualized seeking the best
use of their resources that are made available
Carvalho, S., Guimarães, J., Madureira Cruz, C. and Feitosa da Rocha de Souza, E.
Delimitation of Urban Areas with Use of the Plataform Google Engine Explorer.
DOI: 10.5220/0006756602550261
In Proceedings of the 4th Inter national Conference on Geographical Information Systems Theory, Applications and Management (GISTAM 2018), pages 255-261
ISBN: 978-989-758-294-3
Copyright
c
2019 by SCITEPRESS – Science and Technology Publications, Lda. All rights reserved
255

through virtual machines. A cloud can be
deployed publicly, with a service provider
providing the resources and services that the
organization needs, or privately, and is managed
internally by the organization. There may also be
a hybrid structure where an organization
maintains an internal infrastructure and provides
some services publicly. A public cloud is
characterized by being available through a third
party service provider via the Internet. It is a
cost-effective way to deploy an IT solution,
especially for small and medium-sized
enterprises, and government entities that need to
provide a variety of services to the population.
The leading companies that provide cloud
computing services are Amazon AWS, Microsoft
Azure and Google Cloud. In addition to these,
there are several companies that provide only
certain services, such as storage.
3 OBJECTIVES
The objective of the present work is to evaluate the
potential of the Google Earth Engine Explorer tool
aiming the generation of thematic maps for the
delimitation of urban areas using Cloud Computing,
Big Data and Remote Sensing.
- To evaluate the mapping of urban areas from
the Google Earth Engine platform using
Explorer mode, with the CART classifier, to
the limits of the Rio de Janeiro city and scale
regional too.
- Generate a mapping of urban delimitation
and expansion considering different
occupancy intensities.
4 CONCEPTUAL REVIEW
4.1 Data and Spatial Information
The given terms and information academic are used
several times with the same meaning, but in reality
they have different meanings. Given is the set of
different observations that are collected and stored.
Information is a data that is useful for answering
questions or for solving a problem, and has a
interpretation.
Two major trends have had a profound impact on
spatial data management in recent years. The first of
these is the exponential growth of the data volume.
the secund is the change of criteria for a database to
be considered to be large, and this is the result of the
wide integration of spatial information in
productions continues from many users.
Another important aspect is the current spatial
distribution of the users of geographic information
accessing contents in different places and with
differentiated platforms.
4.2 Geographic Data Base and BIG
DATA
A geodatabase is a database capable of storing,
querying and manipulating geographic information
and spatial data of any kind.
With it you can manipulate simple geometric
shapes: dots, lines and polygons, or to use features
such as topology, 3D technology, images, to better
represent real-world phenomena.
The geodatabase can be stored on top database
management systems and allows to organize and
manage a huge volume of high-performance data in
a multi-user environment.
The challenges in a geodatabase, among others,
are: analysis, capture, treatment, search, sharing,
storage, transfer, viewing and data privacy
information.
Big Data is a term that has long been used to
name very large or complex data sets that traditional
(desktop) data processing applications still can not
handle.
In other words, the ever-increasing production of
large-volume data requires new alternatives for data
management, online data sources, and the need for
processing beyond traditional methods.
Cloud computing distributes resources in the
form of services. We can then divide it into three
types: Software as a Service (SaaS), Platform as a
Service (PaaS) and Infrastructure as a Service
(IaaS).
Software as a Service (SaaS) The SaaS model
provides software systems for specific purposes,
which are accessed via the Internet by a web
browser for example. In SaaS, you do not manage or
control the infrastructure of the lower layers, except
for specific system configurations. With this,
developers focus on innovation rather than
infrastructure, leading to the rapid development of
software systems (Souza et al., 2010). user can use
vendor applications that run on a cloud
infrastructure. But the consumer does not manage or
control the basic infrastructure, including network
clouds, operating systems, storage, servers. SaaS
GISTAM 2018 - 4th International Conference on Geographical Information Systems Theory, Applications and Management
256

runs entirely on the cloud bringing cost savings, thus
dispensing with the acquisition of software licenses.
Platform-as-a-Service (PaaS) PaaS providers
provide development environments so that
developers do not have to worry about the
infrastructure that will be used, not even with the
installations of the environments used by their
applications, expensive and complex jobs in the vast
majority of cases. In PaaS, users do not have cloud
infrastructure management, but have control over the
deployed applications and the ability to configure
the hosted application environment. consumer can
deploy in the cloud the infrastructure created or the
acquired applications created using programming
languages and the tools supported by the provider. It
does not manage or control the basic infrastructure,
but controls used applications and hosting
applications and environment settings. Provides an
infrastructure to deploy and test applications in the
cloud. It also provides an operating system,
programming languages and development environ-
ments for applications, aiding the implementation of
software, as it contains development tools and
collaboration between developers.
Infrastructure as a Service (IaaS) the term IaaS,
refers to a computational infrastructure that uses
virtualization techniques to deliver computational
resources. An infrastructure in the IaaS model aims
to make it easy and affordable to manage and deliver
computing resources, that is, it is responsible for
providing resources such as servers, network,
storage and even operating systems and applications
required to build a environment on demand. In
addition to providing in most cases, online services
for infrastructure administration, such as a web
interface. Because it is the lower layer, it is also
responsible for providing the infrastructure used by
the middle and upper layers. Amazon EC2 (Cloud
Virtual Servers) and Amazon S3 (Scalable Cloud
Storage) services are examples of IaaS. Cloud
providers usually charge for the IaaS service for the
total of resources allocated or consumed (Amazon
AWS, 2016). brings the services offered at the
infrastructure layer, in these services we can include
various computing resources such as servers,
routers, storage systems, among others. Responsible
for providing all the necessary infrastructure for the
two previously mentioned structures SaaS and PaaS.
IaaS is based on computing resource virtualization
techniques. Looking from the economy side, haven't
to buy new servers or even network equipment for
service expansion, because everything that is need is
included in the cloud.
4.3 Urban Areas
The process of urbanization in Brazil began in the
twentieth century, and the industrialization led the
population to go from the countryside to the city
(rural exodus).
Urbanization is an increase of the urban
population compared to rural. The economy in
Brazil went from agrarian-exporter to urban-
industrial, and the understanding of the urban is still
based on the idea of capitalist and industrial society.
Currently, more than 80% of the Brazilian
population lives in urban areas.
Disorganized urbanization causes a series of
social and environmental problems.
The solution to environmental and social
problems is what motivates today the study of the
growth and densification of urbanization.
4.4 Google Earth Engine and the
Explorer Platform
Google Earth Engine is a cloud computing platform
for developing and hosting web applications on
Google's infrastructure that enables, among other
applications, automatic mapping and classification
of land cover.
It was initially released as a beta release in April
2008 but only in 2017 there was a massive publicity
and incentive to use by the company (in Brazil).
Pesquisando Google Earth Engine no Google
acadêmico podemos achar 20 resultados de artigos
ou publicações no período de 2008 a 2016 e 26 no
período de 2016 a 2017.
Google Engine is a technology in the Platform as
a Service (PaaS) model, which virtualizes
applications on multiple servers, providing
hardware, connectivity, operating system, and
software services. It can be used for free to a certain
level of resource consumption with numerous tools
ready and adapted for users without programming
knowledge. Additional fees may be charged for the
consumption of resources when the user has
technical knowledge to implement more complex
analyzes.
The rapidity in the classification and generation
of products is one of the most important positive
points of the analysis. The tool is very interactive
and easy to handle, even by users with little
experience.
It uses cloud-processing technology, which
enables the use and manipulation of large volumes
of georeferenced data. Its system is designed to
enable scientific analysis and visualization of
Delimitation of Urban Areas with Use of the Plataform Google Engine Explorer
257

geospatial data sets. The data catalog has an
immense volume of data and a wide range of
popular datasets, such as the world's largest
collection of Landsat scenes, 25 years of high-
resolution images, and other Landsat images since
1972, has variety of data types, bands, projection, bit
depth, spatial resolution, temporal. It has data from
the Sentinel, Images Moderate Resolution Imaging
Spectroradiometer (MODIS), night-time imagery-
Defense Meteorological Satellite Program's
Operational Linescan System (DMSP-OLS), digital
elevation models, slope data, surface temperature,
climate, atmospheric data beyond of global daily
satellite feeds.
The user can add and store their own data and
collections. Upload your own image with Maps
Engine, in the original projection, with all the bands
and metadata. In addition to being able to save your
data, collected points, classifications and these can
be used, manipulated and opened in traditional
programs.
The platform can be used in two ways, in the
"Explorer" mode a programming interface that was
used in this work, also contains the "Code Editor"
mode used by users with programming knowledge.
The platform has already been successfully used
for various purposes. Between them:
The European Commission's Joint Research
Center (JRC) has used the Earth Engine to develop
high-resolution maps of global surface water
occurrence, change, seasonality, recurrence and
transitions.
Collect Earth, developed by the Food and
Agriculture Organization of the United Nations
(FAO), is a free, open-source, easy-to-use tool using
Google Earth and Google Earth Engine to view and
analyze land lots to deforestation and other forms of
land use change.
Global Forest Watch, an initiative of the World
Resources Institute, is a dynamic online forest
monitoring system designed to enable better
management and conservation. Global Forest Watch
uses Earth Engine to measure and visualize changes
in the world's forests.
A team led by Matt Hansen of the University of
Maryland used the Earth Engine to research more
than a decade of global warming extension, loss, and
gains. This area is 128.8 million square kilometers,
equivalent to 143 billion pixels of Landsat data in a
spatial resolution of thirty meters.
5 METHODOLOGY
The proposed methodology starts with the choice of
analysis scales and inputs. The CART classifier for
the mesoscale Rio de Janeiro was initially evaluated.
Simplified legends (urban and non-urban) and
greater detailing (different types of coverage of
urban areas and levels of urban intensity) were
tested. The main input was the Landsat TOA (Top of
atmosphere) mosaic. The potential, time of
classification, and results were evaluated.
Using the Google Earth Engine platform in
"Explorer" mode for computer laymen and selecting
images from different years in the platform database,
the classifier was chosen. In this case the CART-
Classification and Regression Trees (The decision
tree method is a supervised learning approach, that
is, it comprises the abstraction of a knowledge
model from the data presented in the form of ordered
pairs (desired input and output) [Goldschmidt e
Passos 2005]. n this method, the production of the
results presents simplicity and readability for its
interpretation, fact that, according to Oliveira
(2005), has become one of the main advantages of
its use. With regard to the CART algorithm, one of
its main characteristics is the research capacity and
relations between the data, involving the
construction and simplification phases of the
decision tree, choosing the best variable for dividing
the data into two nodes, where the procedure is
applied recursively to the data in each of the child-
nodes and so on [Hand et al 2001].) (a classification
algorithm that has one of its main characteristics the
research capacity and relations between the data,
involving the phases of construction and
simplification of the decision tree, choosing the best
variable for dividing the data into two nodes, where
the division procedure is applied recursively to the
data in each one of the nodes (classification is a
process that finds common properties between a set
of records belonging to a database and classifies
them into different classes according to a model)
through the indication of samples pixel-by-pixel of
the different types of subtitles that were used.
Five tests were performed. In the first test we
tried to define the potential of delimitation of urban
areas considering only two classes (urban and water)
and others. in the second test the number of classes
was increased. were selected for vegetation, soil and
sand. In this case, the results were more promising.
In the third test, the classification for the
delimitation of urban areas on a regional scale for
the southeastern region of Brazil was enhanced. In
this case the Nigth time ligth file was used as support.
GISTAM 2018 - 4th International Conference on Geographical Information Systems Theory, Applications and Management
258
Version 4 of the DMSP-OLS Nighttime Lights
Time Series consists of cloud-free composites made
using all the available archived DMSP-OLS smooth
resolution data for calendar years. In cases where
two satellites were collecting data - two composites
were produced. The products are 30 arc second
grids, spanning -180 to 180 degrees longitude and -
65 to 75 degrees latitude.
In the final tests (4 and 5) classifications were
made to delimit different intensity levels of urban
areas. This evaluation considered the scale of detail
(minutemen of Rio de Janeiro10 and carried out for
the years 2000 and 2010, aiming at the use in the
monitoring.
After the generated products was applied Kappa
(Cohen, 1960) Gong & Howarth (1990) used the
Kappa (K) index as an important precision measure
to be associated with the error matrix, since it
represents it entirely, that is, considering all
elements of the matrix and not only those that are on
the main diagonal, as it happens with the Global
Accuracy index. The index using an image of
Google Earth itself and 200 random points to make
the conference of the classified areas. The Kappa
index is a pointer to show reliability of the
measurement procedures used which is a key issue
in any research study. It is a measure of agreement
that measures the degree of conformity beyond what
would be expected by chance alone. And with all the
finished products, the results of the images,
classifications (fig.1 and 2), tables 1 and 2, and
evaluating the Kappa index that was calculated as
shown by the equation below can be analyzed.
k=(∑x_ij-∑x_(i. )∑x_j)/(1-∑x_i⋅X_j ) (1)
Equation 1: Kappa equation.
Table 1: Kappa value and index of points.
Kappa value
Class
< 0.20
Poor
0.21 - 0.40
Low
0.41 - 0.60
Moderate
0.61 - 0.80
Good
0.81 - 1.00
Very good
Font: Adapted from Galparsoro and Fernandez (2001).
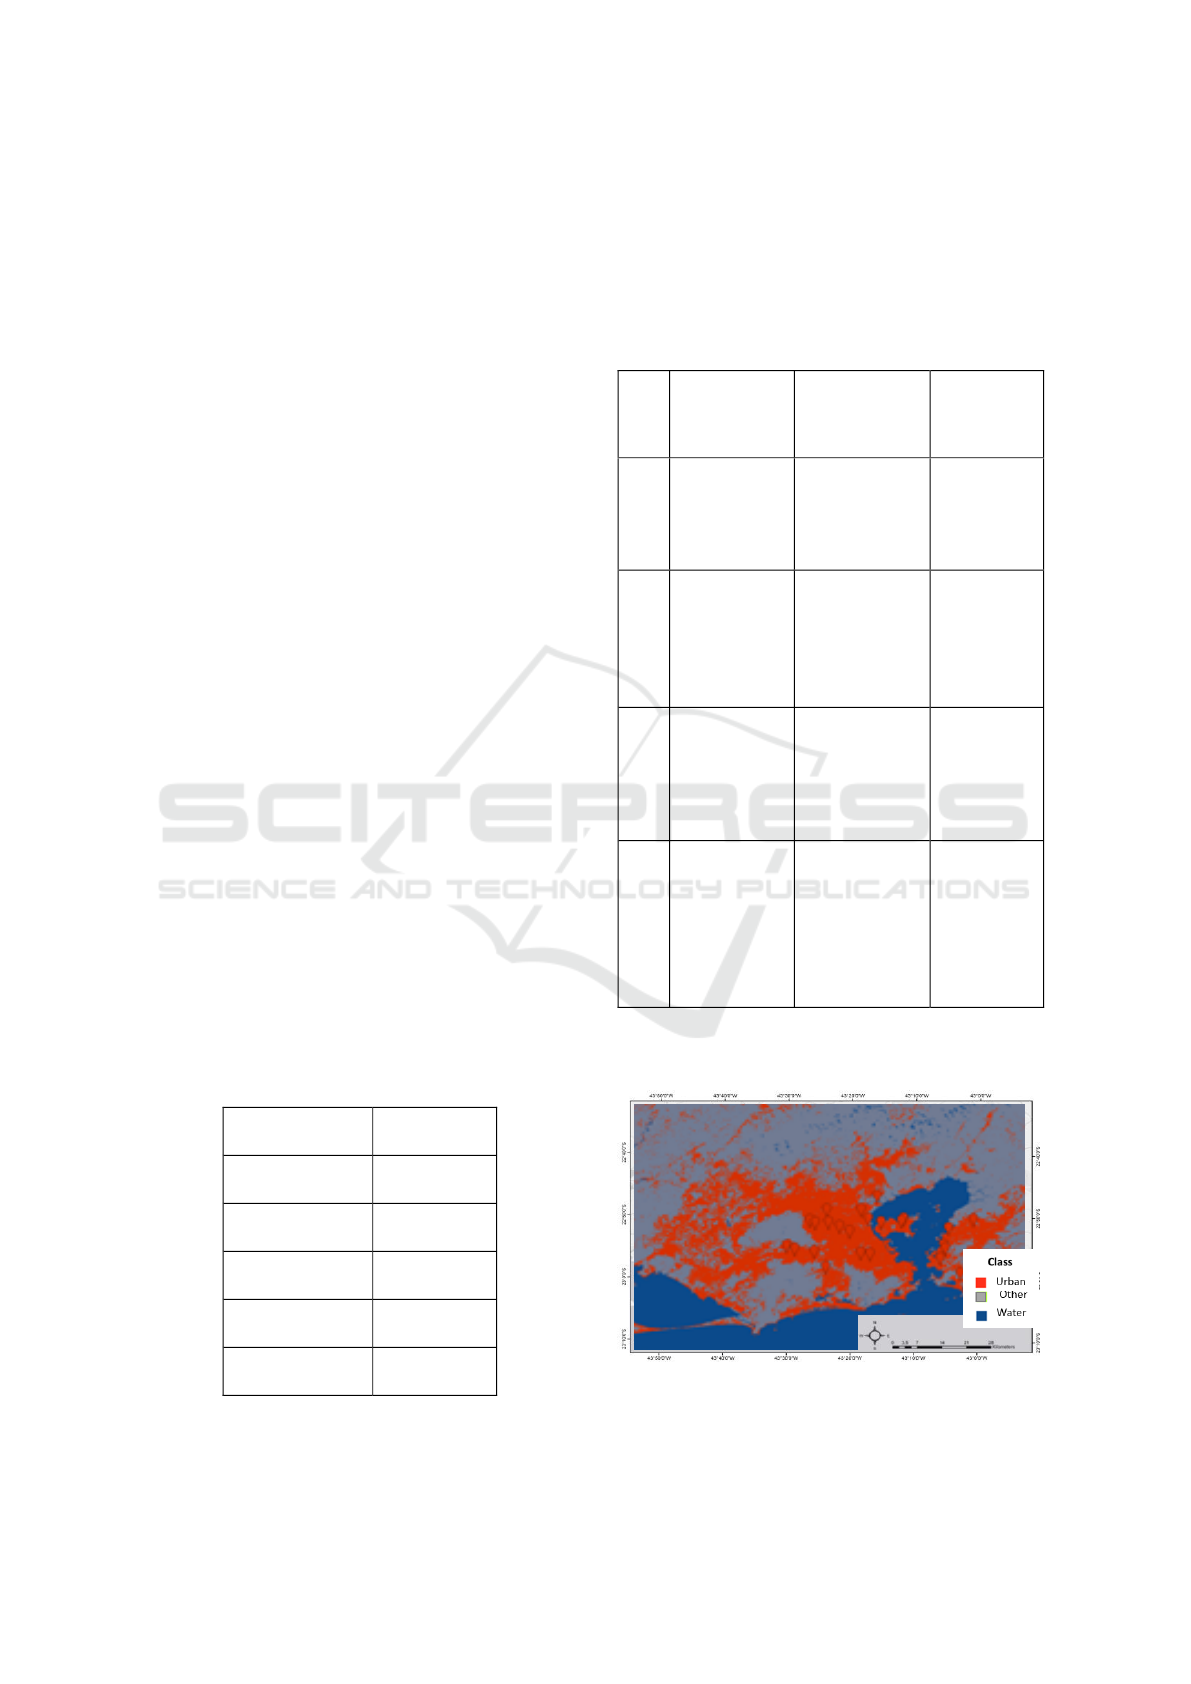
6 RESULTS AND CONCLUSIONS
6.1 Results
The table 2 shows the results to the tests 1 -4.
Table 2: Results to the tests 1 and 2.
Tests
Image/mosaic/
area and scale
Class and
number
samples
Results
(1)
LANDSAT 8
Mosaic year
(2000) - Rio de
Janeiro city
1:100000
Urban (83),
Water (71),
Other (31)
Few class the
result
overestimate
the urban
areas
(2)
LANDSAT 8
Mosaic year
(2000) - Rio de
Janeiro city
1:100000
Urban (83),
Water (71),
Vegetation (66)
Soil (64)
Beach sand(22)
Other (10)
Delimits
urban areas,
water bodies,
vegetation
with good
results.
(3)
LANDSAT 8
Mosaic year
(2000) + Night
time Lights –
regional scale
1:1000000
Urban(83),
Water(71),
Vegetation (66),
Soil (64),
Beach sand(22)
Other (10)
Better
delimitation
of the urban
areas.
(4)
LANDSAT 8
Mosaic years
(2000, 2010) -
Rio de Janeiro
city 1:100000
Intense Urban
(20),
Average urban
(22),
Rarefied urban
(24),
Vegetation (08),
Water (18)
The result
delimits well
diffetents
urban levels.
It is possible to observe through the figures 1 and 2
of the generated classifications the following results.
Figure 1: Simplified classification (test 1).
Delimitation of Urban Areas with Use of the Plataform Google Engine Explorer
259
Figure 2: Detailed classification (test 2).
Figure 3: Nigth time ligth classification - Image index
Kappa de 0,85 (test 3).
Figure 4: Image and classification of the Rio de Janeiro
city in 2000 (test 4/5).
6.2 Conclusions
About the Google Earth Engine Explorer Platform
was observed high speed in the processing of the
samples and in the generation of the result (mapping
of the cover); allows to open different tabs for the
generation of differentiated classifications; the
number of classes and samples very little affect the
Figure 5: Image and classification of the Rio de Janeiro
city in 2010 (test 4/5).
processing speed which is very high; changing the
resolution to the classification changes the result and
must consider the scale of the mapping; and the
classifier proved efficient for the delimitation of
urban areas.
On the mapping one can conclude that its use has
great potential for Geography with excellent result
of the Kappa index; it has the possibility of
applications aiming the monitoring of the urban
expansion; and the possibility of geographical
analysis at different scales.
It is necessary to evaluate the other classifiers as
well as to compare tests in other scales and
geographic areas.
Validation must consider different methods and
validate other images made available on the Google
Earth Engine Explorer platform.
REFERENCES
Cohen, J. (1960) A coefficient of agreement for nominal
scales. Educational and Psychological Measurement
20, 37-46.
Galparsoro, L.; fernández, S.P. Medidas de concordância:
el índice Kappa. 2010.
Goldschimidt, R e passos, E. Data mining: Um guia
prático. Rio de Janeiro: Campus, 2005.
Gong, P.; P. J. Howart, 1989. A modified probabilistic
Relaxation approach for land-cover classification.
IGARSS 8921th Canadian Symposium on Remote
Sensing, Vancouver, British Columbia. PP.1621-1624.
Oliveira, R. (2006) “Uso de Data Mining para obter perfis
de clientes com maior lucratividade”, Monografia
(Especialização em Gerenciamento em Banco de
Dados), Universidade do Extremo Sul Catarinense,
Criciúma.
R. Buyya (Ed.), High Performance Cluster Computing:
Architectures and Systems, vol. 1, Prentice Hall,
Upper Saddle River, USA, 1999.
Sousa, F., Moreira, L., Machado, J. Computação em
Nuvem: Conceitos, Tecnologias, Aplicações e
GISTAM 2018 - 4th International Conference on Geographical Information Systems Theory, Applications and Management
260

Desafios. In: Antônio Costa de Oliveira;Raimundo
Santos Moura;Francisco Vieira de Souza. (Org.). III
Escola Regional de Computação Ceará, Maranhão e
Piauí (ERCEMAPI). 1 ed. Teresina: SBC, 2009, v. 1,
p. 150-175.
Delimitation of Urban Areas with Use of the Plataform Google Engine Explorer
261
