
On the Adoption of Big Data Analytics: Interdependencies of
Contextual Factors
Anke Schüll and Natalia Maslan
Department of Business Information Systems, University of Siegen, Kohlbettstr. 15, Siegen, Germany
Keywords: Big Data Analytics, BDA Adoption, TOE Framework, Dynamic Capabilities Theory.
Abstract: Even though the number of papers on the adoption of big data analytics (BDA) has increased, the literature
still only scratches the surface in terms of understanding the influential factors of BDA adoption. To cope
with the complexity of these factors, this paper focuses on the influence of some of the most important factors
regarding BDA and their interrelations. We followed the technology, organization, and environment
framework (TOE framework), which is frequently used to explain the process of technology adoption, to
examine the context of the decision-making process and combined it with insights from dynamic capability
theory. This paper contributes to BDA research by extending the TOE framework towards a dynamic
capability view. It assists in the decision-making process regarding the development of BDA capabilities by
determining the most influential factors and their side effects, thereby helping to prioritize these factors and
to encourage investments accordingly.
1 INTRODUCTION
Big data refers to large sets of structured, semi-
structured or unstructured data, which are obtained
from different unrelated resources; examples include
sensor data and content that is extracted from social
media (Malaka and Brown, 2015). As the processing
of big data is beyond the abilities of conventional
software tools (Manyika et al., 2011), decisions on
investments in big-data-related technology must be
faced. However, big data are not without benefit: As
an asset, big data can “improve competitiveness,
innovation and efficiencies in organizations”
(Braganza et al, 2017).
The term big data analytics (BDA) covers
advanced analytical techniques and technologies that
operate on big data to obtain enhanced insights and
improve the decision-making process (Malaka and
Brown, 2015). Chen et al. (2016) understand BDA as
a “unique information processing capability that
brings competitive advantage to organizations” and is
expected to improve performance (Kwon et al.,
2014).
Deeply rooted in business intelligence (BI), BDA
“reawakens” an interest in mathematics, statistics and
quantitative analysis (Braganza et al., 2017), but adds
some specific requirements. Because the objective of
BDA is to answer highly specific questions, its
solutions must be tailored to this context, which
requires sound methodological skills (Debortoli et al.,
2014).
Competencies on BI and BDA can be categorized
into three waves, which are characterized by DBMS-
based, structured content (1
st
wave), web-based, user
generated, unstructured content (2
nd
wave), and
mobile- and sensor-based content (3
rd
wave) (Chen et
al., 2012). BDA capabilities can be understood as
dynamic capabilities, which require a “delicate
mixture of management, talent and technology”
(Akter et al., 2016). As these capabilities are tailored
to suit a highly specialized question (Debortoli et al.
2014), they are context-specific (Chen et al., 2016).
BDA adoption requires investments in costly
technology, which is rapidly changing and offering
new opportunities for information processing at
increasing speeds. It requires investments in the
development of analytical skills that are pinpointed to
a context-specific task, and intensified data collection
and storage, which are connected with issues
regarding data quality, IT security, and privacy
concerns. These factors are closely entangled and
influence decisions on BDA adoption in different
ways. The goal of this paper is to shed light on their
influence on BDA adoption, to inform the decision-
Schüll, A. and Maslan, N.
On the Adoption of Big Data Analytics: Interdependencies of Contextual Factors.
DOI: 10.5220/0006759904250431
In Proceedings of the 20th International Conference on Enterprise Information Systems (ICEIS 2018), pages 425-431
ISBN: 978-989-758-298-1
Copyright
c
2019 by SCITEPRESS – Science and Technology Publications, Lda. All rights reserved
425

making process and to assist in prioritizing these
factors and in encouraging investments accordingly.
2 THEORETICAL
BACKGROUND
2.1 TOE Framework
To understand the contextual factors regarding BDA
adoption, we base our work on the TOE framework.
This framework identifies factors that are related to
the adoption of technological innovations in the
technological, organizational, and environmental
contexts (Oliveira and Martins, 2011). Building upon
diffusion of innovation theory (DOI), this framework
is well accepted and frequently used to explain
specific aspects of the adoption of BDA (Table 1).
Table 1: Some recent studies on BDA adoption based on
the TOE framework (ordered by year and name).
Reference Focus Research
Metho
d
(Debortoli
et al., 2014)
Competencies and
skills in BI and
BDAs
Text mining of
job
advertisements
(Agrawal,
2015)
BDA adoption in
firms from China
and India
Data collection
(106
or
g
anizations
)
(Malaka
and Brown,
2015)
Challenges of BDA
adoption
Interpretive
study, single-
organization
case stud
y
(Nam et al.,
2015)
Influences of
perceived benefit,
financial readiness,
IS competence, and
industrial pressure
on BDA adoption
Online
questionnaire
survey
(Chen et
al., 2016)
Key antecedents of
organizational-
level BDA usage
and the effect on
value creation
Survey data
(161 U.S.-based
companies)
Domain: supply
chain
management
(Salleh and
Janczewski,
2016)
Security and
privacy issues
related to BDA
ado
p
tion
Anonymous
online
questionnaire
surve
y
Chen et al. (2016) identified two limitations of the
TOE framework. The first limitation is the
assumption of the model, that contextual factors
directly affect the decision to adopt a technological
innovation. They argue that the idealization of the
decision-making process as a fully rational process
cannot hold true in practice. The second limitation is
that contextual factors can affect this decision in ways
that are not covered by the TOE framework.
Therefore, combining the TOE framework with one
or more theoretical models is recommended (Low et
al., 2011).
2.2 Dynamic Capability Theory
The TOE framework provides an overview of
contextual factors of BDA adoption, but it’s not the
adoption of BDA as such, that provides competitive
advantage. As part of the dynamic capabilities of a
firm, BDA capabilities enhance the potential to
improve the performance of a firm and to adapt to the
challenges of turbulent environments. Therefore, we
complement the TOE framework with the dynamic
capability theory (DCT). DTC offers additional
explanations for gaining competitive advantage out of
the adoption of BDA, as several recent publications
have shown (Table 2).
Table 2: Theories related to BDA adoption in some recent
publications (ordered by year and name).
Reference Theor
y
(Esteves and
Curto, 2013
)
Decomposed Theory of Planned
Behavio
r
(Debortoli et al.,
2014)
Resource-Based View
(Akter et al.,
2016)
Resource-Based View, IT
Capability Theories, Concept of
Sociomaterialit
y
(Chen et al.,
2016)
Dynamic Capability Theory
(Gupta and
Geor
g
e, 2016
)
Resource-Based View,
Knowled
g
e-Based View
(Prescott, 2016) Resource-Based View, Dynamic
Ca
p
abilit
y
Theor
y
(Braganza et al.,
2017)
Resource-Based View,
Knowledge-Based View,
D
y
namic Ca
p
abilit
y
Theor
y
(Côrte-Real et
al., 2017)
Resource-Based View,
Knowledge-Based View,
Dynamic Capability Theory
(Gunasekaran et
al., 2017
)
Resource-Based View
(Mikalef et al.,
2017
)
Resource-Based View; Dynamic
Ca
p
abilit
y
Theor
y
As an extension of the resource-based view (RBV),
the DCT is closely connected to RBV. Resources
refer to the tangible, intangible and human resources
of a firm that, bundled together, influence the
performance outcomes. Capabilities can be
understood as subsets of these resources that are non-
transferable, have a direct or indirect impact on the
ICEIS 2018 - 20th International Conference on Enterprise Information Systems
426
performance of a firm, and are influenced by
environmental conditions (Gunasekaran et al., 2017).
Dynamic capabilities enable a firm to adapt to
changing requirements (Mikalef et al., 2017). They
refer to the ability to configure and reconfigure the
resources of a firm to maintain competitive advantage
in turbulent environments (Prescott, 2016; Côrte-Real
et al., 2017). El Sawy and Pavlou (2008) identified
four dimensions: sensing the environment, learning,
integrating knowledge and coordinating activities.
Almost all of these dimensions can be leveraged by
BDA.
3 RESEARCH MODEL AND
CONSTRUCT MEASURES
Informed by recent literature, we have identified
several contextual factors that are crucial for the
adoption of BDA. Information on how these factors
influence the adoption of BDA and how they are
interrelated can assist in prioritizing the different
aspects of BDA investments. As it is impossible to
cover all contextual factors that are relevant for the
decision-making process, we adapted contextual
factors according to previous research.
The technological context covers relative
advantage, complexity and compatibility. It refers to
relevant internal and external technologies (Borgman
et al., 2014). The integration of internal and external
data and prior IT experiences with BDA-related
technologies was considered the most relevant
technological factor. Thus, we posit that levels of
experience with data usage from external sources,
internal sources and big-data-related technology each
have a significant positive effect on the adoption of
BDA (H1-H3). Security and privacy issues can be
obstacles to the adoption of BDA technologies;
therefore, we postulate that experiences with security
mechanisms have a significant positive effect on
BDA adoption (H4).
The organizational context refers to descriptive
measures of the organization regarding scope, size,
and managerial structure (Oliveira and Martins,
2011). Successful deployment of BDA is almost
impossible without the appropriate analytical skills;
therefore, we posit that BDA skills have a significant
positive effect on the adoption of BDA (H5). In the
telecom industry, Bughin (2016) found evidence that
a good part of the returns could be explained by the
capabilities to effectively manage big data projects;
thus, we postulate that management support has a
significant positive effect on BDA adoption (H6).
As dynamic capabilities enable a firm to evolve
according to the requirements of a changing
environment, market pressure (H7) is expected to
have a positive impact on BDA adoption.
Competitive pressure is an important external driver
for the adoption of innovations (Agrawal, 2015);
therefore, we postulate that competitive pressure to
use BDA has a significant positive effect on BDA
adoption (H8). With these hypotheses, we intend to
confirm the results of previous research and extend
the previous research to an analysis of the factors’
interrelated effects. As gaining competitive
advantage is at the core of developing dynamic
capabilities, we postulate that BDA adoption will
have a positive effect on market performance (H9).
Where possible, constructs were adapted from
existing research.
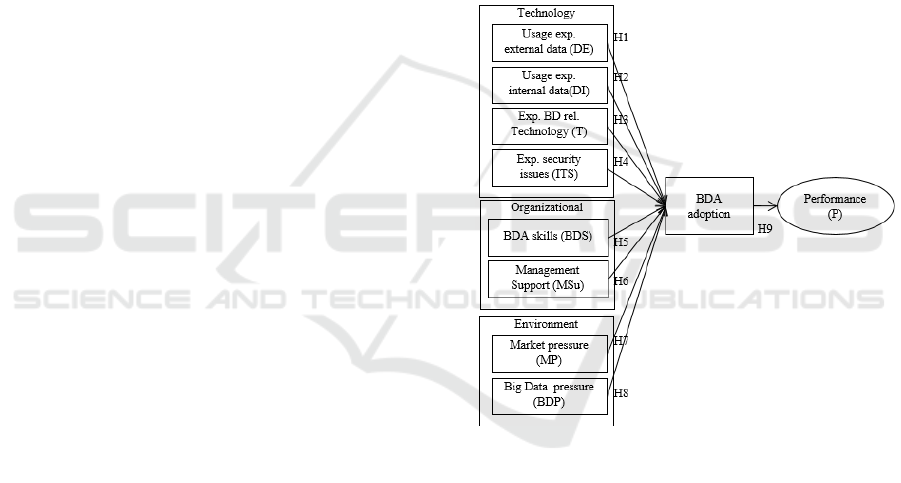
Figure 1: Research model.
The research model covers technological factors that
are relevant for assessing experiences with data from
external or internal sources and with big data
technology. We follow the argument of Kwon et al.
(2014) that “expanded IT capability in data
management and utilization is expected to become a
virtuous force in furthering adoption of new data-
related IT capability” (e.g., BDA). As privacy and
security issues can affect the (perceived) complexity
(Borgman et al. 2014), these were included,
according to Salleh and Janczewski (2016).
Big data capabilities cover tangible resources
(e.g., technology, data and financial resources),
human skills (e.g., technical skills and managerial
skills) and intangible resources (e.g., organizational
learning and data-drive culture) (Mikalef et al. 2017).
On the Adoption of Big Data Analytics: Interdependencies of Contextual Factors
427

Table 3: Technology Context: Constructs.
Usage experience with data from external sources
(Kwon et al., 2014):
To predict demand;
To facilitate understanding of market conditions;
To facilitate understanding of customer demands;
Quality and reliability evaluation of external (data)
(N);
Usage of social media data (N).
Usage experience with data from internal sources
(Gupta and George, 2016):
Integration of data from multiple internal data sources
into a data warehouse;
Access to very large, unstructured, or fast-moving
data for analysis;
Analysis of Cookies, Logfiles, App-data (N);
Anal
y
sis of sensor data
(
N
)
;
Experience with big-data-related technology (Gupta
and George, 2016):
Parallel computing approaches;
Different visualization tools;
Cloud-based services for data processing and
analysis;
Open-source software for big data analytics;
New forms of data storage;
Near-real-time or real-time analysis (N);
Event-driven decision automation
(
N
)
;
Privacy and security (Salleh and Janczewski, 2016):
Security requirements for BDA are compatible with
existing information security infrastructure.
Information security mechanisms for BDA are
com
p
atible with existin
g
s
y
stems
(
A
)
;
(A) adapted, (N) new
Debortoli et al. (2014) observed that a big data project
is often more comparable to a research project, as it
requires better methodological skills than traditional
BI and requires some learning intensity (Gupta and
George, 2016). As capabilities cannot provide
competitive advantage by themselves, management
plays a crucial role in capacity building, by
structuring and orchestrating resources (Gunasekaran
et al., 2017).
Table 4: Organizational Context: Constructs.
BDA skills: (Gupta and George, 2016)
Providing BDA training for employees;
Hiring new employees with BDA skills;
Using external experts to bring in BDA expertise (N);
Suitable education or work experience of BDA staff
(
A
)
.
Management Support: (Gupta and George, 2016)
Having a good sense of where to apply BDA (A);
Having clear expectations related to the outcomes and
b
enefits of BDA (A).
(A) adapted, (N) new
Côrte-Real et al. (2017) used the construct “market
pressure” and two other items to measure
organizational agility. These items are market-driven;
thus, they are environmental contextual factors. As
the readiness of competitors to deploy BDA is
expected to influence BDA adoption (Chen et al.,
2016), Big Data pressure is included in the
environmental context using constructs that were
adapted from Agrawal (2015).
Table 5: Environmental Context: Constructs.
Market pressure: (Côrte-Real et al., 2017)
Necessity of responding to changes in consumer
demand (A);
Necessity of reacting to new product or service
launches by competitors;
Necessity of adopting new technologies to produce
better, faster, cheaper products and services (due to
market demands);
Big Data pressure (Agrawal, 2015):
Perceived competition intensity to implement BDA
(A);
Risk of competitive disadvantage if BDA is not
ado
p
ted.
(
A
)
(A) adapted, (N) new
Because the dynamic capabilities are orchestrated to
gain competitive advantage, measurement of the
market performance has been included in the model.
Since this advantage will not materialize
immediately, the time since the adoption of BDA was
required as additional information (Gupta and
George, 2016).
Table 6: Market Performance: Construct.
Market Performance (Gupta and George, 2016):
Time needed to introduce new products or services into
the market compared to competitors;
Success rate of new product or services launches
compared to competitors;
Market share com
p
ared to com
p
etitors
(
A
)
.
(A) adapted, (N) new
4 DATA ANALYSIS AND
RESULTS
To test our hypotheses, we conducted an anonymous
online survey, addressing the top management of
German companies. The addresses were acquired
using the Hoppenstedt database. 138 German
companies took part in this survey, which had been
pre-tested in a pilot study. After data sets with
missing values on BDA usage were filtered out, 46
data sets from organizations of different sizes
ICEIS 2018 - 20th International Conference on Enterprise Information Systems
428

(turnover from 0-1 million Euros up to 1000 million
Euros per year) remained for further analysis.
According to their answers, 30% belong to the 1
st
wave of BI and BDA competencies, 46% to the 2
nd
wave, and 24% to the 3
rd
.
1-5 Likert scales were used to measure DI, DE,
ITS, BDS, MSu, MP, BDP and P. T is a measure, that
covers six widespread big data technologies, which
were adopted from Gupta and George (2016). For our
analysis, we used IBM SPSS Statistics 25.
Cronbach’s alpha was used to assess the reliability
of scales. A confirmatory factor analysis was
conducted for deleting items that did not contribute
strongly to the scales. All items of each final scale
loaded on a single factor. With the exception of ITS
and DI, all cronbach’s alpha coefficients are above
0.80 which are excellent values. DI with 0.707 is a
commonly acceptable value (Hair et al. 2006). Hair et
al. (2006) argued that Cronbach’s alpha values may
decrease to .60 and still be acceptable, especially in
exploratory studies. Thus, we accept the cronbach’s
alpha of 0.652 for ITS. The Kaiser-Meyer-Olkin
(KMO) Measure of Sampling Adequacy meets the
minimum criteria of 0.5 and Bartlett's test of
sphericity is significant for each construct (Field
2013). Table 7 lists the Cronbach’s Alpha scores,
KMO values and Barlett’s test significance levels for
DI, DE, ITS, BDS, MSu, BDP, MP and P.
Table 7: Cronbach’s Alpha scores, KMO values and
Barlett’s test significance levels.
Construct Cronbach’s
Alpha
KMO Barlett’s test
DI .707 .500 Si
g
n
(
0.001
)
DE .884 .846 Si
g
n
(
0.000
)
ITS .652 .500 Si
g
n
(
0.004
)
BDS .900 .822 Sign (0.000)
MSu .951 .500 Sign (0.000)
BDP .891 .500 Sign (0.000)
MP .816 .687 Si
g
n
(
0.000
)
P .833 .692 Si
g
n
(
0.000
)
BDA adoption was measured as a dichotomous
variable, which resulted in two groups: BDA adopters
and BDA non-adopters. Therefore, a t-test analysis
(independent sample test) was conducted to test
hypotheses H1-H9 (Figure 1). The t-test assesses
whether the means of two groups are significantly
different from each other.
There is sufficient evidence to suggest that the
values of DE, DI, T, ITS, BDS, MSu, and BDP are
higher in organizations that adopt BDA than in those
that do not (Table 8 and 9). Thus, H1-H6 and H8 are
supported, but H7 is not supported.
Table 8: Group statistics.
BDA Mean Std. Dev Std. Error Mean
DE no 2.8389 .93580 .19102
y
es 3.6147 1.26142 .30594
DI no 2.1818 1.17053 .24956
yes 3.2941 1.43678 .34847
T no 2.3750 1.31256 .26793
y
es 4.3125 1.81544 .45386
ITS no 2.7105 1.03166 .23668
y
es 3.6563 .87023 .21756
BDS no 2.1146 1.26901 .25904
yes 3.7396 .96555 .24139
MSu no 2.5455 1.46311 .31194
y
es 3.5938 .98689 .24672
MP no 3.5797 1.03581 .21598
yes 3.6979 .98924 .24731
BDP no 2.5750 1.19511 .26723
yes 3.9688 1.10255 .27564
P no 2.9091 1.23091 .26243
y
es 3.2083 1.25831 .31458
The hypothesis that BDA adoption has a positive
effect on market performance (H9) could not be
supported either.
Table 9: Independent Sample Test.
Levene's Test fo
r
E
q
ualit
y
of Variances
t-test for Equality o
f
Means
F Si
g
. t Si
g
.
(
2-tailed
)
DE EVA 1.740 .195 -2.263 .029
EVNA -2.151 .040
DI EVA .641 .428 -2.665 .011
EVNA -2.595 .014
T EVA 3.491 .069 -3.921 .000
EVNA -3.676 .001
ITS EVA .324 .573 -2.898 .007
EVNA -2.942 .006
BDSEVA 3.236 .080 -4.345 .000
EVNA -4.589 .000
MSuEVA 4.252 .046 -2.480 .018
EVNA -2.636 .012
MP EVA .011 .916 -.357 .723
EVNA -.360 .721
BDPEVA .687 .413 -3.597 .001
EVNA -3.630 .001
P EVA .103 .750 -.733 .468
EVNA -.730 .470
(EVA) Equal variances assumed, (EVNA) Equal variances
not assumed
It is a remarkable result that technology is not among
the most important internal factors that influence
BDA adoption, but BDA skills and usage of internal
data are. Among the environmental factors,
competitor pressure has a stronger impact on BDA
adoption than market pressure.
On the Adoption of Big Data Analytics: Interdependencies of Contextual Factors
429

Table 10 represents the correlations of the constructs.
There are significant relationships between MSu and
DE, DI, BDS, BDP and ITS, with p (2-tailed) < 0.01.
The strongest significant relationships are those
between BDS and MSu (r = 0.747), DI and MSu (r =
0.673) and BDP and MSu (r = 0.597), with p (2-
tailed) < 0.01. It is interesting to note that BDP is
strongly and significantly related to DI (r = 0.750) and
to BDS (r = 0.714), and DI is also strongly and
significantly related to BDS (r = 0.657), with p (2-
tailed) < 0.01.
The correlations indicate that the perceived
competition intensity to implement BDA and the risk
of competitive disadvantage are highly correlated
with learning activities regarding BDA skills and
usage of internal data.
Table 10: Pearson Correlations.
DE DI BDS MP BDP ITS MSu
T .457
**
.425
**
.560
**
.049 .435
**
.410
*
.273
DE .617
**
.589
**
.223 .549
**
.369
*
.415
**
DI .657
**
.377
*
.750
**
.289 .673
**
BDS .198 .714
**
.510
**
.747
**
MP .351
*
.120 .119
BDP .507
**
.597
**
ITS .446
**
**Correlation is significant at the 0.01 level (2-tailed)
*Correlation is significant at the 0.05 level (2-tailed)
Competitive pressure has a stronger effect on BDA
adoption than market pressure and has a strong
correlation to management support. That competitive
pressure to use BDA is positively associated with
management support is further confirmation of the
results of Chen et al. (2016).
Correlations of MSu with BDS, DI, ITS, DE and
T indicate strong differences, the strongest being the
one with BDS, followed by the correlation with
internal data usage. Taking the three waves of BI and
BDA competencies into consideration, it is
reasonable that internal data usage has a higher
correlation with MSu than external data usage. That
there is no strong correlation between technology and
MSu indicates that technology is not fueling the
expectations that are related to BDA in the same way
as BDA skills or data usage.
Developing new knowledge and skills is
fundamental for exploiting the potential of BDA,
which results in improved operational capabilities (El
Sawy and Pavlou 2008). Gupta and George (2016)
emphasize that the development of firm-specific
BDA capabilities will not be rewarding if “an
organization lacks learning intensity”. They
identified the need to adopt a culture where
“decisions are made based on people’s opinions.” The
strong correlation between BDA skills and
management supports can be explained by this kind
of a culture: having a clear expectation on where to
apply BDA and what outcomes and benefits to expect
could indicate that management is well advised.
5 CONCLUSIONS
The main focus of this work was on highlighting the
entanglement of the contextual factors. Enriching the
TOE framework with insights from dynamic
capabilities provided additional information on how
the BDA capabilities are orchestrated according to a
specific task to be accomplished by BDA.
As the sample size is too small to provide strong
evidence, most of this paper is argumentative. The
results of the survey are used as indications; however,
a more extensive survey is required to confirm the
results. Nonetheless, as the argument is in line with
previous research, it contributes to the discussion on
interrelated effects regarding the contextual factors of
BDA.
We identified BDA skills and internal data usage
as the most influential factors, both of which have a
strong correlation to management support. This gives
skill development high priority in regard to
channeling BDA investments.
That perceived competition intensity to
implement BDA and the risk of competitive
disadvantage (if BDA is not adopted) have a strong
effect on BDA adoption, does not come as a surprise.
However, we did expect the market pressure to have
some influence on BDA adoption. As the lack of
influence was rather unexpected, further research is
necessary to confirm the results or to adopt constructs
and variables.
We could not find evidence for a link between
BDA adoption and firm performance, but we expect
that the time since adoption would need to be taken
into consideration. Due to missing values, we had to
omit the time since BDA adoption from our analysis.
As a positive influence on market performance would
be a sustained effect, one explanation for this could
be the recency of BDA investments. Assessing this
relationship over an extended period of time could be
an interesting direction for further research.
The lack of a significant effect is in line with the
results of Chae, Koh et al. (2014), who could not
confirm a relationship between IT capabilities and
firm performance. We follow their suggestion to
further investigate constructs and variables that take
into consideration that the role of IT has changed over
time (Chae et al. 2014).
ICEIS 2018 - 20th International Conference on Enterprise Information Systems
430

REFERENCES
Agrawal, K., 2015. Investigating the determinants of Big
Data Analytics (BDA) adoption in Asian emerging
economies. In: AMCIS.
Akter, S., Wamba, S. F., Gunasekaran, A., Dubey, R.,
Childe, S. J., 2016. How to improve firm performance
using big data analytics capability and business strategy
alignment? In: International Journal of Production
Economics 182, S. 113–131.
Borgman, H. P., Bouchaib, B., Heier, H., Schewski, F.,
2014. Cloudrise: Exploring Cloud Computing
Adoption and Governance With the TOE Framework.
2014 47th Hawaii International Conference on System
Sciences (HICSS). Waikoloa, HI, 06.01.2014 -
09.01.2014: IEEE.
Braganza, A., Brooks, L., Nepelski, D., Ali, M., Moro, R.,
2017. Resource management in big data initiatives.
Processes and dynamic capabilities. In: Journal of
Business Research 70, S. 328–337.
Bughin, J., 2016. Reaping the benefits of big data in
telecom. In: Journal of Big Data 3 (1), S. 14.
Chae, H.-C., Koh, C. E., Prybutok, V. R., 2014. Information
Technology Capability and Firm Performance:
Contradictionary Findings and Their Possible Causes.
In: MIS Quarterly 38 (1), S. 305-326.
Chen, D. Q., Preston, D. S., Swink, M., 2016. How the Use
of Big Data Analytics Affects Value Creation in Supply
Chain Management. In: Journal of Management
Information Systems 32 (4), S. 4–39.
Chen, H., Chiang, R. H. L., Storey, V. C., 2012. Business
intelligence and analytics: From big data to big impact.
In: MIS Quarterly 36 (4), S. 1165–1188.
Côrte-Real, N., Oliveira, T., Ruivo, P., 2017. Assessing
business value of Big Data Analytics in European firms.
In: Journal of Business Research 70, S. 379–390.
Debortoli, S., Müller, O., Vom Brocke, J., 2014. Comparing
Business Intelligence and Big Data Skills. In: Bus Inf
Syst Eng 6 (5), S. 289–300.
El Sawy, O. A.; Pavlou, P. A., 2008. IT-Enabled Business
Capabilities for Turbulent Environments. In: MIS
Quarterly Executive 7 (3), S. 139–150.
Esteves, J., Curto, J., 2013. A risk and benefits behavioral
model to assess intentions to adopt big data. In:
Proceedings of the 10th International Conference on
Intellectual Capital, knowledge Management and
Organisational Learning: ICICKM 2013, 2013.
Field, A., 2013. Discovering Statistics using IBM SPSS
Statistics. Fourth Edition. London: SAGE Publications
Ltd.
Gunasekaran, A., Papadopoulos, T., Dubey, R., Wamba, S.
F., Childe, S. J., Hazen, B., Akter, S., 2017. Big data
and predictive analytics for supply chain and
organizational performance. In: Journal of Business
Research 70, S. 308–317.
Gupta, M., George, J. F., 2016. Toward the development of
a big data analytics capability. In: Information &
Management 53 (8), S. 1049–1064.
Hair, J. F., Black, W. C., Babin, B. J., Anderson, R. E.,
Tatham, R. L., 2006. Multivariate data analysis. 6th ed.:
Pearson Education International.
Kwon, O., Lee, N., Shin, B., 2014. Data quality
management, data usage experience and acquisition
intention of big data analytics. In:
International Journal
of Information Management 34 (3), S. 387-394.
Low, C., Chen, Y., Wu, M., 2011. Understanding the
determinants of cloud computing adoption. In: Industr
Mngmnt & Data Systems 111 (7), S. 1006–1023.
Malaka, I., Brown, I., 2015. Challenges to the
Organisational Adoption of Big Data Analytics: A Case
Study in the South African Telecommunications
Industry. In: Proceedings of the 2015 Annual Research
Conference on South African Institute of Computer
Scientists and Information Technologists. ACM.
Manyika, J., Chui, M., Brown, B., Bughin, J., Dobbs, R.,
Roxburgh, Ch., Byers, A. H., 2011. Big data: The next
frontier for innovation, competition, and productivity.
In: McKinsey Global.
Mikalef, P., Pappas, I. O., Krogstie, J., Giannakos, M.,
2017. Big data analytics capabilities. A systematic
literature review and research agenda. In: Inf Syst E-Bus
Manage 17 (2), S. 1.
Nam, D.-w., Kang, D.-w., Kim, S. H., 2015. Process of big
data analysis adoption: Defining big data as a new IS
innovation and examining factors affecting the process.
48th Hawaii International Conference on System
Sciences (HICSS). HI, USA, 05.01.2015 - 08.01.2015:
IEEE.
Oliveira, T., Martins, M. F., 2011. Literature Review of
Information Technology Adoption Models at Firm
Level. In: The Electronic Journal Information Systems
14 (1), S. 110–121.
Prescott, M. E., 2016. Big Data: Innovation and
Competitive Advantage in an Information Media
Analytics Company. In: Journal of Innovation
Management 4 (1), S. 92–113.
Salleh, K. A., Janczewski, L., 2016. Adoption of Big Data
Solutions: A study on its security determinants using
Sec-TOE Framework. In: CONF-IRM, S. 66.
On the Adoption of Big Data Analytics: Interdependencies of Contextual Factors
431
