
Centralized Scheduling Approach to Manage Smart Charging
of Electric Vehicles in Smart Cities
Giuseppe Graber, Vincenzo Galdi, Vito Calderaro, Francesco Lamberti and Antonio Piccolo
Department of Industrial Engineering, University of Salerno, Fisciano (SA), Italy
Keywords: Charging Scheduling, Data Clustering, Electric Vehicles, Genetic Algorithms, Smart Charging.
Abstract: Electric vehicles (EVs) are emerging as the future of individual mobility systems in smart cities since they
reduce greenhouse gas emissions and fossil fuel dependence. However, the deepening penetration of battery
EVs forecasted for the incoming years could cause significant stress on distribution networks (DNs), as well
as the need to address the growing energy demand. In order to limit the negative drawbacks associated with
EVs charging demand, the paper proposes a centralized approach for the EVs smart charging, and its
performance are compared with the uncontrolled charging approach. An optimization framework is
formulated in order to reduce both the overall peak power demand and the EVs charging cost according to
the electricity prices during the day. Finally, several Monte Carlo simulations are carried out to evaluate the
benefits introduced by the proposed scheduling strategy on a real case study, in terms of charging cost for
EVs’ users, satisfaction of EVs charging needs, and flattening of the load profile.
1 INTRODUCTION
Electric vehicles (EVs) are becoming a very
interesting option to reduce both fuel consumption
and greenhouse gas emissions in the transportation
sector for the near future, (IEA, 2016). Therefore,
world governments are pushing more and more
electric mobility in the smart cities. As a result, EVs
penetration is expected to reach an amount between
10% and 25% of the overall circulating vehicles in the
2010-2030, (Mukherjee, 2015). Unfortunately,
lithium batteries of EVs still ensure a limited range of
only 150-200 km, and they often need to charge,
(Nissan, 2015). For these reasons, significant EVs
charging activities will mostly take place in users’ car
garages, public or corporate car parks and dedicated
charging stations (You, 2017 – Yu, 2016). However,
a deep penetration of EVs could increase both
average and peak load in the distribution networks,
where the charging stations are usually connected,
with a potential reduction of its reliability due to the
overloads, (Hao Xu, 2016 – Veldman, 2015). Several
studies showed that smart charging strategies could
contribute to support a deeper penetration of EVs
within distribution networks, (de Hoog, 2015 – Hao
Xing, 2016). Thus, the need for optimal charging
scheduling algorithms is becoming a relevant issue to
face with future power system planning and
management actions, (Kumar, 2015 – Qi Kang,
2016). Scheduling strategies, also, aim to optimize
EVs charging cost introducing charging options
based on real-time and/or day-ahead price
information, (Cao, 2012 – Vandael, 2015).
The smart charging problem is well studied, and
many approaches are proposed in the technical
literature. Among them, it is possible to discern two
main categories based on centralized or decentralized
approaches, (Bina, 2015 – Esmaili, 2015).
Decentralized scheduling assumes there is no central
controller and all individuals decide or optimize their
own charging profiles. Since smart grids are large-
scale systems, centralized algorithms may be
unfeasible due to lack of scalability, requirement for
global information, and expensive implementation
cost, while decentralized control algorithms are
deemed as a promising alternative, (Jiang, 2014). The
algorithms proposed in (Gan, 2013) require each EV
reporting its power demand to an aggregator. The
aggregator then broadcasts a few messages from
which each EV makes locally based and binary
charging decisions (charge or not charge). In (Wen,
2012), Authors consider a multi-layer hierarchical
power network in which each sub-aggregator can
decide the states of its associated EVs locally. On the
other hand, the centralized scheduling algorithms
238
Graber, G., Galdi, V., Calderaro, V., Lamberti, F. and Piccolo, A.
Centralized Scheduling Approach to Manage Smart Charging of Electric Vehicles in Smart Cities.
DOI: 10.5220/0006761002380245
In Proceedings of the 7th International Conference on Smart Cities and Green ICT Systems (SMARTGREENS 2018), pages 238-245
ISBN: 978-989-758-292-9
Copyright
c
2019 by SCITEPRESS – Science and Technology Publications, Lda. All rights reserved

provide a higher EV integration level in the existing
grid, (Wanrong, 2014 – Zhou, 2014): in fact, a single
operator controls precisely time duration and rates of
all charging actions. Each EV submits detailed
information to a central processing unit, which
produces the charging schedule for each EV,
considering various objectives, such as power loss
and/or load variance minimization, or maximization
of the EVs penetration level (Veldman, 2015 – Qi
Kang, 2016). Within the literature, (Rezaee, 2013)
presents a global scheduling optimization problem in
which the charging events are chosen to minimize the
total EVs charging cost during the day. (Cao, 2012)
proposes optimized EV charging strategies in
response to time-of-use (ToU) prices in a regulated
market. Finally charging scheduling algorithms
present an opportunity also to provide electric energy
storage (EES)-based ancillary services, e.g.,
smoothing intermittency due to renewable energy
sources (RESs) and supporting grid-widefrequency
stability, (Zhang, 2014 – Falahati, 2016).
Here, we want to hightlight that a centralized
approach to manage the scheduling of EVs,
represents a good solution for two important aspects:
i) by means of adequate optimization strategies it is
possible to take into account the requirements of
users, distribution systems, and aggregators; ii) in
perspective, more different aggregators can represent
controlled buses for a smart grid, and a centralized
approach allows using the potentiality of the bus as
generator, load or storageto support the distribution
systems.
In order to highligth these potentialities, we
propose a contribution that mainly consists of two
parts: i) a formulation of an optimization problem to
centralize the management of EVs charge, by
flattening the demand load profile and minimizing the
EVs charging costs, according to the electricity prices
during the day; ii) the assessesment of the impact of
EVs on a real microgrid to evaluate the benefits
introduced by the proposed smart charging method.
The management proposal is tested by using
measured data and identifying typical load cluster
for the EVs charging demand.
The remainder of paper is organized as follows:
Section 2 describes the data acquisition and clustering
methods employed in the CO.S.MO. research project.
Section 3 points out the mathematical formulation of
the proposed scheduling problem, while results of
several simulations based on the case study
represented by the University of Salerno (UniSA)
campus are discussed in Section 4. Finally, Section 5
ends the paper with concluding remarks.
2 MODELING AND PROBLEM
FORMULATION
Here we describe the charging stations (CSs) model,
the proposed approach to the centralized EVs smart
charging and some details on its implementation.
2.1 Charging Mode
According to the Nissan Leaf specifications (Nissan,
2015), we consider two values of CSs’ rated power
for the incoming EVs in the parking areas: AC1 (230
V, 3.3 kW) for domestic use charging and AC2 (230
V, 6.6 kW) for public use charging, (de Hoog, 2015).
However, the proposed methodology can be applied
even in the case of other types of charging stations.
For each CS
i
, given the residual SoC value of the EV
connected to it, SoC
i
(t), its variation at time t+dT is
described as follows:
)()()(
3600
)(
)()(
tItVPtP
C
dTtP
tSoCdTtSoC
ii
CH
i
Batt
i
Batt
Batt
i
ii
(1)
Where dT is the time-step,
)(tP
CH
i
represents the
charging power at charging station CS
i
, and η is the
charging efficiency.
)(tP
Batt
i
, V
i
(t) and I
i
(t) are the
battery charging power, voltage and current,
respectively, computed according to the constant
current (ccm) and constant voltage (cvm) charging
mode of the EV battery, (Cao, 2012): they are
approximated by (2) and depicted in Figure 1.
SoC
i
cv
i
SoC
i
cv
i
cv
ii
SoC
i
cc
i
cc
i
SoC
i
cc
ii
uVu
T
t
VV
u
T
t
IuII
1exp1
1exp
(2)
Here
cc
i
I
and
cc
i
T
represent the current values and
the duration, respectively, of the battery in ccm,
while,
cv
i
V
and
cv
i
T
represent the minimum voltage,
the maximum voltage and time constant of the
battery, respectively, in cvm. Finally,
SoC
i
u
is a binary
variable and its value is defined by the SoC value. In
particular, we assume the ccm for SoC values below
80% and thus we set
SoC
i
u
= 1, while
SoC
i
u
= 0 in the
cvm where SoC > 80%.
Centralized Scheduling Approach to Manage Smart Charging of Electric Vehicles in Smart Cities
239

Figure 1: Charging modes of the battery pack.
We define the effective charging time
CH
i
t
for the
EV user connected to the CS
i
as the minimum value
between the expected parking time
PARKING
i
T
and the
required time to fully charge the EV,
CHARGE
i
T
. If
PARKING
i
T
<
CHARGE
i
T
, then
CH
i
t
is set to the time
required to the CS
i
to bring the SoC to such a value as
to allow the EV user coming back to its departure site.
In this case, it is necessary to wait for an extra time
before the charging session is complete.
To address the worst case in terms of additional
load required at the point of common coupling (PCC),
we assume the number of available CSs equal to the
capacity of the considered parking areas.
2.2 Scheduling Optimization Problem
The main idea of the proposed scheduling approach
is to break the required charging time into many small
charging intervals within the parking time, (Rezaei,
2014). In each scheduling-slot, Δt, if enabled, a CS
can charge the EV connected to it only for the
duration of the scheduling-slot providing a charging
packet. During each Δt, the algorithm assigns the
starting time of each charging packet for all EVs in
the parking areas minimizing the peak demand and
the charging cost at the same time. Each EV is
charged according to a FCFS - first come first serve -
service policy. The proposed scheduling technique is
mathematically formulated as follows:
CS
PARKING
i
PACK
i
START
ji
N
i
T
N
j
START
ji
CHARGE
i
BASESTART
ji
t
dtttptpttcJ
J
1 1
,,
)()()(
min
,
(3)
The problem (3) is subject to the constraints (4):
Where NCS is the number of CSs, represents the
number of charging packet for the EV at CSi (it is the
first integer greater than /Δt). Moreover, c(t)
represents the electricity unit price depending on the
hours of day, is the starting time of the j-th charging
packet related to the EV connected to the CSi. Finally,
(t) is the forecasted base load including production
from RES whereas (t) is the charging power supplied
by CSi to the EV.
Finally,
BASE
p
(t) is the forecasted base load
including production from RES whereas
CHARGE
i
p
(t) is
the charging power supplied by CS
i
to the EV.
CS
Batt
i
CHARGE
i
T
CS
BattSTART
i
CHARGE
i
CS
PARKING
i
START
Ni
PACK
i
CS
START
ji
START
ji
CS
START
i
Ni
tP
tp
NiCSoCdttp
NiTtt
Nj
Nittt
Nittt
PARKING
i
PACK
i
,...,1
)(
)(0
,...,1)1()(
,...,1
,...,1
,...,1
,...,1,
,
,1,
1,
(4)
In (4),
START
i
SoC
and
)(tP
Batt
i
are the residual SoC
values of the EV at the CS
i
and its required charging
power, respectively.
2.3 Method of Solution
A heuristic algorithm based on genetic algorithm
(GA) is proposed to solve the scheduling problem.
The GA based scheduler for each EV in the parking
areas computes the scheduling-slot sequence in which
each EV is enabled to receive a charging packet. We
use a binary chromosome changing its length
according to the
PARKING
i
T
value, for each EV in the
parking areas. Thus, they are aggregated into a single
2-dimensional chromosome representing the
scheduling solution.
The structure of the scheduling chromosome
composed by several EV-chromosome with different
length is shown in Figure 2. The scheduling is a
Figure 2: Genetic representation of the scheduling.
SMARTGREENS 2018 - 7th International Conference on Smart Cities and Green ICT Systems
240
is a 2-dimensional matrix having number of row
equal to the EVs in the parking areas, N, and number
of column depending on the maximum parking time
(in scheduling slot), M, among all the EVs. The
number and the length of the scheduling chromosome
also affects the simulation speed performance and the
reliability of the final solution. Therefore, we impose
a limit of 10.000 iterations and a population of 20
scheduling chromosomes.
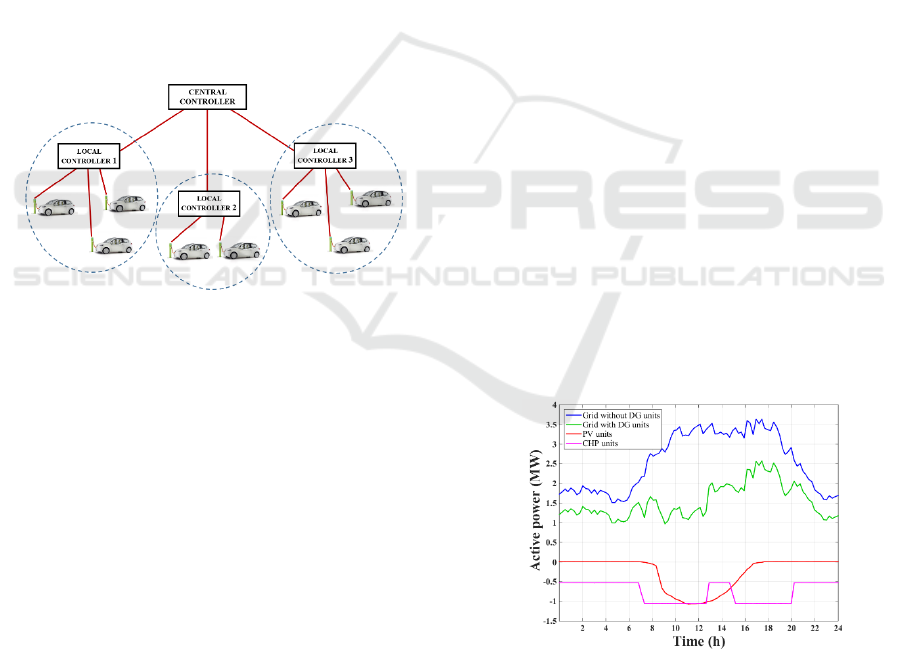
In Figure 3 is shown the proposed scheduling
architecture: a central controller (CC) is assumed
receiving the forecasted base load and the production
from RES for the day. Each charging station
communicates with a local controller (LC) - one for
each parking area - to send the charging
update/request of the EV connected to it. LCs acquire
and aggregate data sent by the CSs located in their
parking area and transmit them to the CC. According
to data provided by LCs, CC performs the scheduling
optimization deciding when to allow each CS to
charge the EV connected to it.
Figure 3: Architecture of the coordinated scheduler.
In the following, the CC and LC routines,
performed on a daily base, are shown.
Initialize: The CC forecasts the base
load for the current day.
Loop (for each scheduling slot):
Begin LC routine
1. Receive the scheduled charging
sessions for the current time slot
from the CC.
2. Acquire new charging request.
3. Update charging vehicles status.
4. Send data to the CC.
End
Begin CC routine
1. Receive the new charging request
and the charging vehicles status
for the current time slot.
2. Run the EVs scheduling strategy
to all the vehicles in the parking
areas.
3. Update base load profile
addicting in charge EVs.
4. Update the base load forecast,
including the RES
5. Send data to the LCs.
End
End
3 SIMULATION AND RESULTS
To show the effectiveness of the presented
methodology, a Monte Carlo simulation framework is
implemented to calculate the EVs charging needs
starting from given statistical distribution of
incoming EVs, their parking times and residual SoC
values, (Calderaro, 2014). We use real data acquired
during the fulfilment of CO.S.MO. research project,
and processed through clustering operations.
3.1 Case Study
The UniSA microgrid is a 12 bus 20 kV distribution
system with two feeders configured in closed loop.
Connected to the grid, there are several distributed
generators (DG): two cogeneration (CHP) units, with
a rated power of 580 kW each one, and eight
photovoltaic (PV) power plants for a total PV rated
power of 1076 kW installed on the roof of the campus
buildings. CHP units produce both electricity used to
supply the loads and thermal energy used to heat
water of the campus sport facilities.
Figure 4: Active power drown from the UniSA microgrid.
In Figure 4 is shown the typical daily profiles of
the net active power drown from the main external
PCC by the UniSA network. Blue and green lines
depict the active power absorption with and without
internal PVs and CHPs, respectively. Finally, red and
Centralized Scheduling Approach to Manage Smart Charging of Electric Vehicles in Smart Cities
241

pink lines show the average (calculated every 15
minutes) active power generated by the PV and CHP
units.
Table 1: Daily price of the electricity cost.
Price category
Hours
Days
F1 – Peak
10:00 - 15:00 /
18:00 - 21:00
Monday to
Friday
F2 – Mid-level
07:00 - 10:00 /
15:00 - 18:00 /
21:00 - 23:00
Monday to
Friday
07:00 -23:00
Saturday
F3 – Off-peak
23:00 - 07:00
All the week
and holidays
Table 1 shows the three hourly price categories for
the electricity cost in the UniSA campus. Adopting
the actual prices of peak, mid-level and off-peak load
period in the city are 0.18 €/kWh, 0.14 €/kWh and
0.10 €/kWh, respectively, (Enel Distribuzione, 2017).
3.2 Data Acquisition
CO.S.MO. (Cooperative Systems for Sustainable
Mobility and Energy Efficiency) was a 32-months
pilot project co-founded by the European
Commission involving the installation of advanced
intelligent transportation system (ITS), in three pilot
sites: Göteborg (SE), Vienna (AT), and the UniSA
campus in Salerno (IT), (Alcaraz, 2013). The scope
of CO.S.MO. was to prove and quantify the benefits
of cooperative mobility services for increasing the
energy efficiency of infrastructures and vehicles.
Figure 5: Parking areas at UniSA - Google Maps view.
Several cameras and antennas systems were
installed at both entrances and exits of UniSA parking
areas (outlined in Figure 5), in order to record data
related to their occupancy level. They were able to
read vehicles plates, date, time and parking time: all
data was stored in a database. It consists of more than
200.000 parking events over a one-year period of
observation. The collected data are representative of
the parking areas used by a significant number of
students with their own car.
3.3 Data Clustering Results
In order to assess the different state of charge (SoC)
values for trips made with EVs, we evaluate the
origin-destination routes of students enrolled at the
UniSA. The data analysis allows classifying all
different paths to reach UniSA campus from different
departure points in terms of urban, extra urban and
highway routes. According to the studies published
by the Idaho National Laboratory, (INL, 2015) real
users of EVs show a strong preference to charging in
the evening and driving during the day. Thus we
assume the students’ EVs leaving fully charged from
each departure point (e.g., students’ homes), and we
derive the arrival residual SoC by using Eq. 5.
Batt
HHEEUU
da
C
dcdcdc
SoCSoC
)()()(
(5)
Where SoC
a
e SoC
d
are the arrival and departure
SoC values, respectively, and C
Batt
[kWh] is the EV’s
battery capacity. Here, c
U
, c
E
, c
H
[kWh/km] represent
the energy consumptions coefficients, whereas d
U
, d
E
,
d
H
[km] are the distances covered in the urban, extra
urban, and highway route, respectively.
We compute the electric energy consumption of
the EVs associated to each travel, assuming as
reference EV the Nissan Leaf model, having battery
capacity of 24 kWh. The manufacturer provides the
average consumptions for different route types and
they are shown in Table 2, (Nissan, 2015).
Table 2: Nissan Leaf Energy Consumption.
Route Type
Value [kWh/km]
Urban
0.160
Extra urban
0.126
Highway
0.185
Mixed
0.169
By analysing the departure points of the UniSA
students considering the shortest path to reach the
campus, 50 clusters are derived, each one with a
different residual SoC value at the arrival in the
parking areas (Figure 6). The average residual SoC
value of EVs arriving at the UniSA is approximately
equal to 70%.
Figure 7 illustrates the statistical distribution of
the average EVs parking time. In particular, the most
of the students arrive at the UniSA campus around the
8:30 a.m. and they are characterized by an average
parking time of 4 hours. This fact leads to an expected
SMARTGREENS 2018 - 7th International Conference on Smart Cities and Green ICT Systems
242
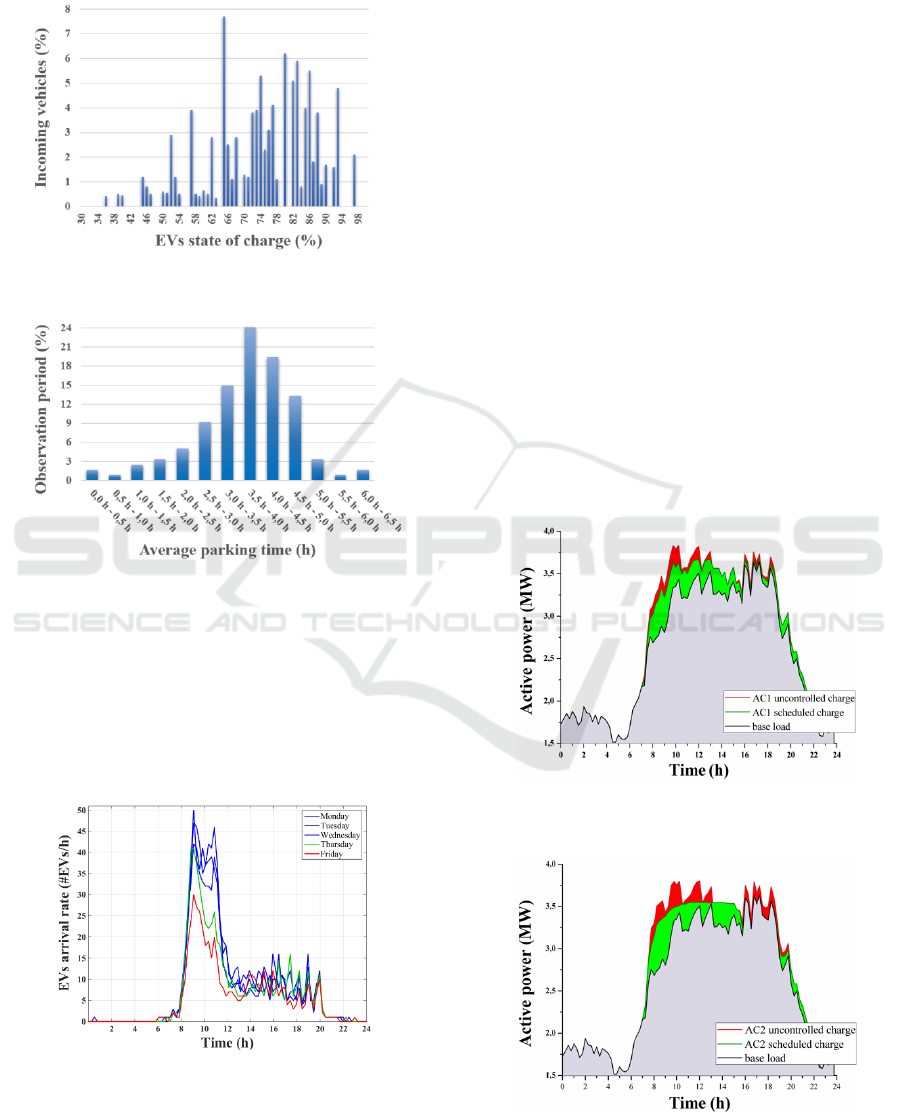
peak demand for charging between 9:00 a.m. and
12:00 a.m. that can be flattened by the scheduler
according to the parking time declared by each EV.
Figure 6: Residual SoC of incoming EVs.
Figure 7: Average parking time of incoming EVs.
Data related to the parking areas occupancy and
hourly rate of incoming EVs, collected during the
observation period, on a day-by-day base, are
analysed in order to find common features concerning
the days of the week, months, and seasons. Thus, they
are taken into account by splitting the observation
period into different clusters.
Figure 8: Arrival rate of incoming EVs (courses period).
The clustering function is implemented by using
the k-means algorithm because it ensures a very quick
convergence and it minimizes the total intra-cluster
variance. All the observed days are divided in two
main clusters: the first one concerning the
institutional courses period and the second one related
to the examination period. The courses period cluster
is characterized by days in which the EVs’ arrival rate
is significantly greater than those are in the
examination period cluster. It is possible to subdivide
the first main cluster in three other different sub-
clusters: from Monday to Wednesday, Thursday and
Friday respectively. In Figure 8 is shown the EVs’
arrival rate cluster to one parking area for each day of
the week, during the institutional courses periods. The
examination period is considered as a single cluster,
because of the absence of relevant differences among
the weekdays. Thus, four different daily clusters are
assumed adequate to describe arrival rate concerning
the three parking areas.
3.4 Scheduled Ev Charging Results
Figure 9 and Figure 10 show the comparison between
the uncontrolled charge and the proposed scheduling
strategy assuming AC1 and AC2 charging stations,
respectively. It is worth to note a flattened load profile
and a significant reduction of the peak power
absorption in the hours between 8:00 a.m. and
Figure 9: Comparison between uncontrolled and scheduled
charging (AC1 CSs).
Figure 10: Comparison between uncontrolled and
scheduled charging (AC2 CSs).
Centralized Scheduling Approach to Manage Smart Charging of Electric Vehicles in Smart Cities
243

12:00 p.m. compared to the uncontrolled charging
Specifically, the proposed scheduling algorithm
shows, at 9:45 a.m., a peak reduction of 232 kW and
326 kW for AC1 and AC2 charging stations,
respectively. On the other hand, the scheduler
significantly increases the load profile during the
hours of low charging demand assuming the
uncontrolled charging, e.g. between 2:00 p.m. and
4:00 p.m. The charging peak demand by using AC1
CSs is slightly higher than the peak of the base load
(at 17:00 p.m.) while it is always lower by using AC2
CSs. Furthermore, Table 3 shows the comparison on
battery SoC level reached by EVs between AC1 and
AC2 CSs. In particular, the number of EVs having
battery SoC level able to get home the user, and the
number of fully charged EVs compared to the overall
EVs are assumed as performance indices.
Table 3: SoC level (AC1 and AC2 CSs).
Residual SoC [%]
Number of EVs
AC1 mode
AC2 mode
SoC ≥ 80
100 (87)
100 (94)
65 ≤ SoC < 80
100 (74)
100 (83)
50 ≤ SoC < 65
92 (50)
99 (92)
30 ≤ SoC < 50
62 (41)
80 (72)
By using the AC1 CSs the scheduler ensures to all
users with residual SoC value higher than 65% to
come back to their departure point, but not to fully
charge their vehicle. For users with residual SoC
value less than 65% (about 20% of all EVs in a single
day), the performance indices are higher than 70%.
However, AC2 CSs ensure that all incoming EVs in a
day are able to come back to their starting point, but
only 90% can fully charge their vehicle. Table 4
shows the comparison concerning the charging extra
time by using the proposed scheduling strategy
between AC1 and AC2 modes. The average extra
time required to complete the EVs charge is
considered when T
PARKING
< T
CHARGE
: it is due to EV
user expected parking time and it is minimized by
scheduling operations. By using AC1 CSs, EVs with
the lowest residual SoC value have to wait an average
extra-time of about 2 hours, whereas AC2 CSs lead to
an average extra-time less than 1 hour.
Table 4: Charging extra time (AC1 and AC2 CSs).
Residual SoC [%]
Average extra time [min]
AC1 mode
AC2 mode
SoC ≥ 80
45
18
65 ≤ SoC < 80
74
30
50 ≤ SoC < 65
99
46
30 ≤ SoC < 50
121
52
Finally, Table 5 shows the comparison concerning
the average charging cost by using the proposed
scheduling strategy. In particular, EV user benefits of
a slightly reduction in the average charging cost
because the chronological shift of the charging
packets allow to obtain a lower electricity cost. In
particular, the average charging cost is reduced by
16.2% and 18.5% compared to uncontrolled charge
and considering AC1 and AC2 CSs, respectively.
Table 5: Charging cost (AC1 and AC2 CSs).
4 CONCLUSIONS
The paper presents a centralized scheduling algorithm
for optimizing EVs charge in smart grids in order to
minimize the EVs charging costs and reduce the peak
power demand. The UniSA parking areas are
characterized in terms of incoming EVs rate and
hourly occupancy level, according to a large
measured database, in order to evaluate the EVs
charging demand. Several Monte Carlo simulations
are performed to test the proposed scheduling
algorithm. Obtained results confirm the effectiveness
of the proposed scheduling algorithm: by using AC1
CSs, it ensures up to 75% of users the minimum
charge required to come back to their departure point,
whereas by using AC2 CSs it ensures the fully charge
to over 90% of users. Finally, the EV user’s further
benefits by a lower charging cost compared to the
uncontrolled charge. In conclusion, the obtained
results proof that by means of optimization strategies
it is possible to take into account the requirements of
users, distribution systems, and aggregators;
furthermore, with regard to distribution system
impact, the results show that an aggregator is a
potential smart bus that can bring many benefits to
distribution systems.
ACKNOWLEDGEMENTS
The authors gratefully thank UE and all technological
partners who have contributed to the success of the
CO.S.MO. research project.
PEV charge
Average charging cost [€]
AC1 mode
AC2 mode
Uncontroled
1.78
1.62
Scheduled
1.49
1.32
SMARTGREENS 2018 - 7th International Conference on Smart Cities and Green ICT Systems
244

REFERENCES
International Energy Agency (IEA), 2016. World Energy
Outlook. Available on line at url
http://www.worldenergyoutlook.org /weo2016/
Mukherjee, J.C., Gupta, A., 2015. A Review of Charge
Scheduling of Electric Vehicles in Smart Grid. In IEEE
Systems Journal, vol. 9, pp. 1541-1553.
Nissan, 2015. Nissan Leaf prices and specifications.
Available on-line at: <http://media.nissan.eu/content
/dam/pes/GB/leaf/prices_and_equipment/pdf/New-
LEAF-Tech-Spec-and-Pricesv3.pdf>, pp. 1-7.
You P., Low S. Tushar W., Geng G., Yuen C., Yang Z., Sun
Y., 2017. Scheduling of EV Battery Swapping, I:
Centralized Solution. In IEEE Trans. on Control of
Network Systems, vol. PP.
Rong Yu R., Zhong W., Xie S., Yuen C. Gjessing S., Zhang
Y., 2016. Balancing Power Demand through EV
Mobility in Vehicle-to-Grid Mobile Energy Networks.
In IEEE Trans. on Industrial Informatics, vol. 12, pp.
79-90.
Hao Xu, Fan Ouyang, Haifeng Liu, Shihong Miao, Haiguo
Tang, Wenwu Liang, Hui Li, Dongyuan Shi, 2016. A
probability load modeling method for the charging
demand of large-scale PEVs accounting users’ charging
willingness. In International Journal of Electrical
Power & Energy Systems, vol. 82, pp. 331-338.
Veldman, E., Verzijlbergh, R.A., 2015. Distribution Grid
Impacts of Smart Electric Vehicle Charging From
Different Perspectives," IEEE Trans. on Smart Grid,
vol. 6, pp. 333-342.
de Hoog, J., Alpcan, T., Brazil, M., Thomas, D.A., Mareels,
I., 2015. Optimal Charging of Electric Vehicles taking
Distribution Network Constraints into Account. In
IEEE Trans. on Power Systems, vol. 30, pp. 365-375.
Hao Xing, Minyue Fu, Zhiyun Lin, Yuting Mou, 2016.
Decentralized Optimal Scheduling for Charging and
Discharging of Plug-In Electric Vehicles in Smart
Grids. In IEEE Trans. on Power Systems, vol. 31, pp.
4118- 4127.
Kumar K.N., Sivaneasan B., Lam So, P., 2015. Impact of
Priority Criteria on Electric Vehicle Charge
Scheduling. In IEEE Trans. on Transportation
Electrification, vol. 1, pp. 200-210.
Kang, Q., Wang, J., Zhou, M., Ammari, A.C., 2016.
Centralized Charging Strategy and Scheduling
Algorithm for Electric Vehicles Under a Battery
Swapping Scenario. In IEEE Trans. on Intelligent
Transportation Systems, vol. 17, pp. 659-669.
Cao, Y. Tang, S., Li, C., Zhang, P., Tan, Y., Zhang, Z., Li,
J., 2012. An Optimized EV Charging Model
Considering TOU Price and SOC Curve. In IEEE
Trans. on Smart Grid, vol. 3, pp. 388-393.
Vandael, S., Claessens, B., Ernst, D., Holvoet, T.,
Deconinck, G., 2015. Reinforcement Learning of
Heuristic EV Fleet Charging in a Day-Ahead Electricity
Market. In IEEE Trans. on Smart Grid, vol. 6, pp. 1795-
1805.
Bina, T., Ahmadi, D., 2015. Stochastic modelling for
scheduling the charging demand of EV in distribution
systems using copulas. In International Journal of
Electrical Power & Energy Systems, vol. 71, pp. 15-25.
Esmaili, M., Goldou, A., 2015. Multi-objective optimal
charging of plug-in electric vehicles in unbalanced
distribution networks. In Int. Journal of Electrical
Power & Energy Systems, vol. 73, pp. 644-652.
Jiang, T., Putrus, G., Gao, Z., Conti, M., McDonald, S.,
Lacey, G., 2014. Development of a decentralized smart
charge controller for electric vehicles. In International
Journal of Electrical Power & Energy Systems, vol. 61,
pp. 355-370.
Gan, L., Topcu, U., Low, S.H., 2013. Optimal decentralized
protocol for electric vehicle charging. In IEEE Trans.
on Power Systems, vol. 28, pp. 940-951.
Chao-Kai Wen, Jung-Chieh Chen, Jen-Hao Teng, Pangan
Ting, 2012. Decentralized energy management system
for charging and discharging of plug-in electric
vehicles. In Wireless Communications & Signal
Processing Int. Conference, pp. 1-6.
Wanrong T., Suzhi Bi, Y.J.A. Zhang, 2014. Online
Coordinated Charging Decision Algorithm for Electric
Vehicles without Future Information. In IEEE Trans.
on Smart Grid, vol. 5, pp. 2810-2824.
Kan Zhou, Lin Cai, 2014. Randomized PHEV Charging
Under Distribution Grid Constraints. In IEEE Trans. on
Smart Grid, vol. 5, pp. 879-887, March 2014.
Rezaee, S., Farjah, E., Khorramdel, B., 2013. Probabilistic
analysis of plug-in electric vehicles impact on electrical
grid through homes and parking lots. In IEEE Trans. on
Sustainable Energy, vol.4, pp. 1024-1033.
Tian Zhang, Wei Chen, Zhu Han, Zhigang Cao, 2014.
Charging Scheduling of Electric Vehicles with Local
Renewable Energy under Uncertain Electric Vehicle
Arrival and Grid Power Price. In IEEE Trans. on
Vehicular Technology, vol. 63, pp. 2600-2612.
Falahati, S., Taher, S.A., Shahidehpour M., 2016. A new
smart charging method for EVs for frequency control of
smart grid. In International Journal of Electrical Power
& Energy Systems, vol. 83, pp. 458-469.
Alcaraz, G., Galdi, V., Trapuzzano, A., 2013. Cooperative
Systems for Energy Efficiency and driver behaviour
change: University of Salerno Pilot Site Results. In ITS
European Congress, pp. 1-6.
Idaho National Laboratory (INL), 2015. Plugged In: How
Americans Charge Their Electric Vehicles. Available
on-line at: <https://avt.inl.gov/sites/default/files/pdf/
arra/SummaryReport.pdf>.
Rezaei, P., Frolik, J., Hines, P.D.H., 2014. Packetized Plug-
In Electric Vehicle Charge Management. In IEEE
Trans. on Smart Grid, vol. 5, pp. 642-650.
Calderaro, V., Galdi, V., Graber, G., Massa, G., Piccolo, A.,
2014. Plug-in EV charging impact on grid based on
vehicles usage data. In IEEE International Electric
Vehicle Conference, pp. 1-7.
Enel Distribuzione, 2017. Price categories for the electricity
cost. Available on-line at: <https://www.enelservizio
elettrico.it/itIT/tariffe/altriusi/bta-6-trioraria>.
Centralized Scheduling Approach to Manage Smart Charging of Electric Vehicles in Smart Cities
245
