
Usage Analytics: Research Directions to Discover Insights from
Cloud-based Applications
Duc-Tien Dang-Nguyen, Manoj Kesavulu and Markus Helfert
Lero - Irish Software Research Organization, Ireland
School of Computing, Dublin City University, Dublin, Ireland
Keywords:
Usage Analytics, Cloud-based Applications, User Satisfaction, Resource Provisioning.
Abstract:
Usage in the software field deals with knowledge about how end-users use the application and how the ap-
plication reacts to the users’ actions. In a complex and heterogeneous cloud computing environment, the
process of extracting and analysing usage data is difficult since the usage data is spread across various front-
end interfaces and back-end underlying infrastructural components of the cloud that host the application. In
this paper we propose Usage Analytics, a set of potential research directions that could help tackle various
challenges in the cloud domain. We provide an overview of usage analytics in the cloud environment and
propose how to discover insights using these analytics solutions. We give some discussions about challenges
in discovering insights from the usage data as well as provide vision of how usage data will bring benefits to
the cloud environment.
1 INTRODUCTION
Majority of the in-house applications nowadays are
moving to cloud-based environment, with the market
size grows to $246.8B in 2017
1
, increasing more than
10 times in just half a decade. Cloud computing pro-
vides the users with the possibility of using different
devices to use (access) the cloud-based services seam-
lessly (Mell and Grance, 2011). It, however, brings
more challenges to application developers and archi-
tects to understand how the applications work and
how their customer satisfy with the provided services.
To have an example, let us recall the scenario of the
cloud-based picture. Cloud providers deliver the same
service to different customers, who share physical
and/or virtual resources transparently, this concept is
referred as Multi-tenancy (Kabbedijk et al., 2015). A
cloud-based application lets customers share the same
hardware resources, by offering them one shared ap-
plication and database instance, while allowing them
to configure the application to fit their needs as if it
runs on a dedicated environment, these resources are
shared transparently, meanwhile guaranteeing sub-
stantial cost savings (Bezemer et al., 2010). End-
users or consumers interact with the cloud appli-
cations through various interfaces (those being web
1
According to Forbes, http://bit.ly/forbescloudapps2017
browsers, mobile applications, and command-line in-
terfaces). The Infrastructure as a Service (IaaS) model
offers computer - physical or virtual machines - and
other resources, such as raw block storage, file or ob-
ject storage, virtual local area networks (VLANs), IP
addresses, and firewalls. In the Software as a Ser-
vice (SaaS) model, applications deployed on cloud in-
frastructure and are provided to end-users as services
over the internet. The more resources are shared by
multiple different users, the more resources are man-
aged by cloud providers. Extraction of usage data of
the features provided by the cloud applications could
help software developers and architects to make an
informed decision for the development/improvement
of functionalities of the system according to end-user
usage patterns (Pachidi et al., 2014).
Analytical solutions refer to the use of various
analysis techniques and methods such as data min-
ing, machine learning, reasoning, and other methods
to extract useful knowledge and insights from large
data set. For example, a company can use analysis
techniques to understand customers’ behaviour and
predict how they are engaged or which customers are
least likely to quit. These insights can be discovered
via customers’ profiles, memberships they subscribe
to, or their generated content (comments, clicks, and
other interactions). Developers can understand if
some functions do not work properly via the usage
254
Dang-Nguyen, D., Kesavulu, M. and Helfer t, M.
Usage Analytics: Research Directions to Discover Insights from Cloud-based Applications.
DOI: 10.5220/0006764002540261
In Proceedings of the 7th International Conference on Smart Cities and Green ICT Systems (SMARTGREENS 2018), pages 254-261
ISBN: 978-989-758-292-9
Copyright
c
2019 by SCITEPRESS – Science and Technology Publications, Lda. All rights reserved

data generated by the users. User interests can be
modelled by extracting browsing behaviour when ac-
cessing web application (Gasparetti, 2016). Such an-
alytical solutions are considered as increasingly criti-
cal tools for modern enterprise to get an informational
advantage, and have evolved from a matter of choice
to a fundamental requirement in the present competi-
tive business environments. Applying these solutions,
thus, is a key to discover insights from the applica-
tions’ usage.
An intuitive solution is to survey users on
how customers use these applications through well-
designed studies (interviews or surveys). Unfortu-
nately, this approach has different limitations such as
cost to conduct the studies, inability to include large
population and users may not be willing to or able to
self-identify and so on. These issues can be addressed
by using data analytics on the usage data, namely us-
age analytics, which aims to obtain insightful and
actionable information for data-driven tasks, around
applications and services. With the improving of the
data mining tools, these usage data can be gathered
from online services by collecting all traces of user
activity to produce clickstreams, sequences of times-
tamped events generated by user actions. For web-
based services, these might include detailed HTTP re-
quests. For mobile applications, clickstreams can in-
clude everything from button clicks, to finger swipes
and text or voice input (Wang et al., 2016). Insightful
information is information that conveys meaningful
and useful understanding or knowledge towards pro-
viding the target service or user satisfaction to that
service (Zhang et al., 2011). Typically insightful in-
formation is not easily achievable by directly inves-
tigating the raw data without aid of analytical solu-
tions. Developing a usage analytics project typically
goes through iterations of four phases: task defini-
tion, data preparation, analytic-technology develop-
ment, and deployment and feedback gathering. Task
definition is to define the target task to be assisted
by software analytics. Data preparation is to collect
data to be analysed. Analytic-technology develop-
ment is to develop problem formulation, algorithms,
and systems to explore, understand, and discover in-
sights from the data. Deployment and feedback gath-
ering involves two typical scenarios. One is that, as
researchers, we have obtained some insightful infor-
mation from the data and we would like to ask domain
experts to review and verify. The other is that we ask
domain experts to use the analytic tools that we have
developed to obtain insights by themselves. Most of
the times it is the second scenario that we want to en-
able.
In this paper, we will show that when applying
usage analytics in practice, we should fuse a broad
spectrum of domain knowledge and expertise, from
management, machine learning, data processing to in-
formation visualization. By using usage analytics, we
are aiming at proposing powerful tools to address the
following challenges (deeper discussions can be seen
in (Kesavulu et al., 2018)):
1. Resource Provisioning: based on the usage data,
predict the resources that may be allocated to an
application.
2. Problem Diagnosis: analyzing the usage data,
which are the logs in this case, to understand how
to localize the node that is the source of perfor-
mance problems.
3. Understanding User Satisfaction: instead of sur-
veying and asking feedback, how users satisfy with
an application and be revealed via their usage data.
4. Discovering User Behaviour Patterns: Every
user has their own pattern when using an appli-
cation or a service. Understanding these patterns
could help to improve the service or discover the
trends in advance. These patterns, can be discov-
ered from the usage data.
Consequently, the aims of this paper are:
• To provide an overview of what is usage analytics
in the cloud environment and propose a usage data
classification;
• To inspire and motivate researchers to use their
know-how in this new emerging and important
area;
• To propose how future usage data in the cloud ap-
plications should be extracted, and from that in-
sights can be discovered via appropriate analytics
techniques;
• To discuss the challenges in discovering insights
from the usage data and provide vision of how us-
age data will bring benefits to the cloud environ-
ment.
The remainder of the paper is structured as fol-
lows: in Section 2, we discuss the problems and chal-
lenges that exist in understanding what does usage
data mean, challenges in extracting information from
usage data and building an usage data analytics frame-
work and discuss the general requirements for the us-
age analytics framework. We then describe the poten-
tial analytics methods that aim to provide solutions
in Section 3. In Section 4, we discuss the potential
of this research and the corresponding challenges in-
volved. Finally, in Section 5, we provide conclusions
drawn.
Usage Analytics: Research Directions to Discover Insights from Cloud-based Applications
255
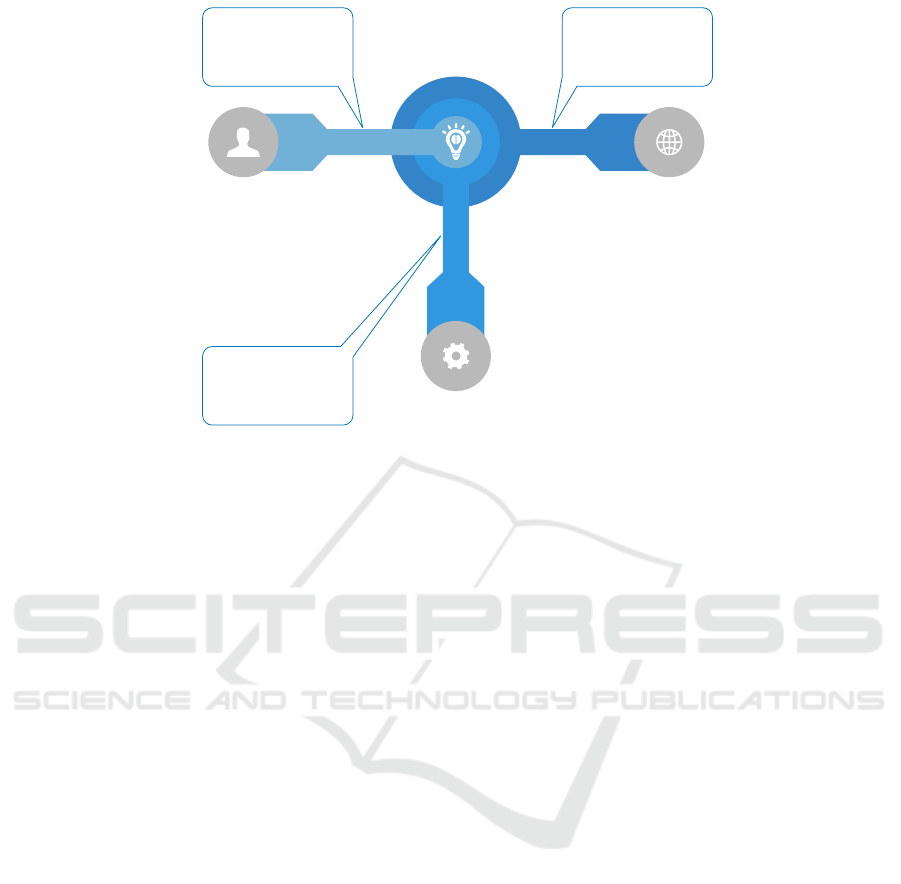
Cloud system logs
Raw Data: Access logs, DB logs, API
logs, activity logs, event data.
Insights: Quality assessment, root
causes, anomaly prediction.
Virtual Machine logs
Raw Data: Memory usage, CPU usage,
task logs (from the installed OS).
Insights: Resource provisioning or
other management actions, i.e., VM
clustering.
Application logs
Raw Data: Assessment data (wiki, forum, message),
activity data (click, time spent), content data (posts,
discussions), event data.
Insights: User satisfaction (with the system) and their
behaviors (time spent, areas of interest, participation
rates, correlation with other users, etc.)
“Monalytics”, clustering,
classification, !
Markov-chain
Rule based, cased-
based reasoner,
classification
Visualisation with
correlations
Figure 1: Three main sources of usage data in cloud-based environment.
2 PROBLEMS, CHALLENGES
AND REQUIREMENTS
In this section, we address a couple of basic questions
in this topic: “what are the usage data?”, “where can
we get them?”, “what are the challenges?” and “what
are the requirements in analysing these data?”.
2.1 What are the Usage Data?
Usage data, as its name suggested, are data gener-
ated when users or customers are using the applica-
tions and services. They can be extracted from any
stage when services and/or applications are being pro-
vided. In this study, we propose to group these data
into three groups, coming from three main sources, as
follows: the system logs from the cloud services from
the back-end of the cloud system, the application logs,
and the logs from the virtual machines (VMs). Fig. 1
shows a summary of the three main sources of usage
data and the answers for the above questions.
System logs contain a wealth of information to
help manage systems. Most systems print out logs
during their executions to record system runtime ac-
tions and states that can directly reflect system run-
time behaviours. System developers and architects
usually use these logs to track a system to detect and
diagnose system anomalies.
The second type of this data is the user-level us-
age data generated as a result of user interaction with
a cloud-based application. Some examples of usage
data are application logs, for example the assessment
data (wiki, forum, message), the activity data (clicks,
time spent), server logs, and so on. They can be
extracted by the applications themselves or via Web
cookies (from web browser). Such data in the cloud is
spread across various interfaces such as Web browser,
mobile applications and command line interfaces on
the front-end and server and database on the back-
end.
The last type of usage data is the VM logs, typ-
ically generated from the VMs running the applica-
tions or services. This type of logs contains the usage
of the CPU, memories, as well as running tasks, time
of starting and stopping and others.
2.2 Challenges in Extracting
Information from Usage Data
As mentioned above, usage data can be extracted at
any stage, and the major challenge is they can be in
any form and format, which brings many challenges
to the analysis. The main questions for usage data
SMARTGREENS 2018 - 7th International Conference on Smart Cities and Green ICT Systems
256

extractor is what usage data should be extracted and
how to map the raw usage data with the right applica-
tions or services. Considering the multi-tenant archi-
tecture of the cloud, different applications share the
same physical and virtual resources. This raises chal-
lenge as in how to separate and extract the logs that
represent each application from the instance (VM) co-
hosting the applications.
Another important challenge is handling with dif-
ferent contextual information. A system usually has a
lot of branches, and thus the systems behaviors may
be quite different under different input data or envi-
ronmental conditions. Knowing the execution behav-
ior under different inputs or configurations can greatly
help system operators to understand system behav-
iors. However, there may be a large number of differ-
ent combinations of inputs or parameters under dif-
ferent system behaviors. Such complexity poses dif-
ficulties for analyzing contextual information related
to the state of interest.
2.3 Challenges in Building Usage
Analytics Framework
Despite the advantages provided by analytical so-
lutions, the solution implementation is usually very
costly, which hinders enterprises, especially the
SMBs (Small and Medium Business), to start such
projects (Sun et al., 2012). Normally, storing huge
volumes of data requires a large storage system as
well as buying (and training how to use) expensive
analytics software. This will come also with a large
number of clusters and powerful machines to run data
analytics algorithms.
Another challenge that related to cost-effective is
limited to only a small number of large companies
or enterprises can effort to run usage analytics frame-
work. They normally have to pay a lot to maintain the
complex software and hardware only for occasional
usages, for example when a financial quarter is over
or some unusual events happen (Sun et al., 2012).
The framework also have to be constantly updated
since the cloud-based environment is also moving
very quickly. The built framework should have the
ability to predict and adapt with the changes of tech-
nologies and able to process new coming types of us-
age data or new types of services and applications.
Last but not least, usage analytics framework re-
quires high skill analysts to run the analytical solu-
tions since it requires constant tuning, validating, and
updating according to the changing business context,
as well as the manner of services and applications.
2.4 Usage Analytics Requirements
Usage analytics requires technologies to efficiently
process and discover insights from large and diverse
usage data. Summing up from several previous stud-
ies in software analytics and cloud computing((Aceto
et al., 2012), (Jehangiri et al., 2013)), we point here
the general requirements for a usage analytics frame-
work:
1. Scalability: The system should be scalable, i.e.,
it should be able to handle a large number of us-
age data extractors. This requirement is very im-
portant in the cloud environments due to a large
number of services and structures of cloud sys-
tems that may grow elastically.
2. Heterogeneous data: The system should consider
a heterogeneous group of metrics. It should allow
to deal with usage data at different levels: service
level (application), virtual IT-infrastructure level
(e.g., VM logs), and fine-grained physical IT-
infrastructure level (e.g., the cloud systems logs).
3. Relationship: There is a hierarchical relationship
between applications, VMs and the physical ma-
chines. These relationships can be changed dy-
namically, thus, the analytics system has to cope
also this aspect.
4. Meaningful: The extracted usage data must be
meaningful from a variety of sources, i.e., the sys-
tem should be able to filter out non-relevant infor-
mation, e.g., noise data. Furthermore, data extrac-
tors should easily be extended, for example, by
adding more plugins.
5. Abstraction: The usage analytics need to ex-
haustively aggregate runtime data from different
sources and consolidate information at a high
level of abstraction.
6. Identification of Influential Metrics: The system
should be able to identify the metrics or param-
eters that strongly influence the decision making,
which will help in decreasing the time and com-
plexity in analysis.
3 ADDRESSING THE
CHALLENGES
In this section, we describe the potential analytics
methods that aim to provide useful tools to solve
the four major problems (summarised in Table 1)
mentioned in the introduction: resource provisioning,
problems diagnosis, understanding user satisfaction,
Usage Analytics: Research Directions to Discover Insights from Cloud-based Applications
257
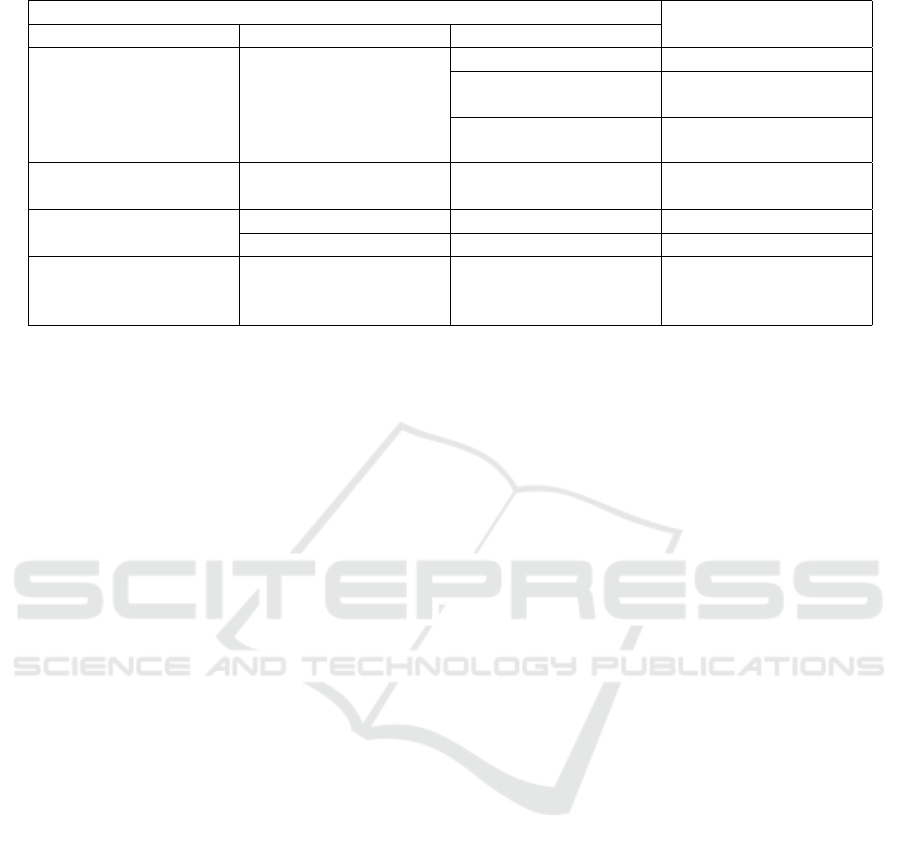
Table 1: The potential solutions for usage analytics problems.
Problem
Potential Solution
Problem Type Problem Area Problem Example
Resource Provision
Cloud Infrastructure
Level
VM Selection Prediction methods
In-time decision mak-
ing
Monalytics
VM Capacity Manage-
ment
Markov-chain
Problem diagnosis Application & Cloud
Infrastructure Level
System Execution Be-
havior
Contextual Analysis
Understanding User
Satisfaction
Application level Feedback analysis Data Visualisation
User level User feedback User Engagement
Discovering User Be-
havior Patterns
User level User patterns Descriptive statistic,
Graph-based decision
making
and discovering user behaviour patterns. Some evalu-
ation methods will be also introduced.
3.1 Resource Provisioning
Let us start with the usage data from the left-most
branch from the diagram in Figure 1. A typical prob-
lem on cloud-based environment is the network re-
source management, for example the acceptable Vir-
tual Machine (VM) configuration to minimize the
resource consumed by certain services deployed on
these VMs. A common problem experienced in data
centers and utility clouds is the lack of knowledge
about the mappings of the services being run by or of-
fered to external users to the sets of virtual machines
(VMs) that implement them (Wang et al., 2011). It
can be done by exploiting analytics methods, for ex-
ample by predictive analysis on the usage data from
the systems logs from each VM, to predict the suit-
able configuration for future VM deployments.
For an in-time decision making, Wang et al.
in (Wang et al., 2011) proposed a system integrat-
ing monitoring with analytics, termed Monalytics,
which can capture, aggregate, and incrementally an-
alyze data on-demand and in real-time, thus increas-
ing accuracy and reducing human intervention in the
analysis process. It was done by applying a cluster-
ing algorithm and a top-k flow analysis (Kumar et al.,
2004) on the data gathered from the CPU usage data
on each VM, identifying the VMs that are responsible
for the majority of the traffic flow in the group. This
provides information on critical VM combinations to
include in the same group to achieve maximum cost
benefit during VM migration.
Usage data on VM can also be exploited to predict
VM states that can be used as the inputs of the ex-
isting networking capacity management techniques.
For example, in (Sun, 2016), the authors proposed
a method named Smart Predictive Capacity Manage-
ment (SPCM) that is designed to assist cloud net-
working deployment in estimating the acceptable net-
work capacity for a specific configuration of interde-
pendent VMs by predicting individual VM states. It is
done by applying Markov chain techniques to address
the data analytics for potential states in heterogeneous
cloud computing environment. This work could help
enterprises to optimise the VM configurations to at-
tain significant performance improvement.
3.2 Problem Diagnosis
With the increasing scale and complexity of the
cloud-based applications, it has become more and
more difficult for system operators to understand the
behaviors of system for tasks such as system prob-
lem diagnosis. For example, system operators need
to understand system execution behaviors to identify
symptoms and root-causes of anomalous nature of
the system. System behaviors include a series of ac-
tions executed by the system and the corresponding
changes in the system states. Although operators usu-
ally investigate a system starting from a specific state
of interest, e.g., a hang state or failure state, it is criti-
cal to identify the series of states the system traversed
to reach the current unstable state.
The study in (Fu et al., 2013) proposes a new ap-
proach for the contextual analysis of system logs to
better understand a systems behaviors. In particular,
they used execution patterns extracted from the sys-
tem logs that ultimately reflect the runtime behavior
of the application, and propose an algorithm to mine
execution patterns from the system logs. Based on the
execution patterns, their approach further learns the
essential contextual factors by modelling the relation-
ships among execution patterns that are responsible
for the execution of specific branch of the system.
SMARTGREENS 2018 - 7th International Conference on Smart Cities and Green ICT Systems
258

In this study, we also propose a contextual anal-
ysis method, inspired by study in (Fu et al., 2013),
by analysing the application logs to better understand
the correlation between users behaviors and the corre-
sponding system. In particular, we propose to use the
Formal Concept Analysis (Ganter and Wille, 1997) to
mine execution patterns from the usage data from all
sources: application, hosting VM(s), and underlying
cloud logs. The execution patterns in this context can
be considered as reflections of user’s interactions with
the application. The mining and learning results can
help system operators understand both the behaviors
of the customers as well as the execution logic of their
services and applications.
3.3 Understanding User Satisfaction
Visualisation is a typical way to help the system ana-
lysts understand how user satisfy with their services.
These information can be grasped more easily and
quickly when presented through comprehensible in-
formation visualizations, for example by the means
of charts, graphs, from the basic interaction usage
data (as shown in the bottom branch of the schema
in Figure 1). This problem has been studied for
decades in learning and multiple ways of visualizing
data increase the perceived value of different feed-
back types (Dyckhoff et al., 2012).
A typical way to access the cloud-based applica-
tions by the end-user is through a web-browser. Data
analytics techniques, e.g., web-mining, in this way,
can be employed to obtain interaction insights. In
(Bucklin and Sismeiro, 2009), the authors provided
an overview of Clickstream data, defined as the elec-
tronic record of a user’s activity, represents the traces
of an end-user takes while accessing the cloud appli-
cation. Analyse such kind of information can discover
how a user satisfy with the provided services based on
the interaction of the users (obtained via the number
of clicks, time spent, and other usage data).
Usage analytics can also reveal the engagement
level of customers during the development and evalu-
ation process of a software analytic project. It is well
recognized that engaging customers is a challenging
task especially in the context of software engineering
tools. Customers always tend to keep their existing
way of carrying out a task or the way of using a ser-
vice. Furthermore, it is usually lacking of investing
time to understand the pros and cons of the proposed
tools due to tight development schedule. Thus, un-
derstanding customer engagement has significant im-
pact on the development of the applications and ser-
vices. By visualisation also predictive analysis, ana-
lytics tool can provide providing effective visualiza-
tion and manipulation of analysis results as well as
predict the engagement level which helps the evalua-
tion of the applications and services.
3.4 Discovering User Behavior Patterns
In order to understand user behavior, descriptive
statistics, e.g., mean, total, standard variation, most
frequent value, etc., are typically used to obtain mean-
ingful insights such as the basic behaviors of the
users. These information can be also used to classify
the user based on the correlation and demographic
similarities among them. In order to understand the
patterns from user behavior, we propose to exploit all
of the usage data from multiple layers of the cloud
environment, usage data of a cloud-based application
is spread across front-end interfaces (web-browser,
smart phone app/client and command-line interface)
and the back-end (server instance and database in-
stance) in a cloud environment (Kesavulu et al., 2017)
and formulate as the transition states of a graph. This
type of graph can be used to mine execution patterns
and to model relationships among different user be-
havior patterns. This kind of approach can also be
used to discover some problems under some specific
context. To discover these contextual factors, we pro-
pose to use the decision trees to learn the conditions,
which allows us to determine any possible connec-
tions between the contexts and change in behavior of
the user.
It is worth noting that these usage data poten-
tially can be exploited in situation-emotional analyt-
ics (M
¨
artin et al., 2017), which aims at recognizing
the emotions and changes of software situations in or-
der to improve the quality and user experience levels.
These emotional information are now extracted via
external biometric recording devices, e.g., recording
devices that record the eye and gaze-tracking signal.
We firmly believe that, usage information at the appli-
cation levels, will be very useful for this type of learn-
ing and potentially can replace eye and gaze-tracking
information.
3.5 Evaluations and Validations
Evaluation itself is a challenge in usage analytics. For
example, if an analytical solution provides some in-
formation about the user satisfaction, it is non-trivial
to evaluate if that information shows the real “pic-
ture” of how user satisfaction can be achieved. Tra-
ditionally, we need to run some surveys and/or inter-
views with the actual users to evaluate results from
the analytical solutions. Another way is to ask some
domain experts to evaluate the proposed solutions.
Usage Analytics: Research Directions to Discover Insights from Cloud-based Applications
259

This method, however, is also costly and very sub-
jective. In this study, we propose a novel way for the
evaluation by using another type usage information,
gathering from the snapshots of the users’ device, the
screen-shots of the interfaces used to access the appli-
cation. By collecting these information (in the testing
phase), we can provide users with the ability to recall
and re-access their previous computer usage and the
content they engage with.
4 REALISING THE POTENTIALS
We firmly believe that usage analytics will very soon
be a phenomenon in anyone working on cloud-based
environment, and will positively impact on everyone
who uses the technology. In this section, we point out
the potential applications as well as possible research
challenges and projects on usage analytics.
4.1 Potential Applications
In our vision, usage analytics opens up a new
paradigm of opportunities, namely:
• Enhancing Productivity without Running
Never-ending Surveys. Most of companies run
surveys and collecting feedback from customers to
know how their services being used. This is costly
and time-consuming. With usage analytics, these
information can be obtained almost in real-time,
and even better, more reliable. Given a set of usage
data from different users over time (historical
usage data), how they use the applications, what
could make errors, how much resources should be
allocated, and so on can be provided.
• A Greater Knowledge of the System. Usage an-
alytics can discover hidden user behavior patterns,
providing information which would go unnoticed.
They can identify trends and patterns from their
customers as well as their own systems, allowing
better services with less expensive resources.
• Improving the Services and the Architecture Be-
hind Them. Traditionally, software and cloud-
based applications are upgraded as an increasing
of their versions, which requires a lot of time for
collecting customers’ feedback and system diagno-
sis results. By using usage analytics, this process
can be simplified and the services potentially can
be constantly update, seamlessly and reliably.
4.2 Possible Research Challenges and
Projects
Usage analytics comes also with challenges and op-
portunities for researchers. It is important that the re-
search community helps to address the challenges in
this emerging and important field. We cannot easily
apply our existing analytics methods on this type of
data and hope for success. Therefore we need specific
approaches addressing the specific challenges. As a
first way-point for researchers we are proposing dif-
ferent research topics and research questions.
• How Can We Identify and Extract Important
Information from the Usage Data? Deciding
what should be extracted from the data that is im-
portant is a nontrivial task. Going beyond stan-
dard analysis like predicting some satisfaction level
will be important, forcing researchers to think cre-
atively and go beyond simple analysis. Many re-
search questions arises, such as, how to combine
information from different raw usage data, or how
to efficiently process the data. Also an important
part here is to explore how context and situations
can be taken into account to improve the quality of
the analysis.
• How Can We Present the Results to the User,
i.e., the Company? Reporting the results to the
users is one of the most important parts of the anal-
ysis of this data. Nevertheless, this is not trivial
since the amount of data and information that can
be extracted is huge. It will be important to re-
search novel interfaces that allow users easily get-
ting the root causes of the errors or understand-
ing the engagement of their customers. Generating
summaries and automatic reports will be another
topic that is important for this data since there will
be a need from the user side for such summaries
with respect to, for example, weekly report from
the whole systems.
• How Can Information and Usage Data Be Pro-
cessed Efficiently? Systems that have to process
a huge amount of data in a complex way have to
be efficient to make them useful to the users. This
comes with challenges for researchers in terms of
how to parallelize and process data efficiently in a
reasonable amount of time, how to combine differ-
ent research fields, from software analytics to ma-
chine learning, together.
The potential for usage analytics is enormous. We
do acknowledge that there are challenges to be over-
come, such as finding the right analytics techniques,
synchronization, data extraction, and the development
of a new generation of analytics tools on usage data,
SMARTGREENS 2018 - 7th International Conference on Smart Cities and Green ICT Systems
260

but we believe that these will be overcome and that we
are on the cusp of a positive turning point for cloud-
based applications community.
5 CONCLUSIONS
We presented the challenges in getting insights from
cloud based applications. We pointed out that ana-
lytical solutions on usage data, namely usage analyt-
ics, can help to overcome these challenges. A com-
plete picture of how to apply usage analytics to get
insights from the cloud-based applications and ser-
vices is shown and discussed. Some potential applica-
tions were also addressed. Our future work aims (i) at
designing and developing methods/techniques to col-
lect, extract and/or aggregate the usage-data from Ap-
plications, VMs hosting the application and the cloud
system hosting the VMs; (ii) to develop an experi-
ment to evaluate the usage data extraction and analy-
sis methods.
ACKNOWLEDGEMENTS
This work was supported with the financial support
of the Science Foundation Ireland grant 13/RC/2094
and co-funded under the European Regional Develop-
ment Fund through the Southern & Eastern Regional
Operational Programme to Lero - the Irish Software
Research Centre (www.lero.ie).
REFERENCES
Aceto, G., Botta, A., de Donato, W., and Pescap, A. (2012).
Cloud monitoring: Definitions, issues and future di-
rections. In IEEE International Conference on Cloud
Networking (CLOUDNET), pages 63–67.
Bezemer, C.-P., Zaidman, A., Platzbeecker, B., Hurkmans,
T., and Hart, A. . (2010). Enabling multi-tenancy: An
industrial experience report. In IEEE International
Conference on Software Maintenance, pages 1–8.
Bucklin, R. E. and Sismeiro, C. (2009). Click here for
internet insight: Advances in clickstream data anal-
ysis in marketing. Journal of Interactive Marketing,
23(1):35–48.
Dyckhoff, A. L., Zielke, D., B
¨
ultmann, M., Chatti, M. A.,
and Schroeder, U. (2012). Design and implementa-
tion of a learning analytics toolkit for teachers. Edu-
cational Technology and Society, 15(3):58–76.
Fu, Q., Lou, J.-G., Lin, Q., Ding, R., Zhang, D., and Xie,
T. (2013). Contextual analysis of program logs for
understanding system behaviors. Proceedings of the
10th Working Conference on Mining Software Repos-
itories, pages 397–400.
Ganter, B. and Wille, R. (1997). Formal Concept Analy-
sis: Mathematical Foundations. Springer-Verlag New
York, Inc., Secaucus, NJ, USA, 1st edition.
Gasparetti, F. (2016). Modeling user interests from web
browsing activities. Data Mining and Knowledge Dis-
covery, 31(2):1–46.
Jehangiri, A. I., Yaqub, E., and Yahyapour, R. (2013). Prac-
tical aspects for effective monitoring of slas in cloud
computing and virtual platforms. In International
Conference on Cloud Computing and Services Sci-
ence, pages 447–454.
Kabbedijk, J., Bezemer, C.-P., Jansen, S., and Zaidman, A.
(2015). Defining multi-tenancy: A systematic map-
ping study on the academic and the industrial perspec-
tive. Journal of Systems and Software, 100:139–148.
Kesavulu, M., Dang-Nguyen, D.-T., Helfert, M., and
Bezbradica, M. (2018). An Overview of User-level
Usage Monitoring in Cloud Environment. In The UK
Academy for Information Systems (UKAIS).
Kesavulu, M., Helfert, M., and Bezbradica, M. (2017). A
Usage-based Data Extraction Framework for Cloud-
Based Application - An Human-Computer Interac-
tion approach. In International Conference on
Computer-Human Interaction Research and Applica-
tions (CHIRA), Madeira, Portugal.
Kumar, A., Sung, M., Xu, J. J., and Wang, J. (2004). Data
streaming algorithms for efficient and accurate esti-
mation of flow size distribution. SIGMETRICS Per-
form. Eval. Rev., 32(1):177–188.
M
¨
artin, C., Herdin, C., and Engel, J. (2017). Model-
based User-Interface Adaptation by Exploiting Sit-
uations, Emotions and Software Patterns. Interna-
tional Conference on Computer-Human Interaction
Research and Applications.
Mell, P. and Grance, T. (2011). The NIST definition of
cloud computing. NIST Special Publication, 145:7.
Pachidi, S., Spruit, M., and Van De Weerd, I. (2014).
Understanding users’ behavior with software opera-
tion data mining. Computers in Human Behavior,
30(January):583–594.
Sun, X. (2016). Virtual Machine Optimizations Us-
ing Markov Chain Data Analytics in Heterogeneous
Cloud Computing. In International Conference on
Smart Cloud, pages 248–253.
Sun, X., Gao, B., Fan, L., and An, W. (2012). A cost-
effective approach to delivering analytics as a service.
In International Conference on Web Services, pages
512–519.
Wang, C., Schwan, K., Talwar, V., Eisenhauer, G., Hu, L.,
and Wolf, M. (2011). A flexible architecture integrat-
ing monitoring and analytics for managing large-scale
data centers. ACM International Conference on Auto-
nomic Computing, page 141.
Wang, G., Zhang, X., Tang, S., Zheng, H., and Zhao, B. Y.
(2016). Unsupervised Clickstream Clustering for User
Behavior Analysis. Proceedings of the 2016 CHI Con-
ference on Human Factors in Computing Systems -
CHI ’16, pages 225–236.
Zhang, D., Dang, Y., Lou, J.-G., Han, S., Zhang, H., and
Xie, T. (2011). Software analytics as a learning case
in practice. Proceedings of the International Work-
shop on Machine Learning Technologies in Software
Engineering - MALETS ’11, pages 55–58.
Usage Analytics: Research Directions to Discover Insights from Cloud-based Applications
261
