
Measuring Happyiness and Wellbeing in Smart Cities
Lisbon Case Study
Joana Branco Gomes, João Sousa Rego and Miguel de Castro Neto
NOVA Information Management School (NOVA IMS), Universidade Nova de Lisboa,
Campus de Campolide, 1070-312 Lisboa, Portugal
Keywords: Quality of Life, Human Smart City, Urban Data, Data Visualization, Dashboards.
Abstract: This paper presents the results of a data analysis on Lisbon rates of happiness and wellbeing as a measure of
smart cities. To analyse this issue we collected, respectively, objective and subjective data from an open portal
data website and a survey of subjective data filed by the citizens, represented at parish level, using a ranking
of 1 to 5. The 52 datasets of objective and subjective data supported the production of a dashboard at parish
level. The parishes with high performances (Avenidas Novas, Misericórdia, Santo António and S. Vicente)
are all in the centre of the city. One of the possible conclusions is that there is a cluster of higher values in the
city centre, that could be explain for economic reasons and also because to the proximity to city facilities.
1 INTRODUCTION
In recent years, happiness and wellbeing are being
used as a primary indicator of quality of human life
and development. Since 2012, aligned with the UN
and OCED a World Happiness Report (Helliwell, et
al., 2017) has been published with echoes in
government meetings and policies implemented.
Happiness and wellbeing are nowadays
considered a measure of social progress and a goal of
public policy. This information can be used by
governments, communities and organizations, to
enable policies that support better lives. By analysing
several indicators like income, education, health,
among others, it’s possible to have a better inside of
communities welfare, that analysing these indicators
individually.
In February 2017, the United Arab Emirates held
a full-day World Happiness meeting, as part of the
World Government Summit. Now International Day
of Happiness, March 20th, provides a focal point for
events spreading the influence of global happiness
research. The launch of this report at the United
Nations on International Day of Happiness is to be
preceded by a World Happiness Summit in Miami,
and followed by a three-day meeting on happiness
research and policy at Erasmus University in
Rotterdam.
1
OECD Better Life Index - www.oecdbetterlifeindex.org
Nevertheless, happiness and well-being are a
subjective and complex concept to calculate. There
are several possible methods and data samples to
measure it. Some data is objective, like
unemployment rate, distance from services, scholar
dropout rate, … Other subjective like the perceived
education conditions (that can by higher or lower than
the actual education conditions). There are several
ways of measuring. OECD
1
, Eurostat
2
, and World
happiness report (Helliwell, et al., 2017) use different
ways of measuring and divide happiness and well-
being in different categories.
Besides the challenge of calculate subjective data,
there is a technological challenge of keep the data
actual, meanful, and useful in an automatic way.
1.1 City of Lisbon Case Study
Most research on happiness and wellbeing are
country oriented. The World Happiness Report
7
analysis indicators such as: Log GDP per capita,
Social support, Healthy life expectancy at birth, and
adaptation, Freedom to make life choices, Generosity,
Perceptions of corruption. The results are analysed by
the governments and most measure / public policies
taken into places are introduced as a Smart
Government measure. Such as the creation of
2
Eurobarameter – Quality of life in European cities -
ec.europa.eu/regional_policy/sources
270
Branco Gomes, J., Sousa Rego, J. and Castro Neto, M.
Measuring Happyiness and Wellbeing in Smart Cities.
DOI: 10.5220/0006771102700277
In Proceedings of the 7th International Conference on Smart Cities and Green ICT Systems (SMARTGREENS 2018), pages 270-277
ISBN: 978-989-758-292-9
Copyright
c
2019 by SCITEPRESS – Science and Technology Publications, Lda. All rights reserved
websites, portals with public information or digital
services.
In recent years, a growing number of city
governments have been getting into the game of
Happiness and Wellbeing measure. In 2016 In the
European Commission dropped its yearly Flash
Eurobarometer of quality of life in European cities
2
, a
huge survey of how happy people in hundreds of
cities across Europe are.
The Urban Europe — statistics on cities, towns
and suburbs defines smart cities as a Urban Europe —
statistics on cities, towns and suburbs. In this index,
where Portugal stands in the middle of the boar,
capitals have a clear lead.
Lisbon, as the main city in Portugal, should be
analysed as a smart city that promotes happiness and
wellbeing index.
In this paper, we analysed the city of Lisbon with
data collected from open data platforms and a survey
made by the authors in May 2017.
The data was first analysed with a geographic
information system (ARC GIS) and then visualized
using a dashboarding software (Power BI software).
The objectives of this case study are:
Create a model to evaluate or Test a
model, usign a mix model from OECD
Beter Life Index 1 and the quality of life
in European cities
2
parameters
Identify the parish and categories with
lower and higher performances
Compare the self-reported results
(subjective data) and objective resuts.
Identify the most important categories
for the citizens
Create a hapiness map
Create an interective hapiness index
The challenge of this paper is collect the data, that
is not available, updated and open. This challenge is
strongly related to open data policies in Portugal.
2 DATA SOURCES
Concerning the objective data of geographic nature it
was imported from the municipality of Lisboa open
data portal
3
. The no geographic (statistical data) was
retrieved from Instituto Nacional de Estatísitca
4
and
Eleições – Secretaria Geral da administração interna
5
and introduced by parish.
The subjective data was collected from a survey
launch online, and answered by 67 individuals (43
3
Open Data Arc Gis Dataset –
opendata.arcgis.com/datasets/CML
female and 24 male), during 2 weeks in May of 2017.
The age of the persons inquired was mainly between
26-35 (44%) and 36-45 (29%).
This survey has divided in 4 phases. First the
identification (sex, age and postal code); Second the
definition of happiness (select the topics more
important for the personal happiness); Third the city
conditions (9 questions), where the inquires answer
from bad to good in a scale of 1to 5; and Foutrh the
personal life quality (10 questions) where the answer
were also from a scale from 1 to 5.
Both objective and subjective data collected was
introduced in a geographic information system (in
this case ARC MAP), at the parish level.
The data was divided into 11 categories,
according the OECD Better Life Index
1
and quality of
life in European cities
2
.
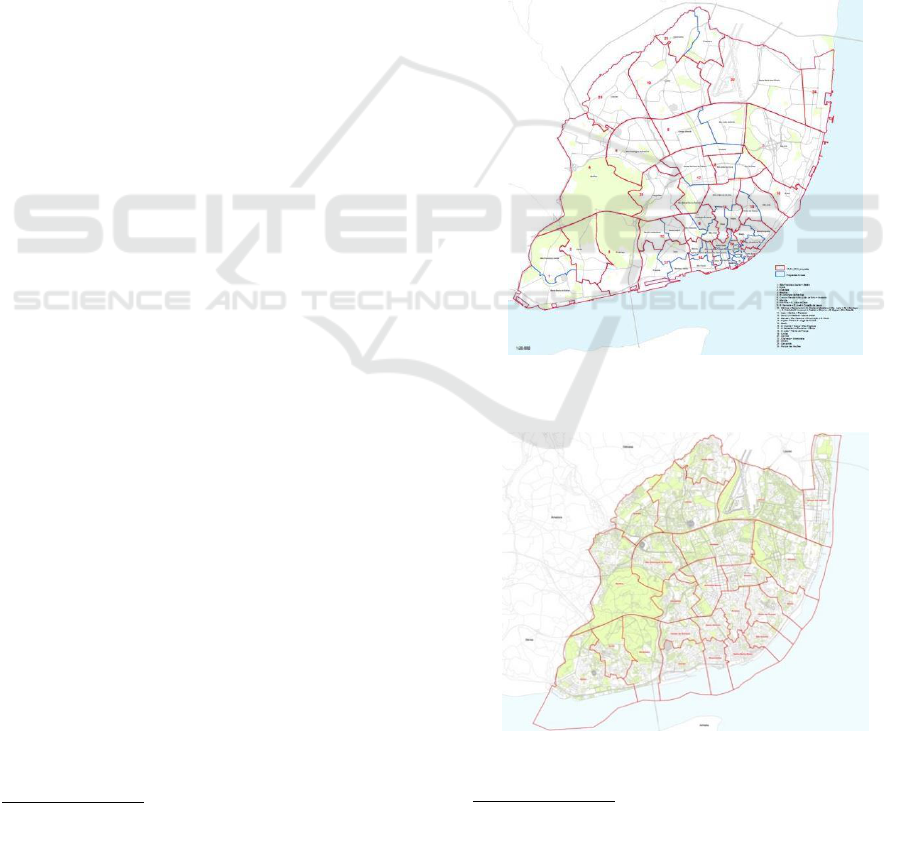
Figure 1: Old Parish of Lisbon – image from the official
CML website.
Figure 2: Current Parish of Lisbon – image from the official
CML website.
4
INE – Instituto Nacional de Estatística – www.ine.pt
5
www.eleicoes.mai.gov.pt
Measuring Happyiness and Wellbeing in Smart Cities
271

Table1: Categories and data.
CATEGORY
MEASURE
OBJECTIVE DATA
SUBJECTIVE DATA
Housing
Housing spending’s
(€/parish)
Overlapping houses
(%/parish)
Self-reported housing
conditions
Jobs
Unemployment rate
(%/parish)
Income
Income / Job security
Education
Distance to public
schools
Illiteracy (%/parish)
Scholar dropout
(%/parish)
Self-reported
education conditions
Health
Distance from public
hospitals and health
centres
Self-reported health
Environment
Self-reported
environment quality
Self-reported cleaning
conditions
Safety
Self-reported safety
outside home
Community
Trust in people
Civic engagement
Voters percentage
(%/parish)
Trust in government /
city hall
Trust in public
services
Work-life balance
Distance to subway and
trains stops
Distance from
commercial areas
Distance from sports
facilities
Distance from
playgrounds
Distance from cultural
facilities
Distance from a green
area
Building degradation
(%/parish)
Working hours
Time devoted to
leisure
City infrastructure
Self-reported public
transport quality
Self-reported sports
facilities quality
Self-reported cultural
facilities quality
Self-reported green
areas and leisure parks
quality
Self-reported streets,
buildings, and public
spaces conditions
Use of green, cultural
and leisure spaces
In 2015 the city of Lisbon create a new map of the
city, redefining the parishes, and decentralization
competences. The parishes pass from 53 to 24. Since
the data collected for this paper refers to data prior
and after 2015, it was used the old parishes limits,
with 53 parishes + 1 (Parque das Nações), the only
new parish created in 2015.
This paper also should considerer social media
data mining in order to find how people feel regarding
some subjects and also regarding their lives.
3 DATA ANALYSIS
The data (52 datasets of both objective and subjective
data) was introduced in a geographical information
system (ARC GIS) in order to relate and compare the
data using geoprocessing capabilities. The
representation of the results was made using ARC
GIS for mapping purposes and Power BI for
dashboarding.
To compare datasets from the same category
different representations were used on ARC GIS. The
distance to facilities was created using a buffer
according the values defined by Adrian Pitts in
Planning and design strategies for sustainability and
profit: pragmatic sustainable design on building and
urban scales (Pitts, A., 2004) (on education - 300m
for pre-scholar, 1,5km for 1º and 2º grades and 3km
for 3º and high school; On health 1km for health
centres and 2km for hospitals; For other facilities -
500m for transports, 600m for green areas and
playgrounds, 2km for sports facilities and 2,5km for
culture and commerce).
Regarding the subjective data the correlation was
made by creating and normalizing values, by parish.
It’s possible to identify:
There is a correlation between house
spending’s and housing overlapping (the
houses are cheaper in parish where we have
more houses with excess of people). This
could be explained by social-economic
factors.
There is a clear need for pre-schools around
the city
The city is almost covered for 1º, 2º and 3º
grade schools.
The area of Monsanto Park isn’t covered in
several facilities buffer, but since is a park
without housing, services or other living
spaces, it wasn’t considered to define the
best and worst performances.
The city centre is well covered of health
facilities, but the peripheral parish no.
The city is well covered for commerce,
cultural and sport facilities.
The public transportation doesn’t cover all
the city, but this paper doesn’t have the bus
SMARTGREENS 2018 - 7th International Conference on Smart Cities and Green ICT Systems
272
network, in this sense, this category is
incomplete.
The Self Reported Security on Job/Income is
the category with most differences of results,
where we can find parishes with the 5
different scores.
Civic Engagement has lower results,
followed by Trust in Community and
Environment.
Work-Life Balance has clearly better
scores. This could be explained because on
this category the best results are the average
score, and people have tendency to not give
the higher and lower score, staying on the
middle. Health and Safety also have higher
scores then the others categories.
3.1 Rates and Performances
The performances rates regarding the categories, the
parishes, the relation between objective and
subjective data among other, is information helpful
for governants and the city hall. With this information
is possible to have measure progress, identify city
problems, support better lives, make better and more
informed managing decisions.
On the geographical information system built it’s
possible to identify and compare the parishes /
categories with higher and lower performances.
These values were defined by finding the difference
between the parish value and the average value of all
parishes. Because all the data has different measures
and scales the value used to define where a parish
performed worst or better in each category was
different. For instant on the education and health, if
the parish has 100% of the area covered by the buffer
the parish performance is Best, if 30% or more of the
parish area is not covered by the buffer is rated Worst.
Regarding subjective data, and since is rated 1 to
5 from the survey, the parish that have a difference of
more than 0,5 or less then -0,5 were classified has
Best or Worst.
3.1.1 Parishes with Higher and Lower
Performances
Looking at the results it’s possible to identify that the
centre has best performs, except on building
degradation. The lower performances are usually on
peripheral parishes.
The parish with lower performances are Carnide,
Beato followed by Ajuda, Alcântara. Marvila, Parque
das Nações and Santa Clara. None of this parish are
in the city centre. The parish with high performances
are Avenidas Novas, Misericórdia, Santo António
and S. Vicente (by order). All of this parish are in the
centre of the city. It’s possible to conclude that there
is a cluster of higher values in the city centre, that
could be explain for economic reasons and also
because to the proximity to city facilities.
This information is represented in ARC MAP (for
work and planning purposes) and Power BI
(dashboard for explaining, correlate, visualize and to
support citizens to understanding).
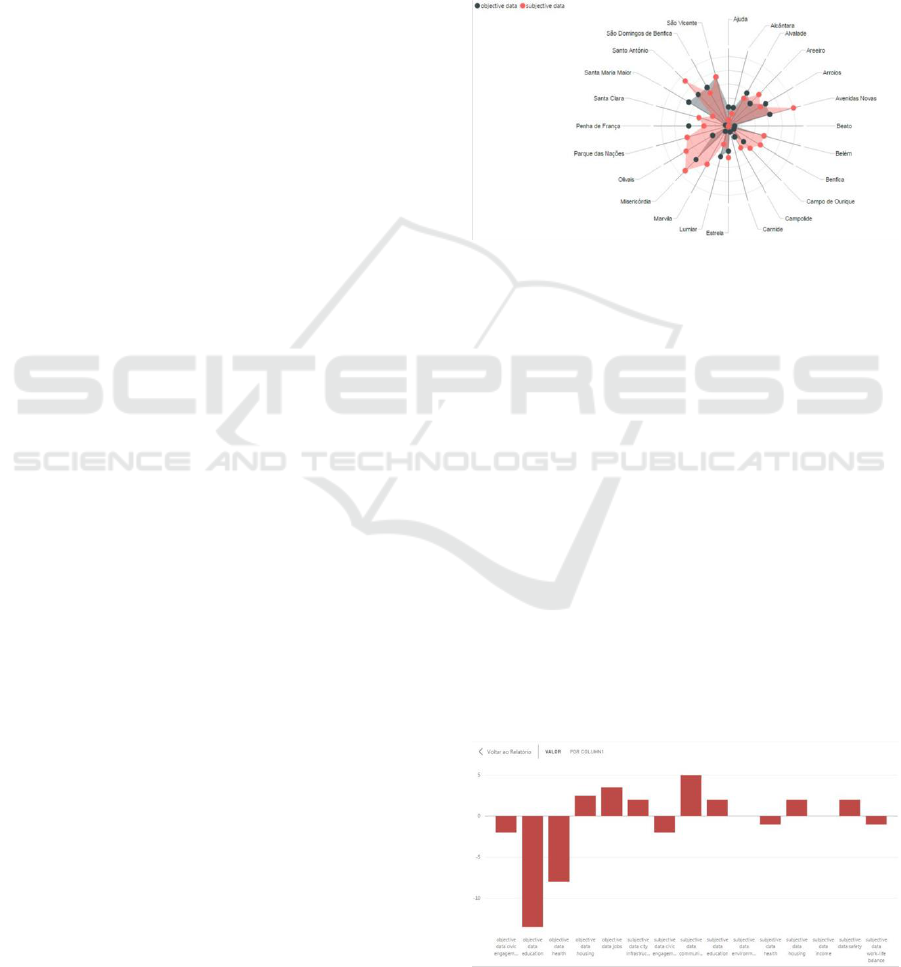
Figure 3: Dashboard - Parishes with best and worst
performances.
3.1.2 Categories with Higher and Lower
Performances
The categories with lower results are Education and
Health, followed by Civic engagement. The
categories with higher results are Community,
Housing and Jobs. It’s possible to conclude that there
is a need to guaranty a more accessibility to health
and education facilities, specially in the parish outside
the city centre. There is also a need to act on the civic
engagement and in the trust in public services and
people.
Most of the categories have differences between
parishes, except City Infrastructure, where the
parishes are balanced between each other. It’s
possible to find clusters of parishes in individual
categories (for example people on the centre feel
more safe them people from peripheral parish).
Figure 4: Categories with higher and lower performances.
Measuring Happyiness and Wellbeing in Smart Cities
273

3.1.3 Self Reported vs Objective Data
It’s important to correlate the self-reported /
sentiment about a category and the objective data of
the same category. This can only be done for
Housing, Education, Health, Civic engagement and
City Infrastructures, because of the lack of available
data. It’s possible to conclude:
On Housing its possible to conclude that the
housing spending’s and the housing
overlapping are not the most important
feature that contribute for the individual
sentiment of happiness regarding housing.
On Education, as opposite, there is a
correlation between objective data and
subjective data. People living on Ajuda,
Alcântara, Beato, Campolide and Carnide
parishes felt more unhappy related to
educations and also have lower
performances in scholar dropout, illiteracy
and area in the parish outside the school
influence ratio. On the other hand people
living in Misericordia and Avenidas Novas,
have higher performance and also fell more
happy about the education conditions.
On Health the people from parishes of
Avenidas Novas, Misericordia, S. António
and S.Vicente with best performances
(closest to health facilities) feel healthy. But
in other hand the parishes of Penha de
França e S. Maria Maior, that also are close
to health facilities, but where people don’t
fell healthy. Since our survey group is
young and mostly healthy is difficult to find
a correlation between this data.
On Civic Engagement there isn’t a
correlation between the voters percentage
and the trust in public services and people.
The same happens in city infrastructure.
It’ possible to conclude that the survey should
have more respondants in order to be more accurate,
as also it should have more people with different ages.
3.1.4 Categories more Important to People
On the survey people were asked to identify the 3
most important categories for their one happiness:
Work-live balance was one of the
categories most important, with 48% of the
inquires choosing this category.
Health with 44%,
Housing with 39%
Income 38%.
The Work-Life Balance is composed by the
average of two questions in the survey: How many
hours a day do you work, and how many hours a day
you spend on leisure and sport. Only 23% of people
answers that work between 4-8h and only 15%
answered they spend 2-4h in leisure and sport. The
percentage of people working more that 8h a day was
72% and spending less then 2h in leisure and sport
was 85%. Its possible to conclude that the target
group works more hours that usually and spend less
hours that it supposed to in leisure. This could be
explained by the age of the group, that are young
people making an effort to grow in their jobs. The
parish more balanced are Carnide, Marvila, Olivais
and Parque das Nações, probably because people on
this neighbourhood have more income, and can afford
to work less hours, and because of the opposite, we
have people precarious part-time jobs that gives them
more time available for leisure. The parishes with
lower performance are Ajuda, Alcântara, Santa Maria
Maior, Santo António e S. Vicente, located on the
center and the ocidental part of town.
Figure 5: Work-life balance performance.
The people inquired rate Health as the second
most important category, but in general they feel very
healthy. This could mean that although they are
healthy (probably because of their young age), they
think there is a need to improve in health care
systems. There are parishes with no access to both
health centres and hospitals: Beato, Benfica, Marvila,
Olivais, Parque das Nações and Santa Clara. This
parishes are not located on the city centre, and there
is a predominance of parishes in the occidental part of
town.
SMARTGREENS 2018 - 7th International Conference on Smart Cities and Green ICT Systems
274
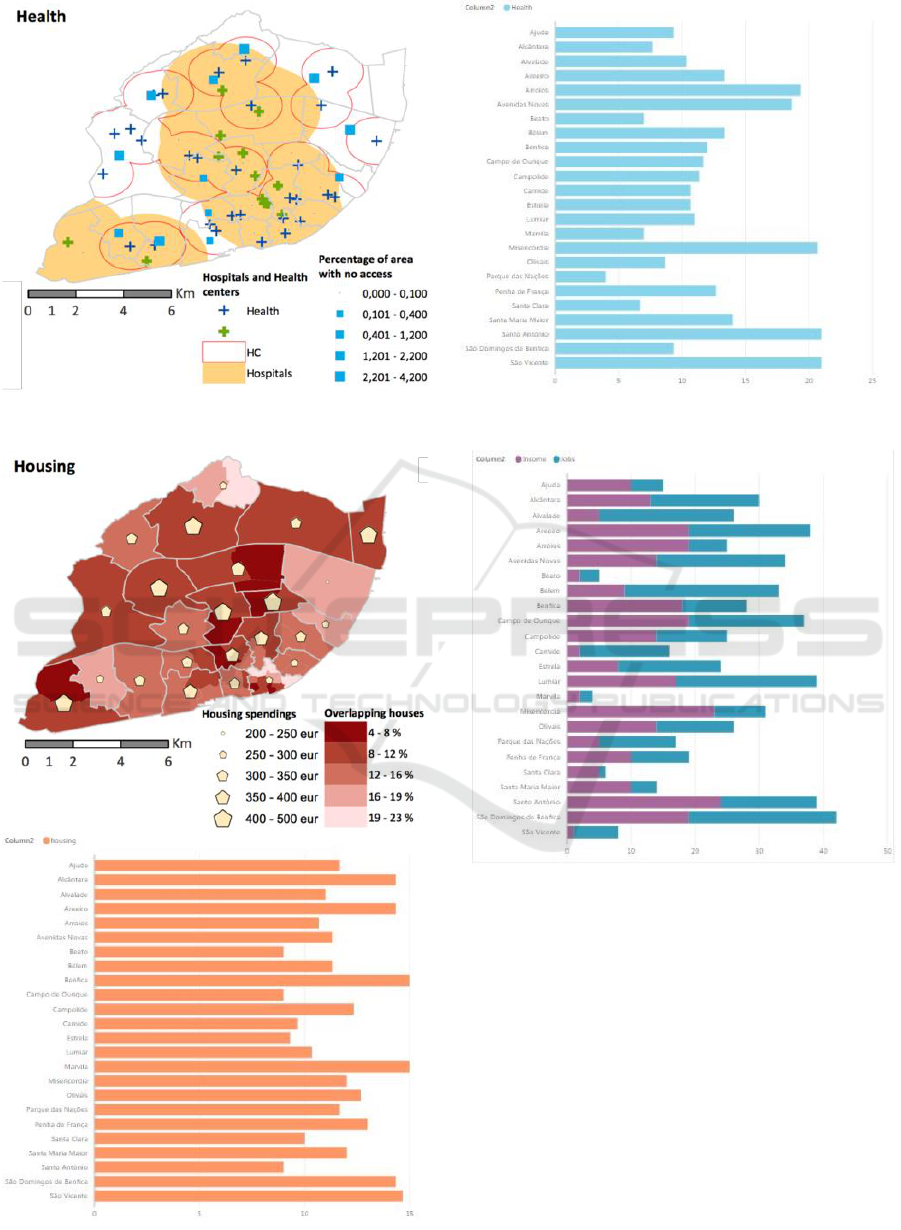
Figure 6: Health performance.
Figure 7: Housing performance.
Figure 8: Income / Jobs performance.
Regarding to housing people feel the housing
conditions are good, but we identify some parish with
overlapping housing conditions, that perform well
regarding the housing spending’s. This is correlated
with lower income groups and social
neighbourhoods.
Income / Jobs is the last category with relevant
value to be analysed in detail. The Unemployment
Rate and also the Security in Their Jobs is lower in
parish with lower income groups. Its possible to find
a relation in most of the parish between jobs and
income, that means people that live in parishes with
low unemployment rate, feel more secure about their
income.
Measuring Happyiness and Wellbeing in Smart Cities
275
3.2 Happiness Map
The happiness map that results from this work can be
seen as a tool for governments, city halls, and also the
citizens by representing all the information collected
(subjective and objective).
This map takes into consideration the categories
that are more important to people. The data was
related by a ranking system by dataset, in order to
compare the several datasets, with different scales
and information’s.
The results in warm colours represent higher
rankings and with cold colours low ranks. It’s
possible to identify that the centre performed better,
and the north and east parts of city performed worst.
These could be explained by social economical
motives as well as the distance to city facilities.
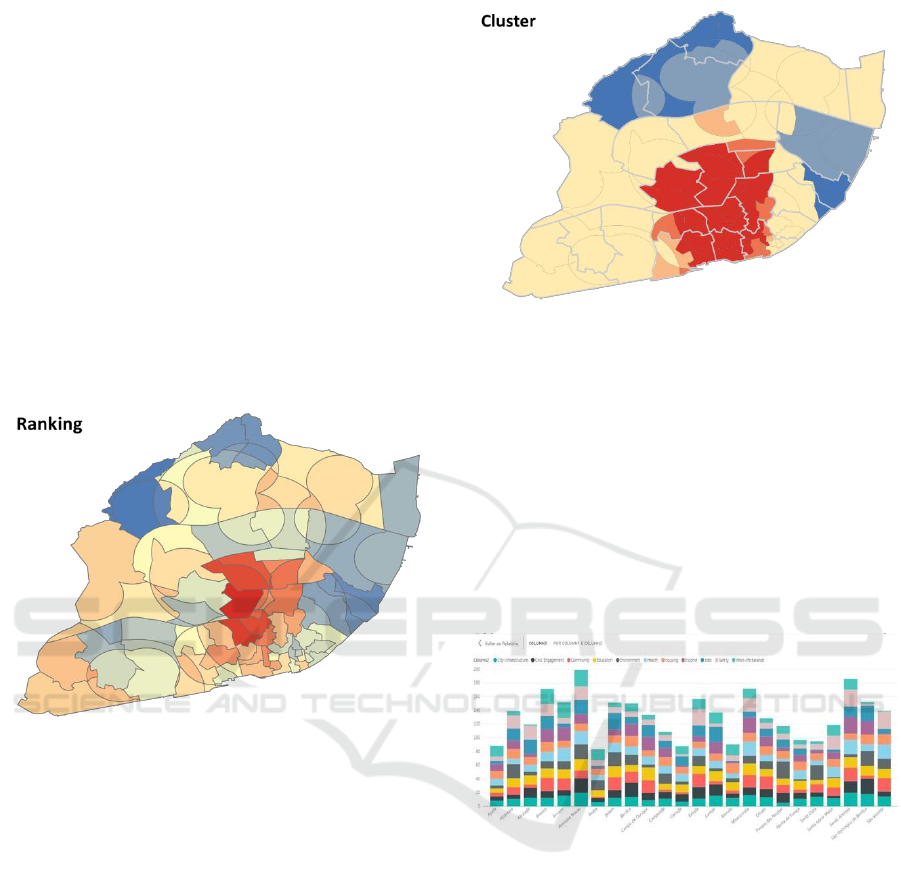
Figure 9: Happiness map.
Clustering the results it’s possible to identify more
clearly the areas in the city, were is necessary to
invest and reduce the difference of happiness and
wellbeing among the citizens:
The city centre with higher performances
The parishes of Charneca, Ameixoeira,
Lumiar and Carnide at the north of the city
The parishes of Marvila, Beato e São João,
to the east of the city.
Figure 10: Happiness map.
3.3 Happiness Index
To provide some added value to the project an
happiness index was created. This index is a tool
meant to be used by the citizen in order to allow them
to create their one happiness dashboards / maps
according to the categories that are more important to
them. This tool could be made available on public
municipal platforms, allowing the citizen to choose
the parish that suits more his personal needs, in order
to achieve higher personal happiness and well-being.
Figure 11: Interactive Index.
Furthermore, this tool allows for the user to
specify which are the variables that he values the most
(subjective and objective) and the results will adjust
automatically.
4 CONCLUSIONS
This project can benefit the city hall, politicians and
decision makers, making the city smarter, happier,
and with less inequality. It also benefits the citizens
since they can access a dashboard simple do
understand and visualize, making their life decisions
easier (example choosing a place to live).
SMARTGREENS 2018 - 7th International Conference on Smart Cities and Green ICT Systems
276

The city centre has the parish with higher
performances, and the parish of Beato, Carnide and
Ajuda are the parish with lower performance.
This study suggest an investment on:
Children facilities: pre-schools and
playgrounds around the city
Primary health care centres (centros de saúde).
Investment on city infrastructures in the
parishes of Carnide, Santa Clara, Beato,
Marvila and Ajuda.
The open data provided by the municipality of
Lisbon demonstrated the enormous potential in its
use, both in the evaluation of public policies and in
the development of solutions for valuing certain
neighbourhoods or even the real estate sector.
However the study allowed to identify at least 50
datasets were required to achieve higher quality
precluding its use in its fullness. Regarding the
survey, some fragilities were identified in the sample
of the answers collected, it would be benefit to have
more answers and also to a more diverse group (about
age, sex and income).
The development of this study would make sense
through a partnership with the municipality, allowing
full access to all information and providing solutions
for the use of open municipal data. In this way a
greater approximation between the released data and
the users of the data is promoted.
This paper will also benefit with data mining
sentiment analysis, besides the surveys.
Finally this study will also benefit if collecting the
data, processing and storing was done in a dynamic
and automatic way.
REFERENCES
Pitts, A., 2004. Planning and design strategies for
sustainability and profit: pragmatic sustainable design
on building and urban scales. Elsevier.
Helliwell, J., Layard, R., Sachs, J. 2017. World Happiness
Report 2017, New York: Sustainable Development
Solutions Network.
Ortiz-Ospina, E., Roser, M., 2013. Happiness and Life
Satisfaction, Rotterdam: Worls Database of Happiness.
Deaton, A., Eisenhower, D., 2014. Using happiness data in
policy making.
Tabor, D., Stockley, L., 2017. Personal Well-being in the
UK.
Veenhoven, R., Rotterdam: World Database of Happiness.
ArcGis – Open Data
J. Sterne, 2010, Social Media Metrics: How to Measure and
Optimize Your Marketing Investment.
Measuring Happyiness and Wellbeing in Smart Cities
277
