
SPIRI: Low Power IoT Solution for Monitoring Indoor Air Quality
John Esquiagola, Matheus Manini, Arthur Aikawa, Leopoldo Yoshioka and Marcelo Zuffo
Electronic Systems Department, Sao Paulo University, Sao Paulo, Brazil
Omni-Electronica Ltda, Sao Paulo, Brazil
Keywords:
Internet of Things, Smart Buildings, Indoor Air Quality.
Abstract:
Annually, millions of people worldwide die prematurely as a consequence of air pollution. Many of these
deaths occur in large cities, where exhaust from cars, factories, and power plants fills the air with hazardous
particles. However, the issue is not only in outdoor areas of the cities because most people spend more than
90% of their time in their houses, offices or cars. Indoor air pollution (IAP) affects human health, safety,
productivity, and comfort. There are some reports about attacking the indoor air quality (IAQ) problem by
utilizing IoT technology, but most solutions are driving the urban environmental problem. This paper presents
the SPIRI platform which proposes to measure IAP using an IoT network of connected sensors that gather and
send important information like temperature, relative humidity, volatile organic compounds (VOC), particulate
matter (PM), among others. Using this data, indoor environments can be mapped, track changes over time,
identify pollutions sources, and analyze potential interventions to reduce the IAP. Initial results of the current
development of our IoT platform to perform the realtime monitoring of the IAP are presented. Hardware
and software are also presented because our solution needs to be aware of the current IoT challenges such as
scalability, security and interoperability. Both 6LoWPAN and IEEE 802.15.4 standards were implemented to
establish the communication between the devices.
1 INTRODUCTION
Air pollution is a critical issue nowadays, millions
people worldwide die each year as a consequence of
air pollution. Many of these deaths occur in large
cities, where exhaust from cars, factories, and power
plants fills the air with hazardous particles (EPA,
2017b). Indoor concentrations of pollutants or indoor
air pollution (IAP) can be higher than outdoor con-
centrations up to five times, due to incorrect func-
tionality coming from Heating, ventilation, and air
conditioning (HVAC) system. People spend a con-
siderable amount of time indoors at home, office or
transportation means. For instance, 4.3 million peo-
ple a year die prematurely due to IAP (WHO, 2017).
Indoor Air Quality (IAQ) can be affected by sev-
eral agents or parameters like temperature, humid-
ity, volatile organic compounds (VOC), particulate
matter (PM), aerosols, etc. There are many reports
that demonstrate insufficient IAQ levels can generate
health problems to building occupants (Zhou et al.,
2017) (De Gennaro et al., 2013). The World Health
Organization (WHO) has published some guidelines
to protect people living in indoor environments. The
report presents the common substances that can be
found and the maximum concentrations to prevent
health risks (Penney D, 2010). The term ”Sick Build-
ing Syndrome” (SBS) has been reported many years
ago and it is used to describe health and comfort
problems related to time spent inside buildings (Joshi,
2008). These complaints can be found in specific ar-
eas or among the whole building. Popular symptoms
of SBS may include itchy, irritated, dry or watery
eyes, nasal congestion, throat soreness, itchy skin,
headache, lethargy, or difficulty concentrating. Some
causes of SBS can be high building temperature, poor
ventilation, high humidity, sealed windows, paints,
coatings, etc. (Guo et al., 2013) (EPA, 2017a). To
avoid such serious consequences of the SBS, an IAQ
monitoring system is utmost required. An IoT net-
work can be a wireless sensor network (WSN) with
several dedicated sensor nodes, which can sense and
monitor the physical parameters and transmit the col-
lected data to a central location using wireless com-
munication technologies. Then, we can take advan-
tage of the IoT technology to save lives and to detect,
analyze and improve indoor environments where the
pollution is a real problem.
In this paper, we present the SPIRI platform, our
IoT solution for monitoring indoor environments. We
focus on the main parameters that determine the pol-
lution inside buildings like offices, hospitals, homes,
schools, etc. We have developed our custom hard-
Esquiagola, J., Manini, M., Aikawa, A., Yoshioka, L. and Zuffo, M.
SPIRI: Low Power IoT Solution for Monitoring Indoor Air Quality.
DOI: 10.5220/0006783002850290
In Proceedings of the 3rd International Conference on Internet of Things, Big Data and Security (IoTBDS 2018), pages 285-290
ISBN: 978-989-758-296-7
Copyright
c
2019 by SCITEPRESS – Science and Technology Publications, Lda. All rights reserved
285
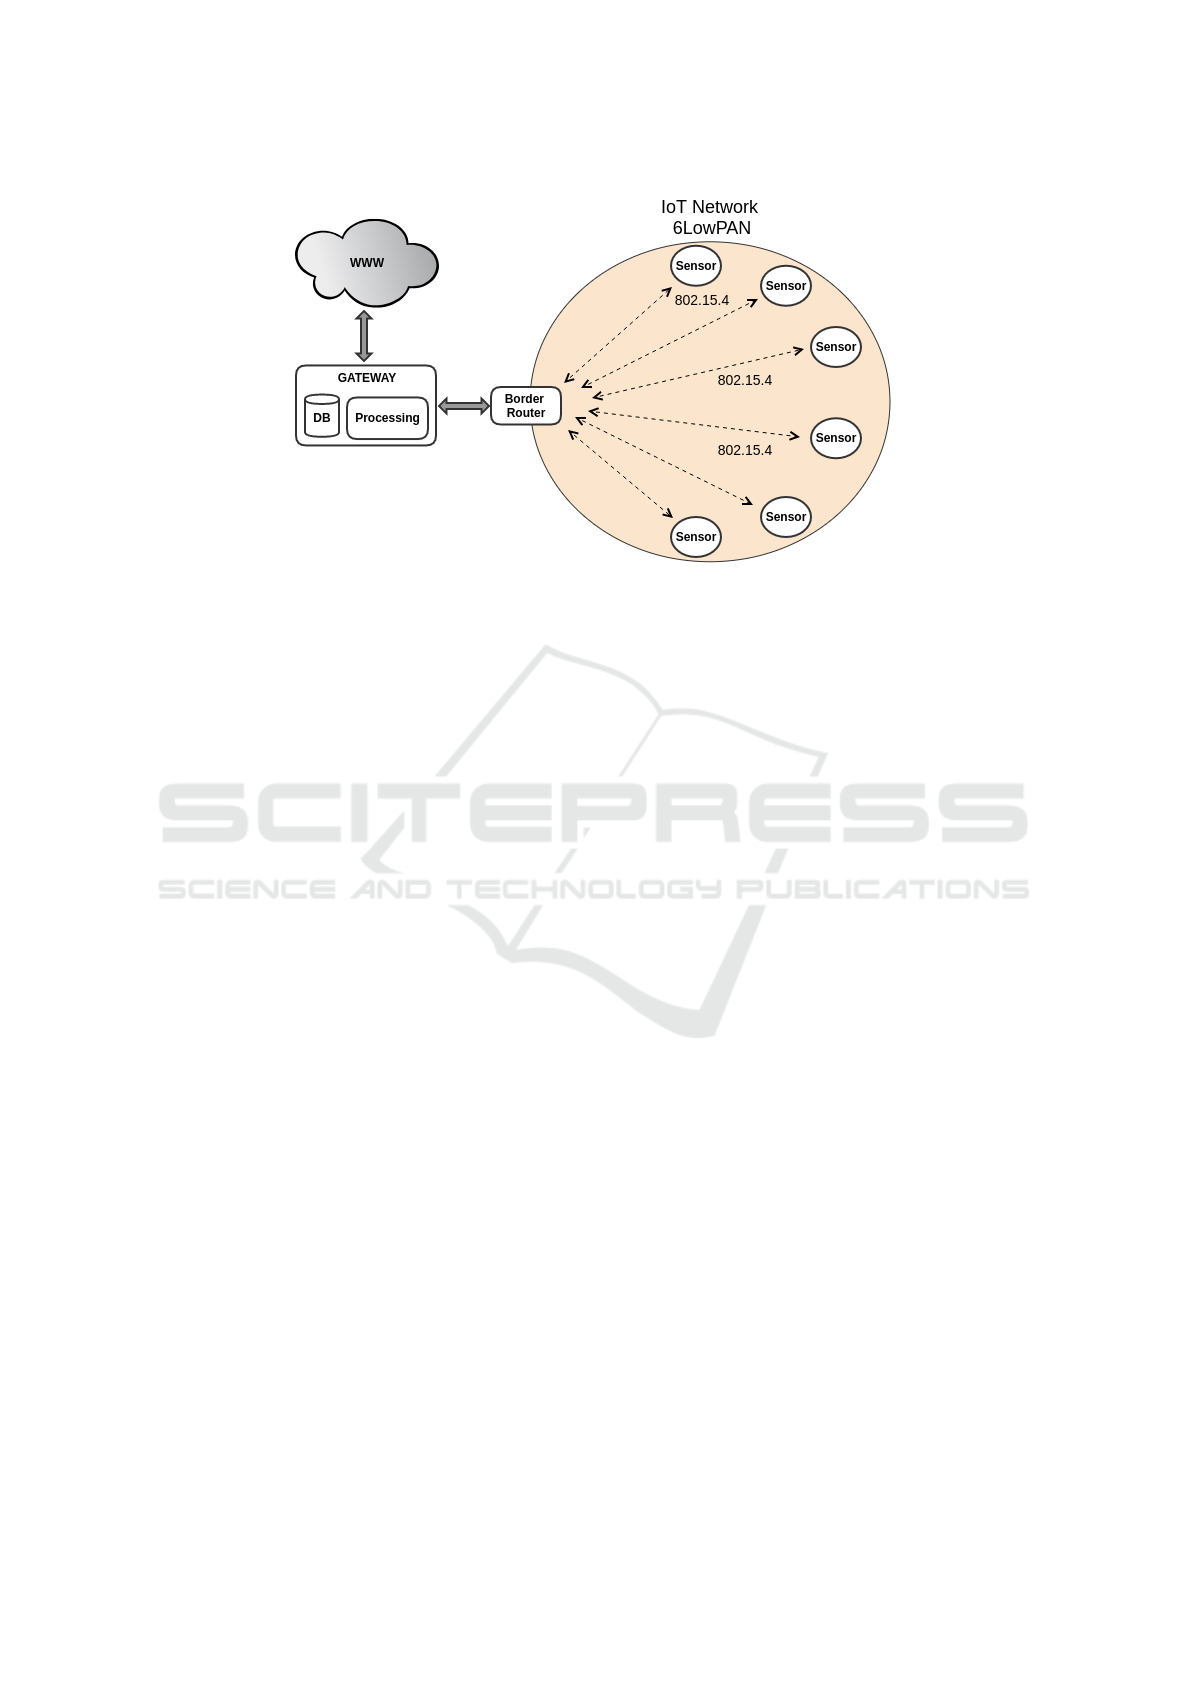
Figure 1: IoT System Architecture.
ware and firmware focusing to drive current IoT chal-
lenges such as scalability and security. The remain-
der of this paper is organized as follows: Section II
presents the related work about IoT solutions for air
quality monitoring. Section III highlights the archi-
tecture overview of our IoT platform. Initial results
and analysis are presented in Section IV. Section V
concludes the paper with final considerations and fu-
ture work.
2 RELATED WORK
In IoT systems, there are lots of applications being
developed by the academic and industry communi-
ties. The heterogeneity of the components of an IoT
solution implies the development of new test meth-
ods and architectures to ensure the performance of the
system and to meet user requirements. A system of
several distributed monitoring stations that communi-
cate wirelessly with a back-end server using machine-
to-machine communication was presented in (Kadri
et al., 2013). This solution collects urban information
from gaseous and meteorological sensors and send
through a wireless sensor network. Data is available
in a web portal and in a mobile application. A real
time wireless air pollution monitoring system is an ef-
fective solution for pollution monitoring using wire-
less sensor networks (WSN) (Prasad et al., 2011). The
solution uses commercially available discrete gas sen-
sors for sensing the concentration of gases like CO
2
,
NO
2
, CO and O
2
. Zigbee technology was used to im-
plement the wireless sensor networks with multihop
data aggregation algorithm. A Smart global Air Qual-
ity Monitoring system is presented by (Mohieddine
et al., 2017). The system employs different technolo-
gies, such as gas sensing, WSN and Smart mobile. It
is a typical case of an IoT application where data is
collected and delivered to a local gateway and data
is displayed via a remote web server. (Lozano et al.,
2012) presents a sensor network for indoor air qual-
ity monitoring. The network consists of a base sta-
tion connected to the internet and several nodes sen-
sors to measure temperature, humidity, light and air
quality. The standard IEEE 802.15.4 (Zig-Bee pro-
tocol) using the XBee module was utilized to per-
form the communication between the nodes and the
host. State-of-the-art solutions are focused on ur-
ban pollution where pollutants are different from the
indoor pollutants. There are some reports covering
the IAP by using IoT networks, but most of these
solutions use Arduino-based hardware and common
IoT issues such as scalability, security and low power
characteristics are not being addressed (Raju et al.,
2013) (Pham et al., 2013).
3 PROPOSED ARCHITECTURE
The proposed IoT IAQ monitoring system was de-
signed and developed to obtain a fine-grain record of
indoor environment conditions. The parameters mon-
itored were chosen, so that the following conditions
could be studied: hygrothermal comfort, IAP and sys-
tem operation optimization. The current sensor node
version is capable of simultaneously monitor temper-
ature, relative humidity, absolute pressure, luminos-
ity, PM, CO
2
and VOC. The architecture of the sys-
tem is shown in Figure 1. The system is composed of
a relatively simple infrastructure composed of sensor
IoTBDS 2018 - 3rd International Conference on Internet of Things, Big Data and Security
286
nodes, a border router and a gateway that pools all the
data acquired by each sensor node. The data is either
passed along the mesh network or sent directly to the
border router which communicates with the gateway.
The gateway then inserts new data points to the data
base which can be stored locally or remotely (cloud
system). The communication between all individuals
of the network is based on the IEEE 802.15.4 speci-
fication (IEEE, 2017). For a facilitated and acceler-
ated deployment, a development board was used to
implement the RF-Transceivers. The LAUNCHXL-
CC2650 SimpleLink
TM
is a low-cost RF-Module with
integrated programmer and debugger.
3.1 Hardware
3.1.1 Gateway
The gateway is an important module of the system
because it performs the interface to Internet, store all
data in a local database and can execute some pre-
processing tasks. For the new IoT paradigm, board
size, power requirements and cost are also critic.
Raspberry Pi Zero W was selected because it pro-
vides reasonable functionalities to execute the gate-
way tasks (Raspberry, 2017), it is also very compact
and easy to configure and maintain. Raspbian linux
was installed and used as a operating system of the
platform. All these features are not available with
other embedded solutions. Finally, it offers a great
scalability factor, for the whole system can be booted
from a Micro SD card, which can be separately repro-
duced.
3.1.2 Border Router
The border router is the interface between the IoT net-
work and the gateway. It serves to maintain the com-
munication between the nodes in case the gateway is
not available. In our platform, the CC2650 System on
Chip (SoC) performs the border router functionality.
Communication is established by utilizing RPL pro-
tocol and a proprietary RF 802.15.4 protocol. Com-
munication to the gateway is accomplished through
an UART interface.
3.1.3 Sensor Nodes
The sensor nodes are designed to incorporate as many
sensors as possible without compromising the valid-
ity of each parameter. A special attention to Low
Power operation was taken to avoid critical tempera-
ture operation points and to evaluate the possibility of
a battery powered device in future works. Each sen-
sor node must have an RF communication interface
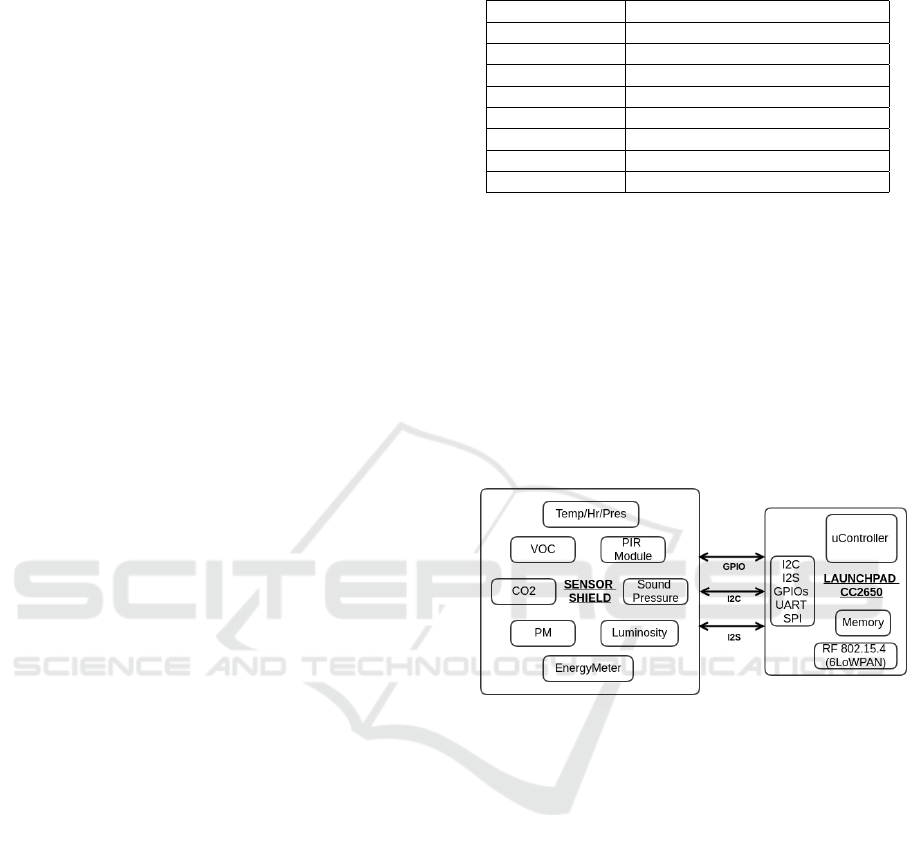
Table 1: SPIRI sensors.
Sensor Description
BME280 Temperature, Humidity , Pressure
CCS811 VOC and eqCO
2
PMS7003I Particulate Material Sensor
CDM7160 CO
2
sensor module
TSL4531 Luminosity sensor
SPH0645LM4H Sound Pressure sensor
Energy Energy meter sensor
PIR Pyroelectric InfraRed Sensor
to send out the acquired data. Thus, the sensor node
was designed as a shield PCB to the development plat-
form described in section 3. A small memory block
of the MCU is reserved to back up a few measure-
ments in case of a lost network signal. Figure 2 shows
a block diagram of the sensor node. The main diffi-
culties faced in this design was to aggregate as many
sensors as possible without compromising the opera-
tion of each one individually. The final hardware is
shown in the figure 3. The sensors deployed in the
shield PCB are presented in Table 1.
Figure 2: Sensor Node Block Diagram.
3.2 Firmware
3.2.1 Contiki OS
To provide stability and the basic functionality to op-
erate the system, the sensor nodes were programmed
with the latest version of the Contiki Operating Sys-
tem (Contiki, 2017). The advantage of using Con-
tiki is the availability of timers, networking and many
other tools developed by the Contiki community. It
allows a quick and effective implementation of the ap-
plication needed. However, Contiki OS only provides
basic functionalities and hardware abstraction. To de-
velop a complete solution, an OSYS framework was
developed locally.
3.2.2 OSYS Framework
OSYS Framework is a hardware and operational sys-
tem abstraction that has only four functions to imple-
SPIRI: Low Power IoT Solution for Monitoring Indoor Air Quality
287
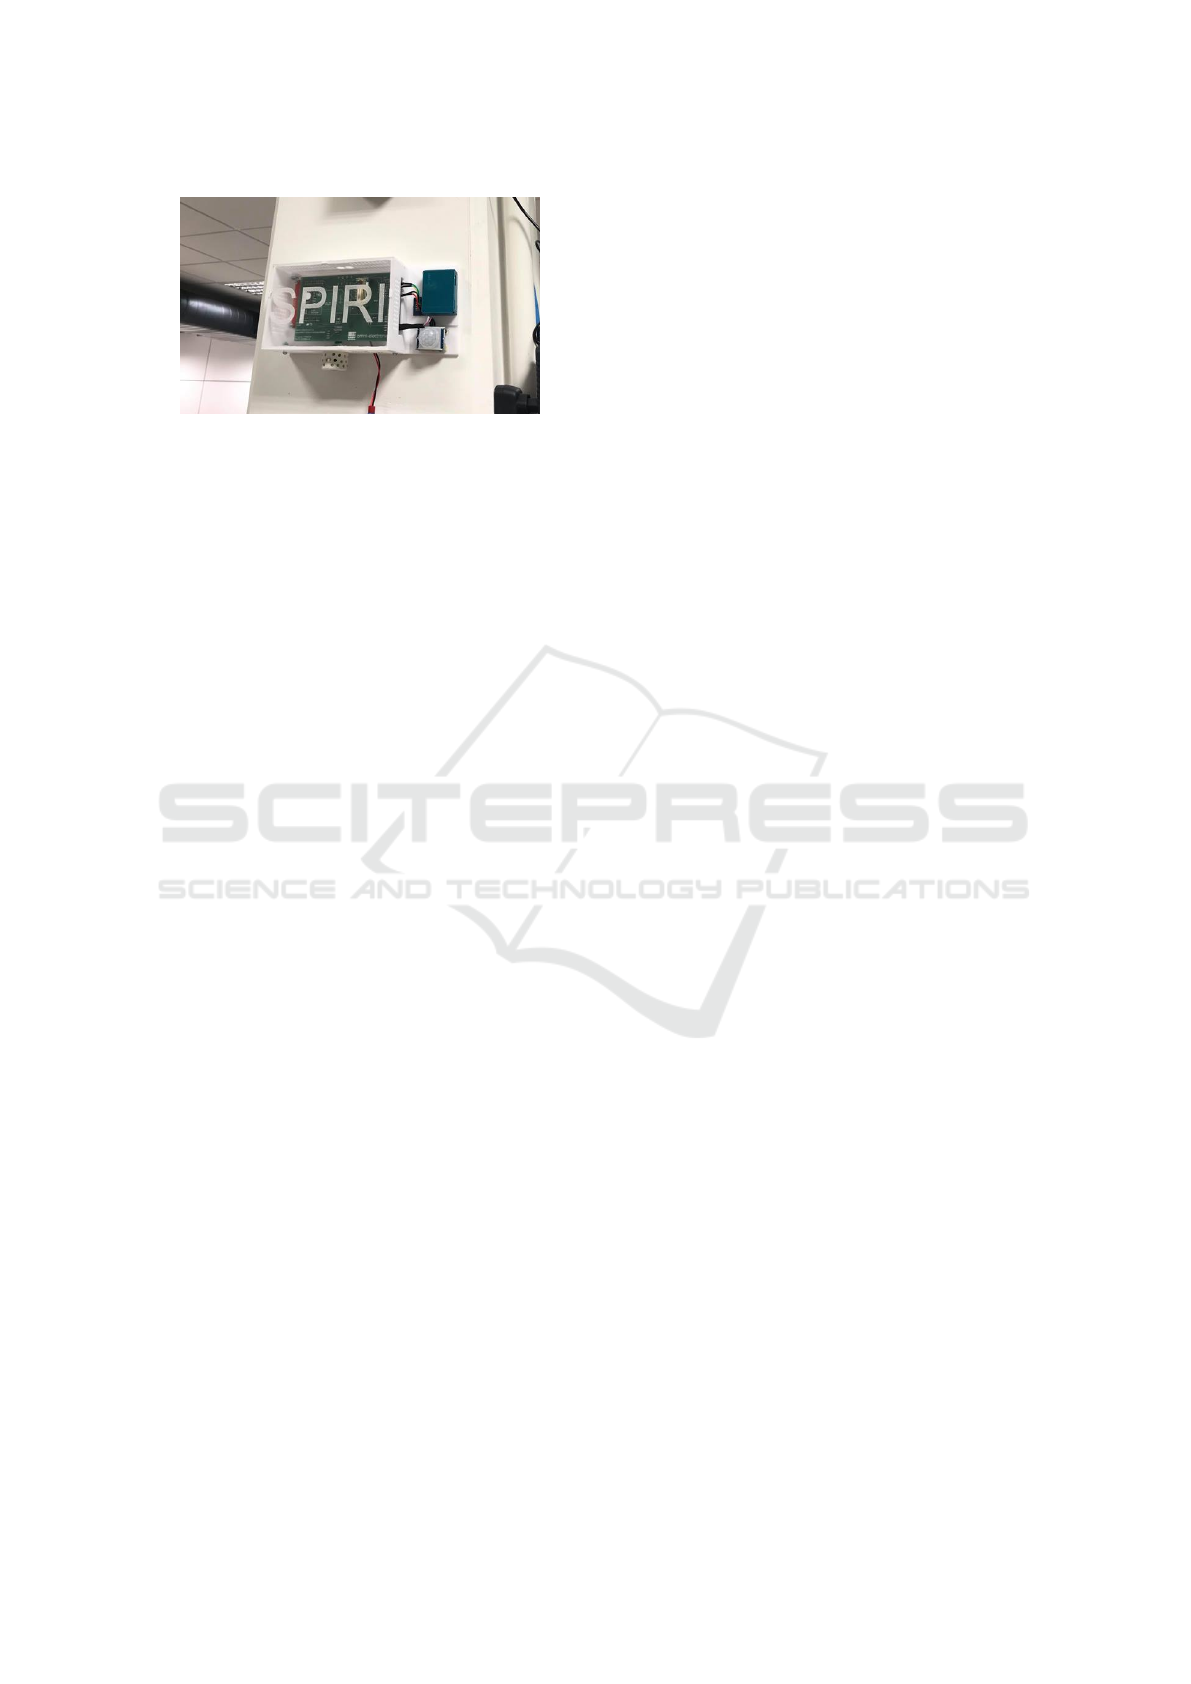
Figure 3: Final hardware.
ment when using in a new system: a start time, a stop
timer, a check if timer is expired, and a timestamp.
With only those functions OSYS builds a framework
of functionalities to help the development on any plat-
form, such as drivers timing, SNTP protocol, and
more. OSYS is the solution used by the developers for
fast programming and easy implementation of nec-
essary functionalities. Besides, interoperability is an
IoT challenge that can be driven by the OSYS frame-
work because it gives us a new abstraction layer be-
tween the OS and the hardware.
3.2.3 Protocols
As we described before, Contiki OS provides net-
working capabilities. Then, 6LowPAN protocol im-
plementation was chosen as a communication proto-
col. To implement the communication over 6LoW-
PAN with security and low footprint, Ripple (RPL)
was used as the routing protocol to map and con-
nect neighbor devices. As we use a low power and
low cost hardware platform, a new communication
protocol called CoEP was used. CoEP (Constrained
Extensible Protocol), is a protocol developed within
OSYS to be released as open-source. CoEP is capa-
ble in a single unified layer to provide full data se-
curity with public and symmetric key exchange and
management; authentication; single packet authenti-
cation; integrity and confidentiality. Furthermore, it
can provide fragmentation; acknowledgment; mes-
sage concatenation; and modularity to implement cus-
tom users messages, handshakes (called connectors)
and protocols within it with a lower footprint than
conventional protocols such as CoAP. Figure 4 shows
the CoEP packet, where:
• V: Version of the protocol, currently 0x0.
• C: Type of cryptography used in the payload: 0x0
for none; 0x1 for public key (to be chosen and
implemented by the user, however its advised to
use the current implementation of elliptic curves
of type 256r1); 0x2 for point-to-point symmet-
ric key cryptography; 0x3 for network symmetric
key, where all nodes can read the message.
• F: Fragment number. For being designed for
6LoWPAN networks, the maximum payload is of
128 bytes, or 3 fragments maximum.
• A: Whether the packet needs an acknowledge-
ment reply.
• L: Last fragment identification.
• Items marked with *: Parts of the message that
are encrypted.
3.2.4 Security Modes
CoEP protocol gives option to use asymmetric
and symmetric key exchange. The system was
implemented with micro-ECC, an cortex mthumb
optimized code that can handle varioyus eliptic
curves cryptography schemes. This application use
secp256r1 elliptic curves, using the Elliptic-curve
DiffieHellman (ECDH) key agreement protocol im-
plemented within CoEP as a connector. A custom
key derivation function (KDF) is used to generate the
symmetric key from the secret. Because the hand-
shake establishes the symmetric key and each CoEP
packet has its own authentication token, there is no
change in header length. However, because the sym-
metric cryptography is AES-128 CBC, packets pay-
load will always be multiples of 16bytes. CoEP limits
its payload to 48 bytes per packet in this application.
3.2.5 Power Saving
Low power consumption could be considered a crit-
ical feature in some IoT applications. To have low
power features we have chosen the CC2650 micro-
controller because it has specific low voltage/current
characteristics, for example: Normal operation volt-
age: 1.8 to 3.8 V, External regulator mode: 1.7 to
1.95V, Active-Mode RX: 5.9 mA, Active-Mode TX at
0 dBm: 6.1 mA and Active-Mode TX at +5 dBm:9.1
mA. Contiki OS takes advantage of the CC2650
power saving features. For example, when the de-
vice is sending data by using the RF interface, the
CPU will enter sleep mode and will resume after the
transmission process is complete. In case there are no
events in the Contiki event queue, the uC will enter in
low power mode that was previously configured with
the LPM (Low Power Mode) driver.
4 CASE OF STUDY
The object of the experimentation is a building with a
centralized HVAC System located in the Polytechnic
School of the University of S
˜
ao Paulo. The build-
ing is called CITI-USP, it is a research center which
IoTBDS 2018 - 3rd International Conference on Internet of Things, Big Data and Security
288
0
1 2
3
4
5 6
7
8
9
10
11 12
13
14
15 16
17
18
19
20
21 22
23
24
25 26
27
28
29
30 31
V=0 C F A L
Token
Message ID 1
Payload for Message ID 1 *
Figure 4: CoEP packet.
can be considered an office building. It is a multi-
disciplinary center where many people work in aca-
demic and industrial projects. Five sensor nodes, a
border router and a gateway were deployed in the sec-
ond floor of the building in specific locations where
people walk every day.
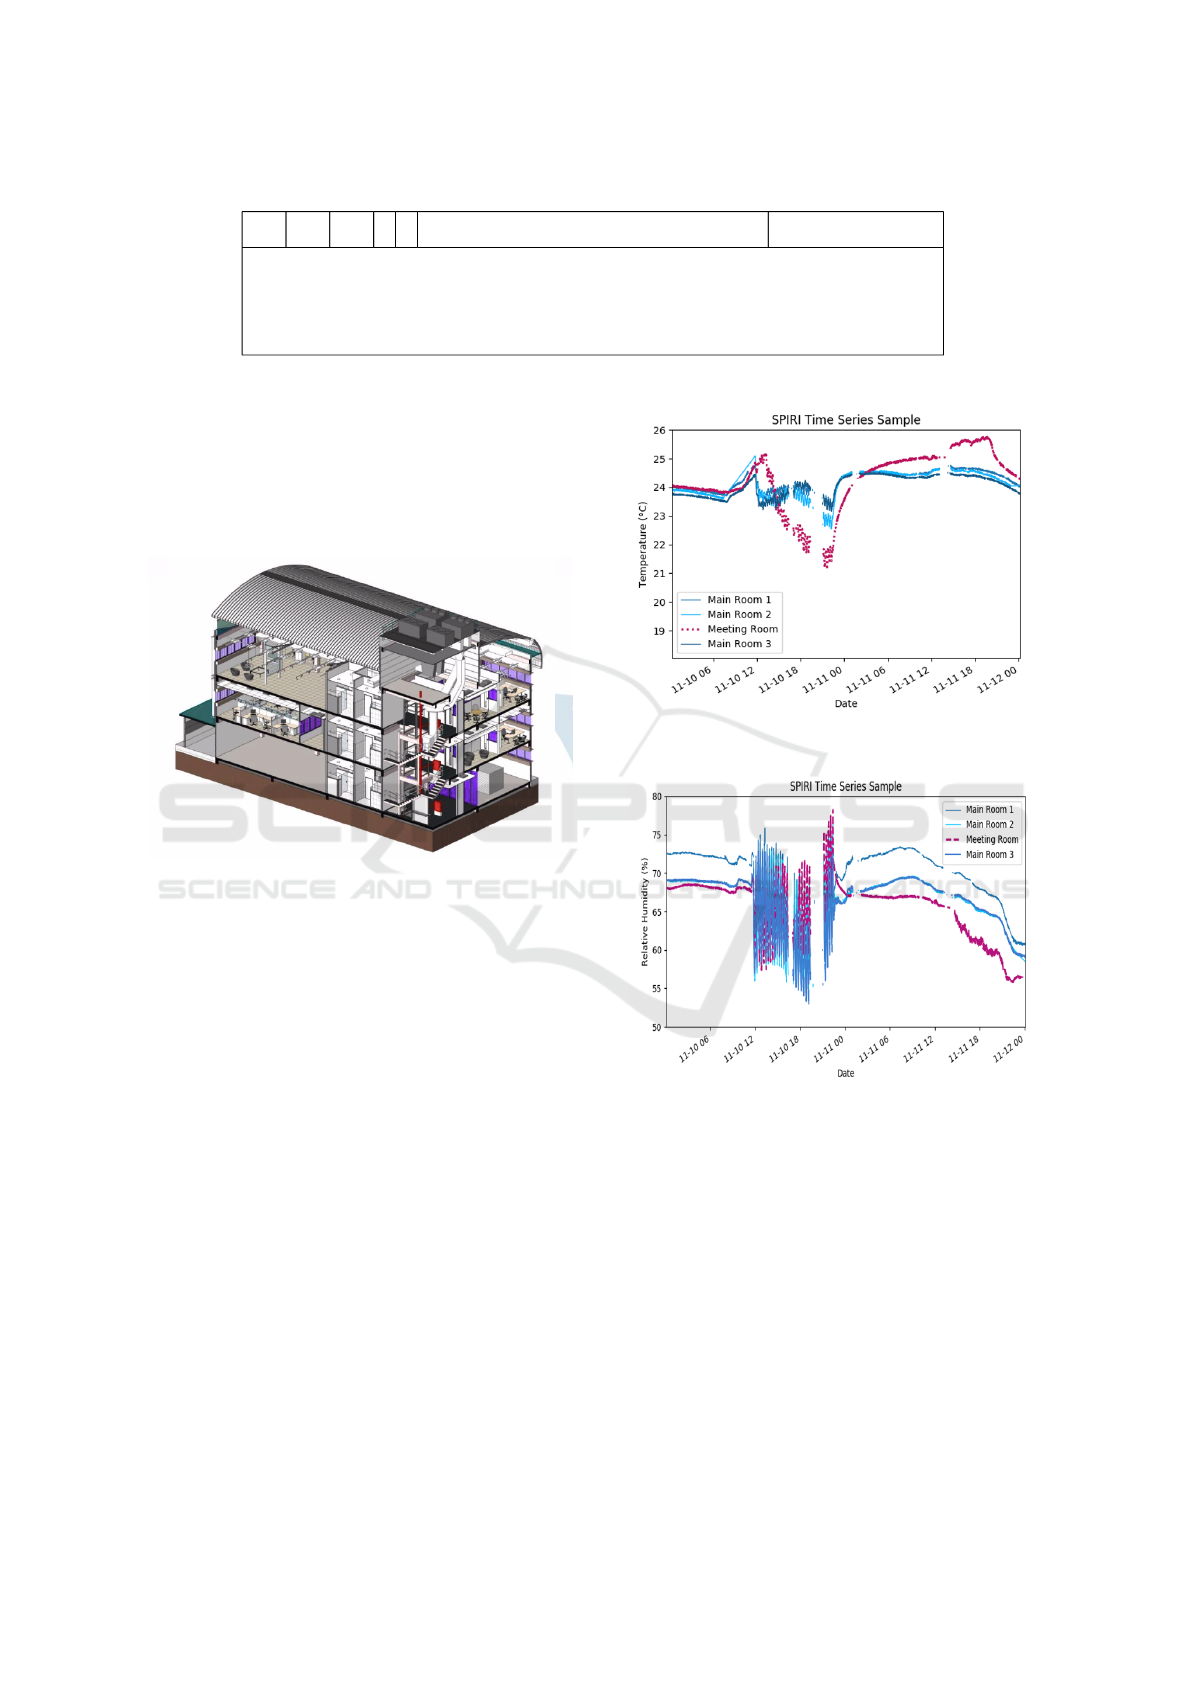
Figure 5: CITI-USP Building.
4.1 Initial Results and Analysis
The first analysis to be performed are related to hy-
grothermal comfort. Figure 6 shows the tempera-
ture profile of the first floor of CITI-USP building on
November 11
th
of 2017 between 10am and 12pm. A
sudden decrease of the temperature during this time
frame can only occur as a consequence of a active
HVAC-System operating in cooling mode, which can
be verified by Figure 7 that shows clearly the cycling
operation of the HVAC-System with significant drops
of up to 15% of relative humidity while it is on. This
is a common issue in mechanical ventilated environ-
ments, which can implicate in a aggravation of respi-
ratory conditions for sensitive people. It is also clear
to observe, how the Temperature significantly drops
inside the meeting room of about 4
◦
C in approxi-
mately 45 minutes. This evidences a not well planned
system that could easily be retrofit to avoid such per-
formance and enhance people’s comfort throughout
the day.
The conjunction of varying Temperature and rel-
ative Humidity to increased IAP can further degrade
Figure 6: 2-hours temperature profile of a floor in CITI-
USP.
Figure 7: 2-hours relative humidity profile of a floor in
CITI-USP.
the environment for its occupants. These analysis will
be completed in the following weeks with a greater
dataset of almost 50 days. Our prototype has eight
sensors working simultaneously, so the estimated
power consumption of the hardware was 400mW with
some current peaks of 150mA. It can be considered a
low power prototype if compared with some industrial
solutions, for example CO2 sensor from Honeywell
(Honeywell, ).
SPIRI: Low Power IoT Solution for Monitoring Indoor Air Quality
289

5 CONCLUSION AND FUTURE
WORK
This work presents the initial results of our IoT plat-
form for monitoring indoor environments. We have
defined the parameters to be monitored for some spe-
cific cases like houses, offices, schools, etc. Ad-
vanced sensor technologies were used to obtain ac-
curate results of the parameters which affects the in-
door air quality. We have deployed our system in a
research center of Sao Paulo University where data
collection was done each minute for each parameter
and preliminary results give us valuable information
about air quality behavior during the day.
For our future research, we plan to continue the real
time monitoring and try to emulate real situations
in an indoor environment like cooking, smoking and
painting and analyze the results. Another challenge is
to test the scalability of the system, so next phase is
to deploy 10, 30, 50 and 100 nodes simultaneously.
Another task is to implement a toolkit to view the live
air quality data of deployed regions. Other future re-
search is the implementation of some techniques to
improve the IAQ, for example the use of photocat-
alytic oxidation (PCO) to remove hazardous VOC el-
ements.
ACKNOWLEDGEMENTS
This work was supported by: grant #2015/22209-4
and #2016/15514-8, Sao Paulo Research Foundation
(FAPESP).
REFERENCES
Contiki (2017). Contiki operating system. URL:
http://www.contiki-os.org/. Accesed: 2017-11-20.
De Gennaro, G., Farella, G., Marzocca, A., Mazzone, A.,
and Tutino, M. (2013). Indoor and Outdoor Monitor-
ing of Volatile Organic Compounds in School Build-
ings: Indicators Based on Health Risk Assessment
to Single out Critical Issues. International Jour-
nal of Environmental Research and Public Health,
10(12):6273–6291.
EPA (2017a). Environment protection agency: Indoor
air quality. URL: https://www.epa.gov/indoor-air-
quality-iaq. Accesed: 2017-11-20.
EPA (2017b). The inside story: A guide to indoor air qual-
ity. URL: https://www.epa.gov/indoor-air-quality-
iaq/inside-story-guide-indoor-air-quality. Accesed:
2017-11-22.
Guo, P., Yokoyama, K., Piao, F., Sakai, K., Khalequzza-
man, M., Kamijima, M., Nakajima, T., and Kitamura,
F. (2013). Sick building syndrome by indoor air pol-
lution in dalian, china. International Journal of Envi-
ronmental Research and Public Health, 10(4):1489–
1504.
Honeywell. Co2 sensors. URL: https://goo.gl/3FWhNP.
Accesed: 2018-01-10.
IEEE (2017). 802.15.4 standard. URL:
https://goo.gl/DJRR7f. Accesed: 2017-11-20.
Joshi, S. M. (2008). The sick building syndrome. Indian J
Occup Environ Med, 12(2):61–64.
Kadri, A., Yaacoub, E., Mushtaha, M., and Abu-Dayya, A.
(2013). Wireless sensor network for real-time air pol-
lution monitoring. 2013 1st International Conference
on Communications, Signal Processing, and their Ap-
plications (ICCSPA), pages 1–5.
Lozano, J., Suarez, J. I., Arroyo, P., Ordiales, J. M., and Al-
varez, F. (2012). Wireless sensor network for indoor
air quality monitoring. Chemical Engineering Trans-
actions, 30:319324.
Mohieddine, B., Abderrazak, A., Ahmad, H. M. S., and
Farid, Touatiand Abdullah, K. (2017). Real-time in-
door air quality monitoring through wireless sensor
network. International Journal of Internet of Things
and Web Services, pages 7–13.
Penney D, Benignus V, K. S. (2010). Who guidelines for
indoor air quality: Selected pollutants.
Pham, D. T., Nguyen, D. C., Pham, V. V., Do, V. L., and
Tran, D. T. (2013). Development of a wireless sensor
network for indoor air quality monitoring. ICDV: the
2015 International Conference on Integrated Circuits,
Design, and Verification, 4.
Prasad, R. V., Baig, M. Z., Mishra, R. K., P, R., Desai, U. B.,
and Merchant (2011). Real time wireless air pollution
monitoring system. 2011 ICTACT Journal on Com-
munication Technology, pages 370–375.
Raju, P., R.V.R.S.Aravind, and Kumar, S. (2013). Pollution
monitoring system using wireless sensor network in
visakhapatnam. International Journal of Engineering
Trends and Technology (IJETT), 4:591595.
Raspberry (2017). Raspberry pi foundation. URL:
https://www.raspberrypi.org/. Accesed: 2017-11-20.
WHO (2017). World health organization: Indoor air qual-
ity. URL: http://www.who.int/indoorair/en/. Accesed:
2017-11-20.
Zhou, C., Zhan, Y., Chen, S., Xia, M., Ronda, C., Sun,
M., Chen, H., and Shen, X. (2017). Combined ef-
fects of temperature and humidity on indoor VOCs
pollution: Intercity comparison. Building and Envi-
ronment, 121:26–34.
IoTBDS 2018 - 3rd International Conference on Internet of Things, Big Data and Security
290
