
Digitalization of Legacy Building Data
Preparation of Printed Building Plans for the BIM Process
Hermann Mayer
Corporate Technologies CT RDA SDT MSP-DE, Siemens AG, Otto-Hahn-Ring 6, Munich, Germany
Keywords: BIM, Building Information Modelling, Building Plans, Digitalization, Digital Twin.
Abstract: Today, preparing existing building plans for a 3D BIM (building information modelling) process is a
tedious work involving lots of manual steps. Even if the data is already in a digitized and vectorised format,
the lack of semantics often prevents the data from being processed in automated workflows. However, the
requirements for simulation tasks, which are relevant for brown-field projects, are not too demanding
regarding the level of detail. In most cases (e.g. optimized placement of fire safety equipment, evacuation
planning, daylighting simulation etc.), only information about spaces and their interconnections are needed.
If coefficients for the heat-transfer between spaces can be added, also energy simulations can be performed.
Therefore the goal of this work is to provide a basic standardized building model, which can be derived
from all sorts of legacy data (different CAD formats and styles and even scanned plans). Also basic
semantics will be added to the data, which complements the definitions of the BIM standard used in this
work. Based on the models, building simulation can be enabled as a cheap surplus service, promoting the
usage of cloud implementation of the BIM process.
1 INTRODUCTION
Since there is a long history of building planning
(reaching back to ancient times), there is a vast
variety of formats and styles for representing
building data. In addition, buildings are long-lasting
assets - sometimes existing for centuries – which
need regular renovations and therefore building data
needs to be kept updated.
For most of the time, manually drawn or printed
paper plans have been the default representation.
Even today, this still is true for most private houses,
where printed plans are the only accepted standard
for the building permission process at official
authorities. In the second half of the last century,
computer technology has revolutionised also the
building planning process by introducing computer
aided design (CAD). However, most plans from the
earlier days of this technology are available in
printed form only. This is due to regulatory
restrictions as mentioned above or to the lack of
archiving the electronic documents. Digitising those
plans often ends up with scanning them into a
computer system. This process produces pixel-based
data, which can hardly be processed automatically.
While pixel-based data is yet digitized, but still
has lots of issues associated (low density of
information, missing scalability, low maintainability
etc.), modern CAD applications usually produce
vectorised data. This means the drawings are
composed out of geometric primitives, which come
with a parameterised description. For example, a
pixel-based circle is composed out of several points
placed around a common centre point, while a
vectorised description only needs to store the centre
point itself and a radius in order to reproduce the
circle in an arbitrary resolution. This promotes the
automatic interpretation of a building plan and
allows for better data handling. Another advantage
of vectorised building information is the ability to
store additional data with the vectors. This already
allows for semantic augmentation like forming
layers or using colours with certain meanings (can
be used for pixel data as well, but usage is
restricted). Another advantage is the description of
non-visible features. Particularly if some structures
are hidden behind each other, the hidden features
can be easily brought to foreground if the drawing is
vectorised. Otherwise this would not be possible for
pixel-based data, where all information, which
cannot be represented directly by visible pixels, is
304
Mayer, H.
Digitalization of Legacy Building Data.
DOI: 10.5220/0006783103040310
In Proceedings of the 7th International Conference on Smart Cities and Green ICT Systems (SMARTGREENS 2018), pages 304-310
ISBN: 978-989-758-292-9
Copyright
c
2019 by SCITEPRESS – Science and Technology Publications, Lda. All rights reserved

lost. However, there are still lots of challenges
associated with vectorised data as well. One of the
most common issues with vectorised data is the
interpretation of formats. Pixel-based data can be
interpreted quite easily by data processing
applications, at least as long as it is not compressed
(like gif or jpeg images). When it comes to
vectorised formats, readability often requires
sophisticated algorithms (like for rendering .pdf or
.svg) or formats are restricted to applications of
certain vendors (like the AutoDesk .dwg format). In
addition, the semantic annotation of features is often
user-specific and there is no standardized process for
its interpretation.
In order to solve the latter challenge, a
standardized format for storing semantic information
was established by the introduction of BIM -
building information modelling (Eastman, 2011). It
describes the Industry Foundation Classes (IFC) as a
standard for hierarchical data storage (Liebich,
2006). Although this methodology solves a lot of the
former issues, it comes with some new challenges
like ambiguities and missing structures for
simulation data.
BIM does not necessarily force the author to add
semantics in an extent, which is needed to derive
dedicated models from the format (e.g. for fire
detector placement or evacuation simulation).
Additional semantics like room usage, occupancy or
connectivity of accessible areas has to be derived by
downstream processes – as discussed below. This
information is not stored directly inside the BIM
model in order not to break compatibility with
general BIM CAD solutions. An important feature
still missing in BIM is the definition of common
interfaces to real-time data (Mayer, Frey, 2014).
2 QUALITY OF DATA
Typically the quality of data has improved during
the development of new standards for building plans
as described above. Particularly the introduction of
electronic data processing and the establishment of
international standards promoted the evolution of
consistent formats, which are easy to interpret.
2.1 Pixel Data
Starting with paper scans the quality of raw data
after digitisation depends on the resolution and
overall quality of scanning and photography devices.
Some plans (particularly older ones) might be
afflicted by stains and wrinkles. Resulting artefacts
might be reduced by post-processing algorithms like
opening, closing or smoothing. However, usually not
all of the artefacts can be eliminated by these
procedures and some missing or erroneous data has
to be replaced in later processing stages.
Vectorising pixel data is a complex task of its
own. Most applications try to reconstruct a set of
known geometric primitives from the pixels. For
example, pixels constituting a straight line will be
replaced by a parametric description of the line. This
reconstruction stage is usually not uniquely defined.
For example it might not be clear for some artefacts,
of which primitive they are a part of. Also
interruptions within straight lines can be interpreted
differently: new line, same line but missing parts,
dashed line? etc. Unlike the original intention of the
author is known, reconstructing vector data from the
pixels is usually not unambiguous.
Regarding formats, it is not always clearly
defined if they contain pixel data or vectorized data.
For example the well-known .pdf format may
contain vectorized structures as well as pixel data. If
relevant parts of the .pdf file are still not vectorized,
the .pdf should be converted into an image and fed
into the vectorization process. In the subsequent
sections, we assume .pdf files contain a vectorized
version of the relevant data.
2.2 Vector Data
Even if the data is vectorised already, different
issues regarding data quality might occur. One
typical challenge when interpreting vectorised data
is the resolution of ambiguities. As mentioned above
there are lots of completely different formats for
storing vector data, all of them providing different
ways of describing geometric primitives. For
example, there are very different variants to describe
a circular or ellipsoid primitive. As depicted in fig. 1
from left to right: one alternative is providing a
centre point and a radius, the next option is to
discretise the circular outline by linear chords or
tangents. Yet another alternative is constructive
geometry, where a smaller filled white circle is
subtracted from a filled black circle or (at the very
left of fig. 1) combining arcs to describe a circle.
Figure 1: Four different alternatives of vector circles.
Digitalization of Legacy Building Data
305

Any software which claims to provide a general
solution for understanding vectorised data would
have to respect all possible alternatives for all
relevant primitives. Given the abundance of formats
for vector data, this requirement can hardly be met.
Therefore a fall-back solution for converters is to
offer an interface for pixel-based data as well. That
means apart from the vector data, the program
processes a pixel-based rendering of the data in
parallel. The rendered pixel image can either be
provided by the user (to enable individual scaling
and pre-processing) or can be produced by the
software itself (e.g. by standard .pdf or .svg
renderers). Therefore the conversion starts with
extracting known vector primitives, while the
processing of unknown parts of the image will start
by vectorising the pixels in a standardized way for
the remaining parts as described in 2.1.
2.3 Semantics
Even if all corresponding primitives can be
reconstructed by the software, all parts still need to
be assigned to a certain semantics group (walls,
measurement lines, stairs, etc.). If no semantic
information is present in the underlying vector
format, structures have to be matched individually
by patterns (see below). If at least semantic groups
are present, but not yet assigned, the process can be
improved by deciding a common semantics for each
group. Unassigned semantic groups are constituted
by entities like layers, hierarchies or geometric
attribution (e.g. colour groups, hatching, line weight
etc.). While those groups can easily be extracted
from original vector data, extraction from vectorised
pixel data is not always possible or at least not
distinct. While layers are not present at all in this
kind of data, different colours and line weights are
sometimes hard to differentiate depending on the
quality of the pixel data (e.g. line weights or
grayscales). The intended semantics of the author
might first become clear if the interpretation is done
across several floor plans or even several projects of
the same author (best practises).
Figure 2: Combination of pixel and vector data.
A special case is the combination of vector data
and pixel-based information within the same file. As
depicted in fig. 2 for the building plan of a hotel, the
hotel rooms have been pasted into the plan from
pixel data, while other structures, e.g. the area
around the elevator are already vector-based. A
direct interpretation of hatching and line weights
would lead to inconsistent semantic groups. In
addition, if the pixel-based elements are interpreted
separately from the vectors, this can lead to
duplication of structures (like the walls around the
elevator in fig. 2).
2.4 Industry Foundation Classes (IFC)
In order to overcome the issues when interpreting
vectorised or even pixel-based data, BIM establishes
a common standard for a certain type of semantics
by introducing IFC - Industry Foundation Classes
(Laakso, 2012). BIM-IFC is also known as the first
open 3D standard for building-specific data
representation. Afterwards more dimensions have
been added to BIM data representations like time,
costs and operational data. However, adding new
dimensions to the model also extends the variability
of possible representations. For example, if we look
again at the circle in fig. 1, all depicted versions can
serve as a basis for a 3D cylinder. Again, for the
creation of the cylinder, several options exist: e.g.
extrusion along a straight line, adding orthogonal
facets or creating a rotational solid. In models all
possible permutations of varieties might be found.
We already proposed some methods to import non-
conform IFC files (Mayer, 2012). Apart from
geometric primitives, there might be also pixel-
based data included in IFC models – so-called point
clouds. They can regularly be found in models,
which are exported by 3
rd
party applications into
IFC. If there is no known representations of
proprietary entities in IFC the fall-back solution of
most programs is exporting faceted point clouds.
This sort of data can also be found if existing
buildings are digitised by laser scanners (cf. fig. 3).
The task of processing these point clouds is
comparable to the vectorisation of pixel-based data
as described above. Again, rendering point clouds
can be a fall-back solution for the processing of
otherwise unhandled 3D formats. In an extreme
case, a valid IFC file might contain point clouds
only, and therefore, the processability of those files
is much worse than the one of vectorised 2D data.
SMARTGREENS 2018 - 7th International Conference on Smart Cities and Green ICT Systems
306
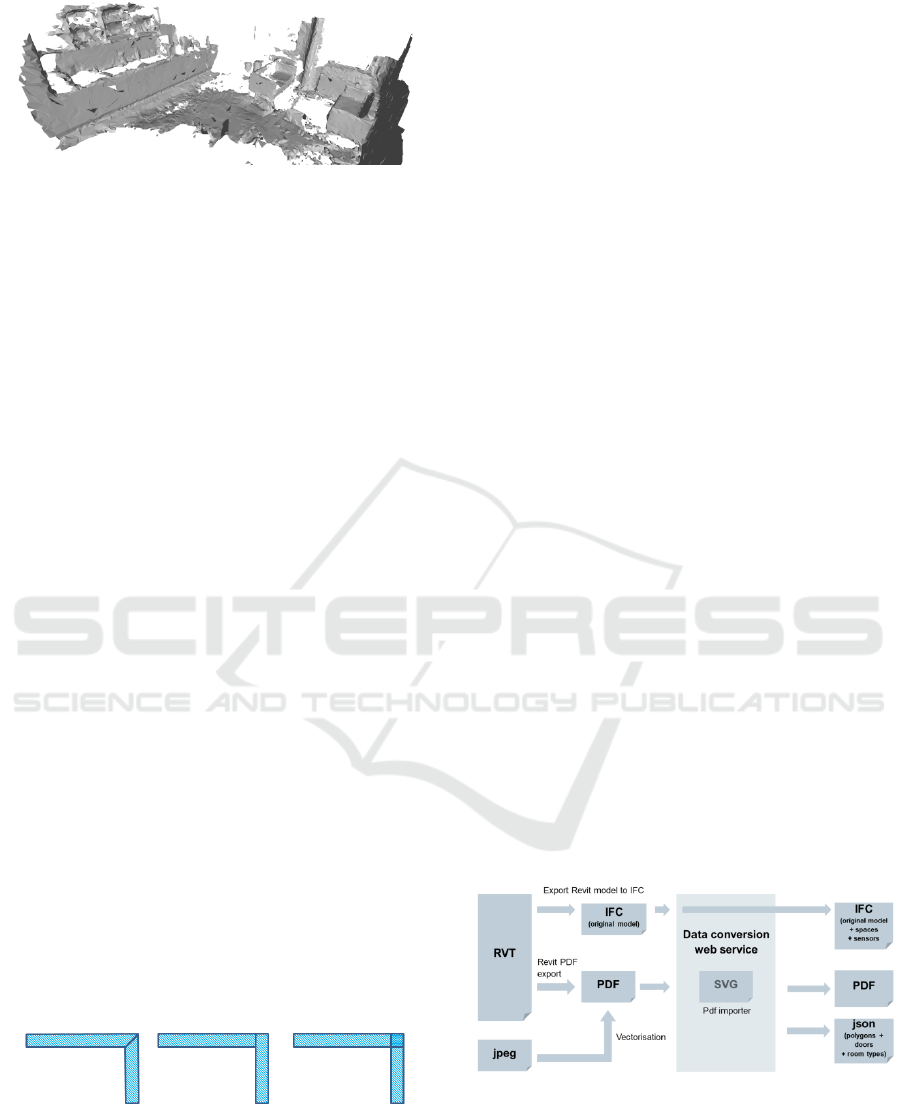
Figure 3: Typical point cloud after scanning a room.
Anyway, even if the geometric primitives of a
3D IFC representation are of perfect quality, other
parts of the IFC file can still cause issues. A typical
anomaly of an IFC file is the erroneous arrangement
of elements in its hierarchy. According to the IFC
standard, all elements should be arranged in a tree-
like structure. However, it does not say anything
about the correct position of elements within the
hierarchy. Therefore, even directly neighbouring
elements might be added to unexpected parts of this
hierarchy. For example, an IFC hierarchy usually
contains different floors of the building, but
elements can be put into arbitrary floors. Therefore,
a room might be place inside the correct floor, while
all furniture of this room is assigned to the ground
floor by adding a corresponding offset – still
constituting a valid IFC file. Some elements of the
IFC hierarchy might be duplicated for several
reasons. Usually, there should be only one building
root element, but due to merging several models
(e.g. architectural model and MEP – i.e. Mechanical
Electrical Plumbing structure) duplicated elements
can occur. Therefore some delimiters of a room like
dry walls are contained in the architectural node,
while other elements like structural walls are
contains in the MEP node. Usually there are no
references introduced when merging the models.
The only way to find neighbouring elements is an
exhaustive search, which is computationally
expensive. Another issue typically found in IFC files
from different vendors is the non-standardized
joining of walls. Joining walls is particularly
important to detect leak-proof entities (like for
energy or smoke simulation).
Figure 4: Different ways of joining walls.
Again, software for automatic model generation
has to deal with all relevant versions. As depicted in
fig. 4, walls might be joined inclined, straight or
overlapping.
Another issue with IFC files is often the wrong
or ambivalent utilization of elements. For example
dry walls or mobile walls are sometimes modelled as
furniture. In contrast, some types of room separators
attached to furniture are often modelled even as
structural walls. Also the relations of entities as
defined in the IFC standard are often not
implemented by IFC exporters (e.g. windows should
be related to openings, which are contained in walls
– but those entities are often found without any
semantic relation between each other). Some
elements in IFC files are sometimes not even
represented by a 3D entity, but just by 2D textures
on top of some other elements (e.g. doors painted on
walls instead of modelling them in 3D). There are
also elements, where IFC itself allows for a lot of
options instead of restricting itself to a clear
definition. For example stairs can be expressed in
large variety of implementations without demanding
a clear subset of common features. This is due to the
self-evident architect-centric definition of IFC,
which neglected at some points the requirements of
simulation engineers. Apart from these issues, BIM
IFC is a big step towards automatic data processing
of building data. Particularly IFC-based databases
like the BIM server (van Berlo, 2016 and Taciuc
2016) enable an efficient and integrative
management a large amounts of data.
3 DATA CONVERSION
In order to deal with different qualities of data, we
have introduced a semiautomatic process to enable
data conversion. The process starts at legacy paper
work (.jpeg) and ends with the generation of BIM-
IFC models – as depicted in fig. 5.
Figure 5: Conversion workflow.
Apart from legacy data, the workflow also
incorporates the processing of 3
rd
party models. As
an example we have chosen AutoDesk Revit to
serve as a 3
rd
party format, since a large variety of
models is designed with Revit today. As depicted in
Digitalization of Legacy Building Data
307

fig. 5, general 3
rd
party models are integrated early
in the processing chain. The reason for that is the
lack of spatial information in most files (no
IFCSPACES defined). Regarding this important
feature, existing BIM models without spaces are
treated as ordinary vectorised files and converted to
.pdf format, which is possible in all commonly used
3D CAD applications. If supported by the 3
rd
party
software, we export an IFC model as well, which
will be augmented by spaces afterwards. When
exporting from 3
rd
party applications, the user should
usually support the conversion process by restricting
the export to relevant layers.
The conversion of legacy data is provided by an
external vectorisation service. It can be started in
batch mode and is therefore able to convert several
pages with pre-set parameters consequently. The
software detects primitives like lines and circles and
can also form semantic groups to some extend -
depending on the picture quality and distinctiveness
of features. For example if there are only two very
distinct line types at high quality, the application
should be able to detect two semantic groups.
After storing the building data to a .pdf file, it is
converted to a .svg file (scalable vector graphics).
The advantage of .svg is the better availability of
APIs (application programming interfaces).
3.1 Automatic Room Detection
After storing the building data to a .pdf file, it is
converted to a .svg file (scalable vector graphics).
The advantage of .svg is a higher availability of API
interfaces and it is in theory a human readable
format, which facilitates testing and debugging. The
API extracts the primitives stored in the file and
converts them to internal structures of the
corresponding programming language. Based on
these primitives, the application then searches for
certain patterns describing doors. Currently the
patterns are fixed, but a more flexible approach of
user-defined patterns is under preparation. The
pattern for the door describes the arrangement of
primitives, which are usually taken by architects to
describe this element (e.g. a straight line connected
to a quarter arc). In addition, we evaluated neural
networks to solve the task of door detection.
However, neural networks suffer from a high
demand for training data before reliable results can
be expected (Abu-Mostafa, 2012). Therefore, they
are not well-suited for an application on building
data with a limited amount of examples for the same
style.
After the doors are detected by pattern matching,
they serve as a starting point for detecting the
polygonal delimiters of rooms. If the door sill is
taken as starting line, it is quarantined for connected
lines to be part of the room polygon. As depicted in
fig. 6, there are two runs for each direction, starting
at the door.
Figure 6: Algorithm to search for room polygons.
The first run connects all points starting at one
end-point of the sill. The next point is always
connected in a way to form the smallest possible
angle. As depicted in fig. 6 (middle) the connection
with angle 90° was chosen, while there would have
been another alternative constituting 270°
(downwards). By using the smallest possible
connection, it is guaranteed to intersect with the
formed line again after the lowest possible number
of steps (black line in fig. 6 right). After one run was
completed, the other direction is tested for forming a
polygon, again taking the smallest possible angle for
connections (red line in fig. 6 right). Since the size
of doors is known, an approximate scale of the plan
can be determined (by assuming a single door to
have a width of 0.7 m – 1.5 m). Therefore, the
approximate area of polygons can be determined in
order to filter off small polygons. Another special
case to be treated is the exterior of the building,
which is detected by starting at one of the entrances.
Once the room detection is completed (all doors are
processed), the connectivity of rooms is determined
(showing neighbouring rooms in different colours in
fig. 7). Connections via stair cases are added by
searching for pre-defined patterns for stairs. Again
these patterns are fixed right now, but are going to
be replaced in future versions by a flexible approach.
Figure 7: Coloured polygons after room detection.
When the polygons are detected, they are merged
in order to form rooms according to predefined
SMARTGREENS 2018 - 7th International Conference on Smart Cities and Green ICT Systems
308
rules. One of these rules merges embrasures of doors
and windows with the adjourning room. After the
room detection algorithm terminates, a 3D model is
extruded from the room polygons (fig. 8). The
height for extrusion is taken from user-defined
parameters.
Figure 8: Extrusion of polygons into a 3D model.
Originally the extrusion also included the
generation of walls. However, since the
reconstruction of valid BIM IFC walls is hardly
possible, and walls are not necessary for most
relevant simulation tasks, wall generation is omitted
in the current version of the software.
The accuracy and access rate of the room
detection depends mainly on the quality of the input.
For properly prepared CAD data (with well-defined
layers and re-used building blocks like doors), the
procedure is quite successful in finding all rooms.
There are some issues regarding the handling of
stairs, due to their high variability between
buildings. We have defined some standard types of
stairs - however the whole abundance of design
options cannot be covered right now. Regarding the
processing of scanned plans, the success rate
predominantly depends on the quality of the scans
and on the individual pre-processing by the user.
Therefore an overall success rate cannot be given or
guaranteed without defining further restrictions.
3.2 Room Types
A more important attribute of the detected rooms is
their usage type. The usage of a room decides about
dependent features like fire safety equipment or
occupant evacuation (Mayer, 2014). For the
detection of room types we are currently developing
a supervised learning suite based on three different
features, which uniquely describe the room type.
The first feature is the topology of the room, i.e. its
arrangement in the building hierarchy. For example,
aisles usually are connected to the stair case and to
several rooms. Restrooms usually have an entrance
area with basins, followed by another room with
small cabinets. However, most rooms cannot be
classified by topological features alone. Therefore,
as a second feature, rooms are searched for text
patterns indicating their usage. Text indicators might
be straight-forward like “kitchen” or “office” (in
different languages) or indirect like typical family
names of persons indicating a cubicle office. Texts
are detected by regular expressions (Aho, 1986),
which have to be defined by the user. Texts as an
indicator have a very high reliability, but since not
all variants of building plans contain those texts, a
third feature is added for determining room types.
Most architects use certain symbols or artefacts to
indicate the usage of rooms. If we look again at
fig. 2, the usage type as a bedroom is clear from the
symbols (beds and nightstands). Additional
conclusions can be drawn from context: if a building
contains predominantly bedrooms, it is most likely a
hotel and the bedrooms are guest rooms. Therefore
symbols are a powerful feature found in most plans
today. However, formalizing their usage is much
more complex compared to texts. Currently we are
developing a symbol matching algorithm based on
support vector machines (SVM) used for
classification (Schölkopf, 2001).
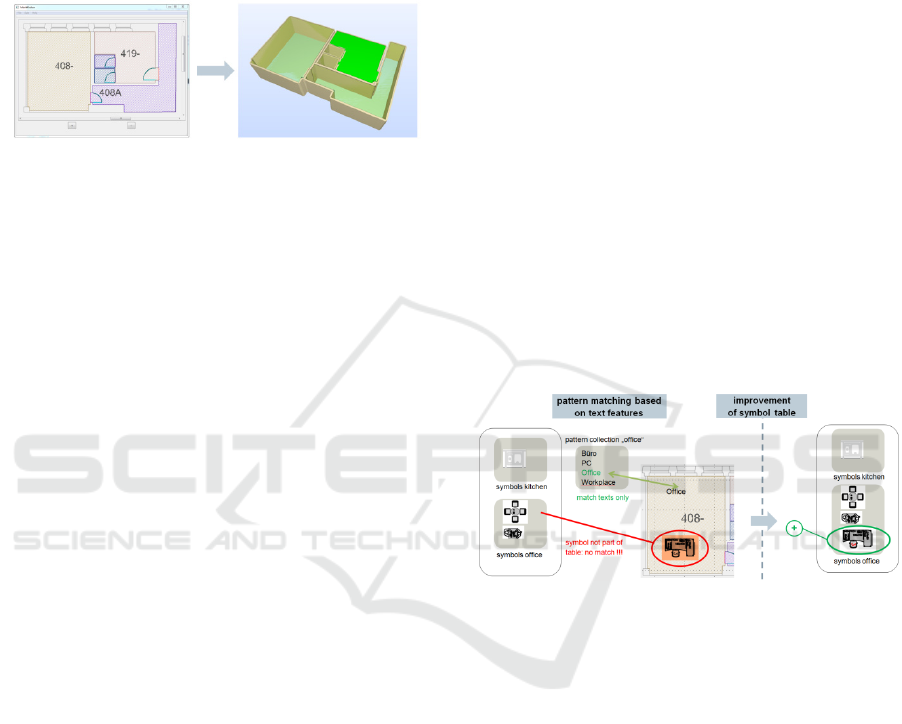
Figure 9: Extrusion of polygons into a 3D model.
While the algorithm works already based on a
separate/independent classification of the three
features, we are currently preparing an integrated
solution. As depicted in fig. 9, some rooms are
attributed by several different features: in this
example a text feature (“Office”) and a symbol
feature (office furniture). In the depicted situation,
classification can be determined by texts only, since
the furniture is not yet added to the symbol table. By
distinctly classifying the room as an office by text,
the contained symbols can now be added to the
symbol table. Later, other rooms with this type of
furniture can be classified as offices as well without
the need of a textual description. Therefore,
connecting the detection of different features in this
way, will automatically improve the overall
classification quality (self-improving system). As an
additional option, the manual classifications of users
will be collected and analysed in a central place (via
Digitalization of Legacy Building Data
309

web services) to improve the classification as well.
Based on the spatial information combined with the
usage type of rooms an evacuation simulation can be
derived, which complies with the regulations of the
International Maritime Organization (IMO 2002)
and the German RiMEA (RiMEA, 2009).
4 CONCLUSIONS
We have presented a novel approach to improve the
data quality of legacy building data in order to
derive BIM models automatically and to add
semantics as far as needed for simulation tasks.
After pre-processing the raw input, which could be
just scanned plans, building structures like doors and
rooms will be detected automatically. Rooms and
their connectivity is a central key for providing
downstream service without extensive effort. A
central key is the detection of rooms and the
determination of their usage. This can be achieved in
an interactive process by providing as much
automation as possible. Interactive means the
expertise of human experts using the service will be
used to improve the classification processes in an
iterative approach. Once all rooms are properly
classified, many simulation applications can profit
from this information and will not need too much
frontloading anymore. For example the number of
occupants can be increased for office rooms (in
evacuation planning) or a fire simulation can be
performed with better realism (fires usually start in
kitchens and storage rooms). We think that this
preparation of legacy data can leverage use cases for
simulation on the one hand, and reduces costs on the
other hand, and therefore, will improve the quality
and safety of buildings in the future.
As a next step we want to finalize the work on
the room detection and classification and provide
them as web services in the internet. The quality of
results of the self-learning algorithms will massively
profit from a large user community. In exchange for
contributing to the platform with their experience,
they can use the services at a reduced rate or will be
rewarded by data usage. The hope is for such a
system to improve itself at a steep rate at the
beginning, while results stabilize when the amount
of users reached a critical number (critical in a sense
to be sufficient for the platform to live on).
By providing a central platform for uploading
models and providing services independent from a
specific platform vendor, the basic idea behind the
BIM process as a method for building lifecycle
management will be promoted.
REFERENCES
Abu-Mostafa, Y., Magdon-Ismail, M., Lin, H., 2012.
Learning from Data. AMLBook.
Aho, A., Sethi, R., Ullman, J., 1986. Compilers:
Principles, Techniques and Tools. Addison Wesley.
van Berlo, L., Papadonikolaki, E., 2016. Facilitating the
BIM coordinator and empowering the suppliers with
automated data compliance checking. ECPPM.
Eastman CM, Teicholz P, Sacks R, Liston K., 2011: BIM
handbook: A guide to building information modeling
for owners, managers, designers, engineers and
contractors. 2nd ed., Wiley.
IMO Guidelines. 2002: Interim Guidelines for Evacuation
Analyses for new and existing passenger ships.
International Maritim Organization (IMO).
MSC/Circ. 1033.
Laakso M., Kiviniemi A. O., 2012: The IFC standard: A
review of History, development, and standardization.
ITcon 17.9, pp. 134-161.
Liebich T., Adachi Y., Forester J., Hyvarinen J., Karstila
K., & Wix J. 2006. Industry Foundation Classes:
IFC2x Edition 3 TC1. International Alliance for
Interoperability (Model Support Group).
Mayer H., Frey C., 2014. Modeling and Computer
Simulation for an advanced Building Management
System. 15
th
International Conference on Automatic
Fire Detection. Duisburg. Germany.
Mayer H., Klein W., Frey C., Daum S., Kielar P.,
Borrmann A., 2014. Pedestrian Simulation based on
BIM data. ASHRAE/IBPSA-USA Building Simulation
Conference. Atlanta, GA, USA.
Mayer H., Paffrath M., Klein W., Kleiner S., 2016.
Simulation des Entfluchtungsverhaltens in der
Planungsphase von Gebäuden mit Hilfe der automa-
tisierten Prozessintegration und Designoptimierung.
NAFEMS DACH Conference. pp. 433-436.
Taciuc, A., Karlshøj, J., Dederichs, A., 2016.
Development of IFC based fire safety assessment
tools. Proceedings of the International RILEM
Conference Materials, Systems and Structures in Civil
Engineering.
RiMEA Guidelines. 2009: Richtlinie für mikroskopische
Entfluchtungs-Analysen, https://rimeaweb.files.word
press.com/2016/06/rimea_richtlinie_3-0-0_-_d-e.pdf.
Schölkopf, B., Smola, A., 2001. Learning with Kernels:
Support Vector Machines, Regularization, Optimiza-
tion and Beyond (Adaptive Computation and Machine
Learning Series). MIT Press.
SMARTGREENS 2018 - 7th International Conference on Smart Cities and Green ICT Systems
310
