
A Methodology to Teaching Statistical Process Control in Computer
Courses
Julio Cezar Costa Furtado
1, 2
and Sandro Ronaldo Bezerra Oliveira
2
1
Departament of Exact and Technologies Sciences, Federal University of Amapá. Macapá, Amapá, Brazil
2
Graduate Program in Computer Sciense, Institute of Exact and Natural Sciences,
Federal University of Pará, Belém, Pará, Brazil
Keywords: Statistical Process Control, Software Engineering Education, Teaching Methodology, Computer Course.
Abstract: A process considered in statistical control must be stable and repeatable. The Statistical Process Control
(SPC) importance for the software industry has grown in recent years, mainly due to the use of quality
models. In this context, this work aims to propose a teaching methodology for SPC where the learning
process is student centered. The methodology is composed of reading experience reports, PBL, practical
cases discussion, use of games, practical projects, and reflections on the contents learned.
1 INTRODUCTION
A process considered in statistical control must be
stable and repeatable. Thus, the Statistical Process
Control (SPC) is a collection of techniques for
achieving this goal. The use of SPC in the processes
improvement is not new to the industry in general.
In the context of software organizations, the
statistical control can be considered something
relatively recent (Alhassan and Jawawi, 2014), and
there are still many doubts about its application
(Garcia et al., 2007; Boffoli et al., 2008; Tarhan and
Demirors, 2008). The importance of the SPC for the
software industry has grown in recent years, mainly
due to the use of quality models internationally
recognized (Fernández-Corrales et al., 2013).
In the early levels of improvement programs,
organizations adopt the measurement that simply
consists of collecting data from the project execution
and comparing them with the planned values.
Despite it is a sufficient approach, it is not suitable
for organizations seeking high maturity, to evaluate
and to evolve their processes. In these organizations,
it is necessary to perform statistical control of
software processes to know its behavior, determine
its performance in previous executions and predict
its performance in current and future projects,
making sure that it can achieve established goals and
identifying corrective actions and improvement
when appropriate (Barcellos et al., 2010).
However, the SPC use in software development
organizations has been showed complex due to these
techniques exist in a context that does not consider
the present particularities in a software development
process (SEI, 2010). This difficulty may also be
caused by the type of training of these professionals,
in the approach used for teaching SPC during the
graduation of these students, and if SPC topics were
at least taught.
The great difficulty of the actual use of this
employee for statistical process control is the fact
that most of these employees do not have the
necessary knowledge for such an undertaking. It
ends up being a conflicting point of performance to a
computer professional, due to their basic education
often contemplate the discipline of Probability and
Statistics, which the many disciplines of Software
Engineering (SE) / Software Quality should provide
a solid basis enough that this professional can act
with more confidence in the market when there is a
need for statistical process control in the
organization.
In general, the software industry suffers from a
lack of qualified professionals to work in activities
involving the software development process
(Wangenheim and Silva, 2009; Taran and Rosso-
Llopart, 2007; Garg and Varma, 2008; O’Leary et
al., 2006). In case of most companies, up to 80% of
the hires are made at the entry level (fresh
graduates), and up to 80% of the training budget is
spent on them (Taran and Rosso-Llopart, 2007).
424
Furtado, J. and Oliveira, S.
A Methodology to Teaching Statistical Process Control in Computer Courses.
In Proceedings of the 13th International Conference on Evaluation of Novel Approaches to Software Engineering (ENASE 2018), pages 424-431
ISBN: 978-989-758-300-1
Copyright © 2018 by SCITEPRESS – Science and Technology Publications, Lda. All rights reserved

Although we did not find specific statistical data
regarding the SPC, it is easy to infer that the reality
of SE professionals in this specific area should not
be different from the scenario. So, in this context,
this work aims to propose a teaching methodology
for Statistical Process Control that stimulates and
motivates students and that is aligned with
humanistic teaching approaches, were the learning
process is student centered.
In addition to this introductory section, this paper
is structured as follows: The Section 2 will describe
a brief background on Software Engineering
Teaching. In Section 3, the teaching methodology is
presented. In Section 4, an experiment design is
proposed to evaluate the methodology learning
effectiveness. Section 5 presents the conclusions of
this work.
2 BACKGROUND ON
SOFTWARE ENGINEERING
TEACHING
According to the ACM / IEEE (ACM/IEEE, 2013),
the SE is a discipline interested in the application of
theory, knowledge and practice for the effective and
efficient development of software systems that meet
users’ requirements.
A survey performed in (Wangenheim and Silva,
2009) intends to discover the opinion of professional
in Software Engineering area about the relevance of
the topics covered in the Computer Science courses.
As results, the survey indicates that there is a lack of
attention to some SE topics. To certain topic, it was
possible to identify even a complete lack of
consideration from professors and students. For
example, the “Software Configuration Management”
topic, which in practice is considered as an essential
basis not only for software engineers, but also for
any professional software (Wangenheim and Silva,
2009).
On other hand, despite the importance of these
knowledge regarding to the activities of SE, in
Lethbridge (2000) it was found that professionals
learn more about these activities during their work
than from university courses / education. It may
occur by the simple fact that, if we consider the
suggestion of a total of at least 280 hours for a
Computer Science course (SBC, 2005), the
allocation of about 36 hours to SE topic does not to
correspond with the perception of importance these
topics and consequently not enough time to be spent
in important topics.
In this context, there seems to be a consensus
that the teaching of Software Engineering must go
beyond the format of traditional lectures,
encompassing other teaching and learning
approaches. Some authors identify practical teaching
approaches as the most suitable for Software
Engineering (Prikladnicki et al., 2009, Malik and
Zafar, 2012, Marques, Quispe and Ocho, 2014).
Despite the emphasis by these authors, there is still
no ideal teaching approach to conduct these practical
experiences (Malik and Zafar 2012).
Also, ACM/IEEE (2013) recommends that
higher education in Computing must involve its
students in software development practical projects.
Thus, the skills required for a software engineer
should be practiced from the graduation beginning
(Gnatz et al., 2003).
2.1 Related Works
There is the FRAMES initiative (Portela,
Vasconcelos and Oliveira, 2016), a framework for
the teaching-learning of Software Engineering
topics. FRAMES supports the teaching and learning
of SE topics recommended by the ACM / IEEE
(2013) and SBC (2005) reference curricula.
The framework was defined based on the
results of a survey and a case study with teachers
and students, addressing the relevance of the topics
taught and the teaching approaches effectiveness.
Although the framework is based on the
recommendations of the reference curricula, which
do not effectively cover the content of Statistical
Process Control, it was the main reference for the
definition of the teaching approach developed in this
work.
3 THE TEACHING
METHODOLOGY
3.1 Preliminary Studies
As a way of understanding the real need of the
software industry on SPC, two preliminary studies
were carried out: a literature review on quality
model that provide recommendations for the SPC,
CMMI-DEV (SEI, 2010) and MR-MPS-SW
(SOFTEX, 2016), the review aimed to identify the
basic skills needed to work with SPC; and an
application of a survey to software engineers with
the objective of validate these SPC competencies
A Methodology to Teaching Statistical Process Control in Computer Courses
425

and to discover the most relevant competencies in
their organizations (Furtado and Oliveira, 2017).
These results provided inputs for the
development of the methodology. The methodology
is based on Problem Based Learning (PBL) and
Kolb's Theory of Learning (Kolb, 1984), through the
application of an adaptation of the Kolb Learning
Cycle. The methodology is composed of reading of
experience reports, PBL, discussion of practical
cases, use of games and dynamics, realization of
practical projects and reflection on the learned.
After these studies, it was possible to identify
and validate 13 basic skills needed for a software
engineer to work in SPC, as listed:
1. Identify processes that are aligned with
quantitative objectives of business;
2. Identify the processes need of information
necessary to achieve the organization's business
objectives;
3. Define the process measurement objectives;
4. Identify the measurable relationships among the
process elements that contribute to the process
performance;
5. Define quantitative objectives for the process
quality and performance that are aligned with
need of information and the business
objectives;
6. Select the processes that will be the
performance analysis object;
7. Define appropriate measures for the process
performance analysis;
8. Collect, validate, and communicate
measurement results to monitor how much
quantitative targets for process performance
have been achieved;
9. Select the techniques to analyze the data
collected;
10. Analyze the measurement data in relation to
special causes of process variation;
11. Characterize process performance;
12. Perform corrective actions to address special
causes of variation;
13. Establish, improve, and adjust process
performance models.
3.2 Discipline Syllabus, Techniques,
Methods, and Teaching Resources
With these skills identified, it was possible to define
the discipline syllabus necessary to provide all this
background. Thus, the discipline was divided into 4
units: (1) Business processes and objectives, (2)
Measurement, (3) Statistical control, and (4)
Capacity and process improvement evaluation.
The first unit, Business Processes and
Objectives, aims to teach the basic concepts of
process and organization, teach the analysis,
modeling and implementation of processes and the
identification of critical processes. The second unit,
Measurement, aims to teach how to define and
execute a measurement plan. The third unit,
Statistical Control, is where the importance of SPC
will be taught, how to use control charts and how to
perform cause and effect assessment. The last unit,
Capacity and Process Improvement Evaluation, it
will teach baseline concepts and process capability
as well as how to improve process.
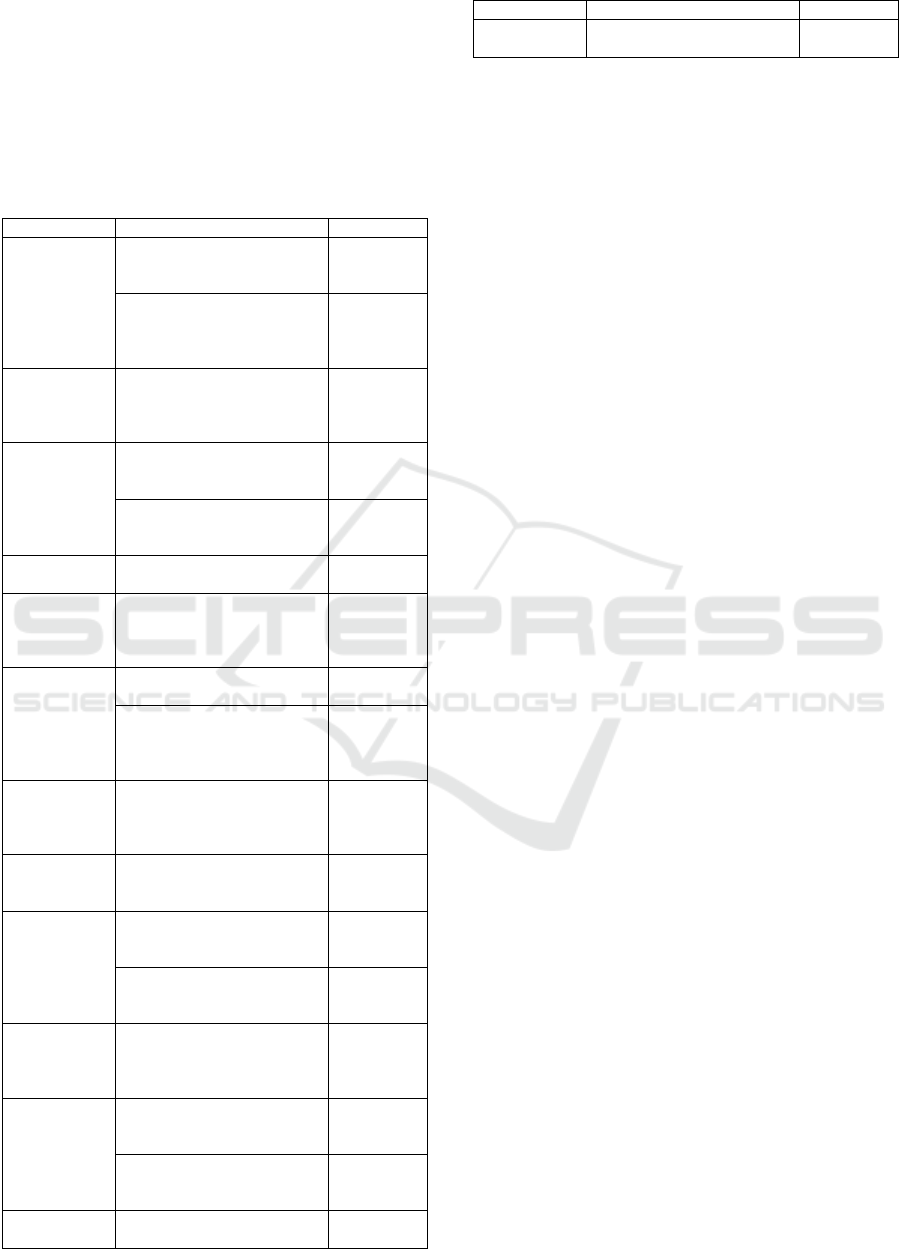
The Table 1 summarizes the contents that will be
taught in each unit and what results are expected in
relation to the skills acquired by the students. For
each item, it was also detailed the expected level of
cognitive ability, using a terminology based on
Bloom's taxonomy (Bloom, 1956) that consists in
remembering, understanding and application, where:
remember, remember the material previously taught;
understand, understand the information and meaning
of the material taught; and apply, use the material
learned in new and concrete situations. It is
important to emphasize that Apply includes
Understand that includes Remember (Nunes et al.,
2016).
The selection of techniques, methods and
teaching resources adopted in this methodology was
based in (Portela et al., 2016) that aims to enhance
the joint adoption of these items, through an iterative
cycle to meet the different learning profiles. The
education model of Portela et al. (2016) is based on
the learning cycle of Kolb (1984) and on the
iterative teaching methodology proposed in (Gary et
al., 2013).
In this context, the model focuses on reading
articles and experience reports, with the joint use of
PBL, discussion of practical cases, use of games, as
well as practical projects and student reflection on
the content learned and activities performed.
Therefore, each of the 4 units of the discipline are
composed of 6 stages: (1) Initiation; (2) Preparation;
(3) Discussion; (4) Practice; (5) Contextualization;
and (6) Reflection. Each stage is best described
below:
1. Initiation: the study of each unit begins from
the identification of a problem. For example:
"Is it possible for all products to conform to a
standard? And the variations?" This step is
strongly based on the PBL approach;
2. Preparation: this stage is executed by the
students parallel to all stages, as an out-of-class
activity. In it, the student will study the
ENASE 2018 - 13th International Conference on Evaluation of Novel Approaches to Software Engineering
426
material provided by the professor (videos,
articles, and books) to understand the topics;
3. Discussion: this stage consists of a traditional
class held by the professor followed by a
discussion about the subject so that the students
can solve most of their doubts to execute the
practical activities;
Table 1: Discipline Syllabus and Goals.
Topics
Expected Results
Level
1.1 Introduction
to processes
The student must know the
basic concepts and
representation of processes.
Remember
The student must be able to see
the relationship between the
quality of the process and the
quality of the product.
Remember
1.2 Processes
and
organizational
structure
The student must be able to see
the relationship between the
process and the organizational
structure.
Remember
1.3 Definition
and
implementation
of processes
The student must understand
the analysis and modeling of
processes.
Understand
The student must know the
management of the processes
implementation.
Remember
1.4 Decision-
making process
The student must understand
the decision-making process.
Understand
1.5 Critical
processes for the
business
The student must be able to
identify and select (under
supervision) the critical
processes of an organization.
Apply
2.1
Measurement
concepts
The student must know the
basics of software metering.
Remember
The student must be able to
understand how measurement
objectives should support the
organization's objectives.
Remember
2.2
Measurement
process
The student must be able to
define and execute (under
supervision) a measurement
plan.
Understand
and Apply
3.1 Introduction
to Statistical
Control
The student must be aware of
the importance of statistical
control.
Remember
3.2 Control
charts
The student must understand
the various types of control
charts.
Understand
The student must be able to
select the control charts that
best suit a situation.
Apply
3.3 Cause and
effect
assessment
The student must be able to
evaluate the measurement data
and identify the special causes
of process variation
Understand
and Apply
4.1 Assessment
of process
capability
The student must be able to
characterize the performance of
a process.
Apply
The student must be able to
establish performance models
for the process.
Apply
4.2 Improve of
process
The student must be able to
propose adjustments and
Apply
Topics
Expected Results
Level
performance
improvements to the process
performance models
4. Practice: students practice the knowledge
gained using games. The objective of this stage
is to allow the student to internalize and
develop the skills pertinent to the unit besides
favoring the aspects of iteration and
communication with the other students;
5. Contextualization: after completing the
previous steps, students will now finally
undertake a practical project to integrate all
skills acquired during the unit. In addition to
the technical skills, this experience allows
developing client negotiation skills, group
work, communication and evaluating solutions;
6. Reflection: the final step consists of the
students presenting the results obtained in the
practical project and reflecting on the
experience, answering 4 questions based on the
Scrum Sprint Retrospective ceremony: What
methods and techniques have been applied in
the development of the project? What were the
main difficulties of the team? What methods
and techniques not applied by the team could
have helped? What would the team change
when they re-run the project?
The way these steps will be reflected in the
teaching strategy of each unit is defined according to
the level of learning intended for the topic, where:
topics with the expected level of Remember will be
attended by the Discussion stage; topics listed as
Understand require the Practice step to be
accomplished; and topics where the student is
expected to reach the Apply level will be covered in
the Contextualization stage. Emphasizing that each
unit goes through all the stages of the cycle.
3.3 Play Activities and Practical
Projects Used
For each topic with the Remember or Apply level of
learning, a game and / or a practical project was
defined so that students can internalize the concepts
learned and apply them to solve real problems in the
context of statistical process control.
To contemplate the topic 1.3 a ludic activity
focused on the modeling and redesign of the process
is carried out. To that end, the students are divided
into teams with 4 members and are asked to make a
production line of aircraft with building blocks.
They receive the requirements and develop a
prototype, then begin the first building cycle without
A Methodology to Teaching Statistical Process Control in Computer Courses
427

the use of any process. Then they are asked to define
a process for building the aircraft and the second
building cycle begins. At the end, the results
obtained between the two cycles are compared and
they are asked to think of improvements for the
process used. A last building cycle is then started,
and the results are compared with the previous
cycles.
For the topic 1.4 a business game called “The
Beergame” (Riemer, 2008) is applied. In the
beergame students enact a four-stage supply chain.
The task is to produce and deliver units of beer: the
factory produces, and the other three stages deliver
the beer units until it reaches the customer at the
downstream end of the chain. The aim of the players
is to fulfil incoming orders of beer by placing orders
with the next upstream party. Communication and
collaboration are not allowed between supply chain
stages. Thus, students are organized into teams of 4
members and the game is played for 32 rounds. At
the end, students are questioned about how the
decision process took place and how the
communication between them could have improved
the results.
The topic 1.5 was reached through a practical
project where students are responsible for
identifying critical processes in a factory. Thus, after
the context briefing, students are organized into
pairs and receive the organization's process list along
with an interview with clients informing them about
the most important quality criteria. Students then
relate this information and use the Quality Function
Deployment (QFD) method applied to identify the
critical processes of this organization. At the end,
students should present the results and answer the
final questions of the reflection stage.
For the topic 2.2 two activities are performed, a
more playful activity to internalize Goal-Question-
Metric (GQM) concepts and a practical project
where students define and execute a measurement
plan. The play activity consists of simply developing
the GQM for everyday purposes. For example,
students are asked to think through some questions
and measures to achieve the goal of being a better
computer student. The activity is done in pairs and
lasts 30 minutes. In the practical project, students
receive the context of a software company that aims
to increase the number of clients served. Students
then, in pairs, should use GQM to relate the
organization's objectives to the measures, define the
collection and analysis procedures, and analyze the
data and provide suggestions to the software
company. For the students to be able to carry out all
these activities, the flow chart of the organization's
software development process and the measures that
were collected in the company's projects are
provided with the briefing. At the end, students
should present the results and answer the final
questions of the reflection stage.
For the topic 3.2 a play activity is performed
with a pair of dices, based on (Jones et al., 2008).
The goal is to teach the use of control charts through
the data collected on several rolls of a pair of dices.
Students are organized in pairs and are asked to
make 10 collections of 5 pitches with the given pair
of data. Each students pair has dices with a different
number of sides, ranging from 4 sides to 20. Then,
the values are recorded in a worksheet and a chart is
plotted. It is then asking if it is possible to improve
the variation obtained and what should be done for
it. New dices are distributed, preferably with fewer
sides, and again the 10 collections of 5 rolls are
carried out. At the end, the students compare the two
charts generated and are asked about what and why
the results happened.
For the topic 3.3 a practical project is carried out
that introduces students to the context of a factory
that is seeking to statistically control its building
process. Students then receive two sets of data and
are informed that they were collected daily. Based
on these data, students must choose and justify what
are the best control charts for the situation. In
general, they are expected to be able to at least select
a variable chart and an attribute chart, which would
include all the data provided. The dataset purposely
has some points outside the established limits so that
students can use the Ishikawa diagram to evaluate
the special causes. As a way of providing more
information, so that students can perform the
analysis, each collection will have some comment
relevant to what happened on the day. At the end,
students must present the results and answer the
final questions of the reflection stage.
The topic 4.1 is addressed through a practical
project where students are exposed to the context of
a football team and their game history in two
seasons of a championship. Students should then
assemble, for each season, three (3) baselines: one
for the number of points gained per round; one for
the goal balance per round; and one for the number
of hours trained per round. Students should then
calculate the limits of the control chart and evaluate
if there is any improvement in performance between
the two seasons. At this point, they will be informed
about what the expected club board of the team's
behavior in the field, thus characterizing the desired
behavior for the process, the customer's voice. Based
on this information, students check whether the
ENASE 2018 - 13th International Conference on Evaluation of Novel Approaches to Software Engineering
428

process is capable or not. Students are then asked to
establish a performance model for the next season,
for example, relating the number of hours trained
with the goal balance on a scatter chart. At the end,
students should present the results and answer the
final questions of the reflection stage.
Finally, in the topic 4.2 students also undertake a
practical project where they receive the flowchart of
a process and the baseline of performance that is not
stable. Based on context and observations, they
should be able to assess the special causes and
remove them. They then must mount a new baseline
and verify that the process has become stable but is
not able. Through suggestions for improvement,
students should work to let the process finally able.
A last baseline should be mounted to verify that the
process is stable and capable. At this point, the
professor questions about the possibility of
continuing to improve the process continuously. At
the end, students should present the results and
answer the final questions of the reflection stage.
4 PROPOSAL EVALUATION
A formal experiment is being planned, dividing the
population into a control group and an experimental
group, to evaluate the effectiveness of the planned
learning activities, at the application cognition level.
It is expected that this experiment design allows a
statistical comparison of the behavior observed in
the experimental group in relation to that observed
in the control group (Campbell and Stanley, 1963).
The experiment should be organized as follows:
1. Control and experimental groups will be
randomly distributed through a lottery. To help
the achievement of balanced groups, the
students will answer a personal background
and motivation questionnaires;
2. The interventions will be applied. The
experimental group will receive the learning
activities planned for the teaching approach and
the control group will attend to traditional
classes;
3. At the end, the two groups will carry out a
practical project, covering all the Statistical
Process Control topics taught during the
interventions, to evaluate the level of
application reached by the students. At this
time, the students will also respond to the
learning experience perception questionnaires.
A practical project will be applied as a test at the
end of the course aimed to collect data that could
answer the experiment objective. The practical
project aims to evaluate the students' application
level in relation to the topics of Statistical Process
Control. For this, the activity was contextualized to
the need of an academic to control statistically his
learning process during the semester, consisting of
opportunities to apply the necessary steps to
statistically control a process. The same test will be
applied to both groups of the experiment and will be
blinded corrected by two experts in the field.
The scores of this test will be calculated according
to Completeness and Correctness levels, where
Completeness is to use the expect tool or technique,
and Correctness is to correctly use the expected tool
or technique. The scores will be available to students
only at the end of the course.
The experiment is planned to be executed in the
first semester of 2018, in a class of Special Topics in
Software Engineering, which is part of the
curriculum of the Computer Science course of the
Federal University of Amapá. The class is an
elective course and has an open syllabus, where the
teacher is responsible for directing which Software
Engineering contents will be taught.
All participants in the experiment will be
volunteers and the discipline. Each group will hold a
weekly meeting lasting 100 minutes and the
experiment should last for 12 weeks. This is the time
available to this course during the academic
semester.
On the first week, the student will answer the
personal background and motivation questionnaires
and the groups will be distributed. The students in
the Experimental Group will receive the material
(videos, articles, and books) to study the contents of
first unit.
On second week, the interventions will start to be
applied to both groups. Both groups will attend to
lectures on topics “1.1 Introduction to processes”
and “1.2 Processes and organizational structure”
(100 minutes).
On third week, the Control Group will receive
lectures about “1.3 Definition and implementation of
processes” topic. The Experimental Group will carry
out the lucid activity with building blocks that
contemplates topic 1.3 (40 minutes) and the beer
game to topic “1.4 Decision-making process” (40
minutes).
On fourth week, the Control Group will receive
lectures about “1.4 Decision-making process” and
“1.5 Critical processes for the business” topics. The
Experimental Group will do the first practical
project on the content of 1.5 topic. The project is
planned to be executed under 60 minutes and the
students will have another 40 minutes to present the
A Methodology to Teaching Statistical Process Control in Computer Courses
429

results and answer the final questions of the
reflection stage. The Experimental Group also will
receive the material to study the contents of the next
unit.
On fifth week, the Control Group will receive
lectures on “2.1 Measurement concepts” and “2.2
Measurement process” topics. The Experimental
Group will attend to a lecture on 2.1 topic (40
minutes) and performer the playful activity to
internalize GQM (60 minutes).
On sixth week, the Control Group will receive
lectures on “3.1 Introduction to Statistical Control”
topic. The Experimental Group will carry out the
second practical project on 2.2 topic. The project is
planned to be executed under 60 minutes and the
students will have another 40 minutes to present the
results and answer the final questions of the
reflection stage. The Experimental Group also will
receive the material to study the contents of the third
unit.
On seventh week, the Control Group will attend to
lectures on “3.2 Control charts” and “3.3 Cause and
effect assessment” topics. The Experimental Group
will receive lecture on 3.1 topic (40 minutes) and
play the dice game to internalize 3.3 topic (60
minutes).
On eighth week, the Control Group will receive
lectures on “4.1 Assessment of process capability”
topic. The Experimental Group will do the third
practical project that covers 3.2 and 3.3 topics. The
project is planned to be executed in 60 minutes and
the students will have another 40 minutes to present
the results and answer the final questions of the
reflection stage. The Experimental Group also will
receive the material to study the contents of the last
unit.
On ninth week, the Control Group will receive
lectures on “4.2 Improve of process performance”
topic. The Experimental Group will attend to a
lecture on 4.1 topic (40 minutes) and performer the
Soccer Team playful activity to help internalize 4.1
and 4.2 topics (60 minutes).
The Control Group will not have a meeting on the
tenth week. The Experimental Group will do the
practical project that covers the last unit. The project
is planned to be executed in 60 minutes and the
students will have another 40 minutes to present the
results and answer the final questions of the
reflection stage. The Experimental Group also will
receive the material to study the contents of the last
unit.
On eleventh week, both groups will receive
instruction about the final practical project that will
covers all topics taught during the interventions and
will evaluate the level of application reached by the
students. The students will have a 3 days deadline to
submit the final project documents.
On last meeting, the scores report will be
presented to the students. The students will also
respond to the to the learning experience perception
questionnaires.
5 CONCLUSIONS
This work proposed a teaching methodology for
SPC where the learning process is student centered.
The methodology is composed of reading experience
reports, PBL, practical cases discussion, use of
games, practical projects, and reflections on the
contents learned. With this work, we hope to help
strengthen ties between academia and industry and
to provide professionals more adapted to these
organizations.
An experiment will be conducted to evaluate the
learning gain on the Statistical Process Control, at
the application level, provided by the teaching
approach compared to traditional classes in
undergraduate courses in Computing, and the results
obtained will be described and presented later in
other papers.
This experiment will be considered as a first
explanatory study to gain insight into the learning
effectiveness of the proposed approach and its
weaknesses, as well as suggestions for improvement
by the participants. Therefore, it is acceptable that
the significance of the results could be weak due to
the threats to validity to be found.
REFERENCES
ACM/IEEE, 2013. Computer science curricula 2013.
Curriculum guidelines for undergraduate degree
programs in Computer Science.
Alhassan, M. A., Jawawi, D. N., 2014. Sequential Strategy
for Software Process Measurement that Uses
Statistical Process Control. in: 8th Malaysian Software
Engineering Conference (MySEC). pp. 37-42.
SOFTEX - Association for Promotion of Brazilian
Software Excellence, 2016. SPI Reference Model for
Software, version 2016. SOFTEX, General Guide SPI
for Software.
Barcellos, M. P., Falbo, R. A., Rocha, A. R., 2010.
Establishing a Well-Founded Conceptualization about
Software Measurement and High Maturity Levels. in:
2010 7th International Conference on the Quality of
Information and Communication Technology, pp. 467-
472.
ENASE 2018 - 13th International Conference on Evaluation of Novel Approaches to Software Engineering
430

Bessa, B., Cunha, M., and Furtado, F., 2012. ENGSOFT:
Simulation tool for real environments to support the
Problem Based Learning (PBL) in teaching Software
Engineering, XX Workshop on Computer Education,
Curitiba, Brazil, 2012.
Bloom, B. S., 1956. Taxonomy of Educational Objectives:
The Classification of Educational Goals. Handbook I,
Cognitive Domain: Longmans.
Boffoli, N., Bruno, G., Caiavano, D., Mastelloni, G., 2008.
Statistical Process Control for Software: A Systematic
Approach. Proceedings of the Ninth European
Conference on Software Maintenance and
Reengineering, pp. 288-293.
Campbell, D. T. and Stanley, J. C., 1963. Experimental
and Quasi-Experimental Designs for Research.
Chicago, IL, USA: Rand McNally.
Fernández-Corrales, C., Jenkins, M., Villegas, J., 2013.
Application of Statistical Process Control to Software
Defect Metrics: An Industry Experience Report. in:
2013 ACM/IEEE International Symposium on
Empirical Software Engineering and Measurement,
pp. 323-331.
Furtado, J., Oliveira, S., 2017. A study on perception of
the usefulness of statistical process control in software
development organizations: an application of survey.
14º CONTECSI - International Conference on
Information Systems and Technology Management.
García, F., Serrano, M., Cruz-Lemos, J., Ruiz, F., Piattini,
M., 2007. Managing Software Process Measurement:
A Metamodel-Based Approach. Information Sciences,
v. 177, n. 12, pp. 2570-2586.
Garg, K., Varma, V., 2008. Software Engineering
Education in India: Issues and Challenges.
Proceedings of 21st Conference on Software
Engineering Education and Training, Charleston, pp.,
110-117.
Gary, K., Lindquist, T., Bansal, S., Ghazarian, A., 2013. A
Project Spine for Software Engineering Curricular
Design. In Proceedings of 26th Conference on
Software Engineering Education and Training
(CSEET), pp. 299-303.
Gnatz, M. et al., 2003. A Practical Approach of Teaching
Software Engineering. Proceedings of the 16th
Conference on Software Engineering Education and
Training (CSEET’03). Madrid: IEEE. p. 120-128.
Jones, M. P., Hawkins, R. S., Smith, R., 2008. Enhancing
student understanding of Control Charts using a dice
activity. The Technology Interface, Spring.
Kolb, D., 1984. Experiential Learning: Experience as the
Source of Learning and Development”. NJ: Prentice-
Hall.
Lethbridge, T., 2000. What knowledge is important to a
software professional?, Journal Computer, 33(5), IEEE
Computer Society Press, Los Alamitos, CA, USA, pp
44-50.
Malik, B.; Zafar, S., 2012. A Systematic Mapping Study
on Software Engineering Education. International
Journal of Social, Behavioral, Educational, Economic,
Business and Industrial Engineering, v. 6, n. 11.
Marques, M. R.; Quispe, A.; Ochoa, S. F., 2014. A
Systematic Mapping Study on Practical Approaches to
Teaching Software Engineering. Frontiers in
Education Conference. Madrid: IEEE. p. 1-8.
Nunes, D. J., Yamaguti, M. H., Nunes, I., 2016.
Refinement of student competences of the software
engineering course. IX Forum on Education in
Software Engineering, p. 143-146.
O’Leary, C., Lawless, D., Gordon, D., Haifeng, L.,
Bechkoum, K., 2006. Developing a Software
Engineering Curriculum for the Emerging Software
Industry in China. 19th Conference on Software
Engineering Education & Training (CSEET'06), pp.
115-122.
Portela, C. S., Vasconcelos, A., Oliveira., S., 2016.
FRAMES: A framework to teaching-learning the
software engineering topics in ACM/IEEE and SBC
curricula. IX Forum on Education in Software
Engineering, Maringá, Brazil.
Prikladnicki, R., Alburqueque, A., Wangenheim, C., and
Cabral, R., 2009. Teaching software engineering:
challenges, teaching strategies and lessons learned in
Proceedings of II Forum on Education in Software
Engineering, Fortaleza, Brazil.
Riemer, K., 2008. The beergame in business-to-business
eCommerce courses – a teaching report. 21th Bled
eConference e Collaboration, Slovenia.
SEI - Software Engineering Institute, 2010. CMMI® for
Development, Version 1.3, Improving processes for
developing better products and services.
No.CMU/SEI-2010-TR-033. Carnegie Mellon
University, Pittsburgh, PA, USA.
Taran, G., Rosso-Llopart, M., 2007. Software Engineering
Education in Russia: A Comparative Study of People,
Process and Technology: A Four-Year Perspective.
20th Conference on Software Engineering Education
& Training (CSEET'07).
Tarhan, A., Demirors, O., 2008. Assessment of Software
Process and Metrics to Support Quantitative
Understanding. Lecture Notes in Computer Science, v.
4895, pp. 102-113.
Wangenheim, C., Silva, D., 2009. What software
engineering knowledge is important for the
professional software? in Proceedings of II Forum on
Education in Software Engineering, Fortaleza, Brazil.
A Methodology to Teaching Statistical Process Control in Computer Courses
431
