
Trading Network Performance for Cash in the Bitcoin Blockchain
Enrico Tedeschi, H
˚
avard D. Johansen and Dag Johansen
UIT The Arctic University of Norway, Tromsø, Norway
Keywords:
Bitcoin, Blockchain as a Service, Longitudinal Study, Performance, Transaction Latency.
Abstract:
Public blockchains have emerged as a plausible cloud-like substrate for applications that require resilient
communication. However, sending messages over existing public blockchains can be cumbersome and costly
as miners require payment to establish consensus on the sequence of messages. In this paper we analyze the
network performance of the Bitcoin public ledger when used as a massaging substrate. We present several
real-world observations on its characteristics, transaction visibility, and fees paid to miners; and we propose
two models for fee-cost estimation. We find that applications to some extent can improve messaging latency
by paying transaction fees. We also suggest that spendings should be kept below 300 Satoshi per byte.
1 INTRODUCTION
The Blockchain technology used by popular crypto
currencies like Bitcoin
1
and Ethereum, are essen-
tially Peer-to-Peer (P2P) broadcast oriented Group
Communication Systems (GCSs) (Cheriton and
Zwaenepoel, 1985), where all members see all mes-
sages, and in the same order. With a built-in fee sys-
tem that enables operators to make money for storing
and forwarding messages, several decentralized P2P
blockchain systems have emerged, providing a com-
mon ground for mutually distrusting entities to com-
municate. Due to their promise of highly resiliency,
blockchain-as-a-service is currently being touted as
a promising permissionless cloud-like building block
for critical services in, for instance, the finance and
health domains.
Unlike traditional multicast oriented GCSs like
Horus (van Renesse et al., 1996) and Totem (Moser
et al., 1996), blockchains have the unique prop-
erty that all broadcast messages are kept and made
available to all participants, potentially for the sys-
tem’s lifetime. For blockchains, consensus among
participants on the total ordering of messages, and
hence also consensus on the resulting data-structure
or ledger, is achieved through computational puzzles
that randomly grant members a time-limited exclusive
right to dictate the next batch of messages to be put on
the channel.
As with other permissionless systems such as Se-
cureRing (Kihlstrom et al., 1998) and Fireflies (Jo-
1
The Bitcoin currency is denoted BTC or B.
hansen et al., 2015) that are designed to be highly
resilient to intrusions and attacks, providing reliable
service by masking Byzantine failures limits scalabil-
ity. Because blockchains are designed to retain all
messages, they are particularly vulnerable to denial-
of-service through simple flooding attacks. If an at-
tacker can send messages at an unbounded rate, he
can quickly swamp the storage and network capac-
ity of the service. Even benign usage might prove
problematic. For instance, if Bitcoin would have the
same transaction rate as a VISA circuit, with between
2000 to 56 000 transactions/sec (Croman et al., 2016),
its blockchain structure would grow about 1 MB per
3 seconds.
To throttle its blockchain growth rate, Bitcoin ad-
justs the difficulty of its cryptographic puzzles to
match the aggregate mining capacity of the network,
towards a target average block creation time of 10 min
per block. In combination with its current block size
limit of 1 MB, Bitcoin’s transfer capacity is roughly
a meager 1.667 kBps, or approximately three trans-
actions per second. This capacity is shared between
all concurrent clients. Indeed, scalability and net-
work performances are urgent concerns in existing
Blockchain-based systems.
This paper presents key observations from our on-
going longitudinal study on the performance of the
Bitcoin blockchain. We provide detailed insights and
analysis on several important characteristics of Bit-
coin, including paid fees and the size of blocks, and
show how the rewards to miners have changed over
time from a more recent view point compared to ear-
lier studies (M
¨
oser and B
¨
ohme, 2015; Rizun, 2015).
Tedeschi, E., Johansen, H. and Johansen, D.
Trading Network Performance for Cash in the Bitcoin Blockchain.
DOI: 10.5220/0006805906430650
In Proceedings of the 8th International Conference on Cloud Computing and Services Science (CLOSER 2018), pages 643-650
ISBN: 978-989-758-295-0
Copyright
c
2019 by SCITEPRESS – Science and Technology Publications, Lda. All rights reserved
643

Furthermore, we analyze the correlation between the
fee paid from a transaction and its latency, or the time
it takes to become visible in the whole network. We
propose two different models to describe how appli-
cations should spend money to improve network per-
formance. Although the studies presented in this pa-
per are restricted to the Bitcoin system, we conjecture
that our observations are transferable to similar P2P
systems that rely on computational expensive proof-
of-work for consensus and fee-based incentives.
2 BACKGROUND
This paper considers blockchains as a communication
substrate, where a set of client or application pro-
cesses communicate by sending and receiving mes-
sages. In blockchain systems, a message is often re-
ferred to as a transaction, a notation we also adapt
in this paper. The blockchain substrate handles all
transactions in batches, known as blocks. Each block
B can be in one of two states: proposed or accepted,
and might contain zero or more transactions from zero
or more clients. The system in permissionless in that
there exist no central authority that coordinate or reg-
ulate participation or usage.
A blockchain has one or more miner processes
that act as the ingress points for transactions submit-
ted by the clients. The set of all miners collaborate
to decide on which transactions to admit and their or-
dering. Every miner has a mempool containing the
new and unapproved transactions. Applications are
free to submit transactions to any miner’s mempool,
and miners are free to choose which transactions to
include in their blocks. Most blockchain systems, in-
cluding Bitcoin, enforce a strict upper bound Q on
the block size, which also limits the number of trans-
actions each block can contain.
The blockchain data structure, often referred to
to as a ledger, is maintained by a P2P overlay net-
work where members cooperate to verify and dis-
tribute blocks such that each member process has a
full replica of the data structure in local storage. The
integrity of the data structure is dependent on con-
sensus among the set of correct member processes
on which blocks are in the blockchain and their to-
tal order. For this, existing blockchain systems, like
Bitcoin, use the Nakamoto consensus protocol. This
protocol relies on members solving computationally
complex cryptographic puzzles as proof-of-work for
admitting new blocks, commonly referred to as min-
ing. Once a miner has solved a puzzle, it broadcasts
the block along with a solution to the puzzle so that
all other nodes can check its correctness. The block is
then tentatively recorded in the blockchain.
In the early days of Bitcoin, it was possible to
mine productively with commodity desktop or laptop
computers. Nowadays, successful miners use highly
specialized hardware called Application Specific In-
tegrated Circuitss (ASICs) (Taylor, 2017), which typ-
ically offer up to 100 times improved performance
over commodity CPUs and GPUs.
The cost associated with mining was defined by
Rizun (2015) to be:
hCi = ηhT (1)
Here η is the cost per generated hash, h is the miner’s
individual hash rate and T is the block creation time.
Hence, the block creation time is directly proportional
to the hashing cost. The underlying assumption of
proof-of-work consensus is that the high η value, due
to the energy cost of mining, will discourage and limit
malicious behavior. At the same time, benign partici-
pation is promoted by means of incentives: the nodes
receive payment as a reward for solving puzzles.
As miners compete to solve the latest puzzle, it
may happen that two or more nodes succeed at ap-
proximately the same time. This may result in dif-
ferent blocks with different transactions being pro-
posed for the blockchain. Thus, proposing further
blocks may result in different chains, often referred
to as a fork. To break such ties, Bitcoin adopts
the simple rule that the longest consecutive chain of
blocks wins. Therefore, a tentative block of transac-
tions may be discarded, which is known as orphaning.
The recording of a block is only considered perma-
nently accepted after five additional blocks have been
added, approximately after 1 hour. Thus, eventually
the nodes reach consensus on the ordering of all the
blocks on the blockchain.
Given a transaction t from some client c
1
to some
other client c
2
, we have the following:
Definition 1. The commit latency of a transaction t
is the time from when c
1
first proposes a transaction t
to a mining pool, to when some block B including t is
first mined and permanently accepted.
Note that the total end-to-end latency of t also in-
cludes the time it takes for B to be delivered to c
2
.
However, as blockchain clients must pull the system
for updates, the last-hop delivery time will depend to
the application specific pull interval. For generality,
this paper will therefore only consider the commit la-
tency.
In existing blockchain systems, miners can freely
choose which transactions to include when propos-
ing a new block. A client must therefore negotiate
with miners to have its transactions included. To en-
tice miners, each transaction t can include a transac-
tion fee t
f
paid by the sender to be claimed by the
CLOSER 2018 - 8th International Conference on Cloud Computing and Services Science
644

miner whom first successfully include t in an accepted
block. Due to the cost of mining, most miners are as-
sumed to behave rationally (Aiyer et al., 2005): fol-
lowing the blockchain protocol, but such that their
mining rewards are optimized. Hence, we conjecture
that it is possible to use the transaction fee mechanism
to improve messaging performance, which will be the
focus of the remainder of this paper.
3 OBSERVATIONS
In this section we describe key observations and in-
sights from our studies on the public Bitcoin ledger.
These form the basis of our latency-fee models in Sec-
tion 4. We start this section, however, by describing
our method for collecting observational data.
3.1 Methodology
There are several methods that can be used to study
Bitcoin. Real-time analysis requires setting up and
operating one or more full Bitcoin nodes that connect
to the P2P network and record traffic. The advan-
tages of this approach is that some of the inner-node
communication can sampled, including block propa-
gation time and orphaning rate. However, to obtain
usable coverage, multiple geographically dispersed
nodes must be set up and injected into the network.
Each one must download and store the full ledger and
participate in the forwarding of new blocks. At time
of writing, the full ledger of data requires 250 GB of
storage. This requires significant up-front hardware
investments and might potentially disrupt some of the
system’s characteristics that are under study.
Another approach is to use the Bitcoin Core appli-
cation (van der Laan et al., 2017), which downloads
the full ledger into local storage, but without having to
run the full P2P protocol. Retrieved data does, how-
ever, not include the block propagation time or infor-
mation from miners, which we require for our studies.
Downloading the full ledger can also take significant
time (in our case it took four days), and requires sig-
nificant available disk capacity.
In our studies, we instead adapted a similar
methodology to the one used by M
¨
oser and B
¨
ohme
(2015), collecting data from some of the many online
third-party APIs, made available by various organiza-
tions that are already monitoring the Bitcoin system,
including tradeblock.com and blockchain.info. Web-
sites like coinbase.com also provide useful informa-
tion about the money exchange price, and provide an
API along with libraries, like forex-python,
2
which we
2
https://pypi.python.org/pypi/forex-python
Date
< .001
> .01
< .0002
< .0005
BTC/byte
< .0001
0
%
2017-06
2016-08
2015-10
2014-12
2014-02
2013-04
0
100
60
80
40
20
Figure 1: Observed transaction fee (t
f
) distribution from
2013 to 2017.
used.
Data was retrieved from these public APIs,
and collected as JavaScript Object Nota-
tion (JSON) objects stored locally in Pandas
data frames (Augspurger et al., 2012). Some data
not available in these APIs directly, was instead
scraped from the sites’ HTML pages. The data was
processed and visualized with Matplotlib (Hunter
et al., 2017) and Seaborn (Waskom et al., 2016). This
approach enabled us to analyze a considerable part
of the blockchain with little up-front investment in
computational resources.
For this paper, we elected to study data in the
range from April 2013 to September 2017, sam-
pling more than 120 million transactions and 100000
blocks. Several studies have already been conducted
on Bitcoin data before 2013 (Croman et al., 2016;
Houy, 2014; M
¨
oser and B
¨
ohme, 2015; Rizun, 2015),
and the popularity of the system before 2011 was
low. Interpreting data outside our selected date range
would probably not generate new insight. Table 1
names and summarizes the exact segments retrieved
and used in this paper.
3.2 Transaction Fees
In this section, we present our observations on how
the transaction fees t
f
, paid by the clients to the min-
ers, have changed over time. For each transaction t,
The fee t
f
is the difference between the sum of all in-
put values t
in
and the sum of every output values t
ou
.
If n is the number of inputs and m is the number of
outputs, then we have:
3
3
The unit of Equation 2 is B.
Trading Network Performance for Cash in the Bitcoin Blockchain
645
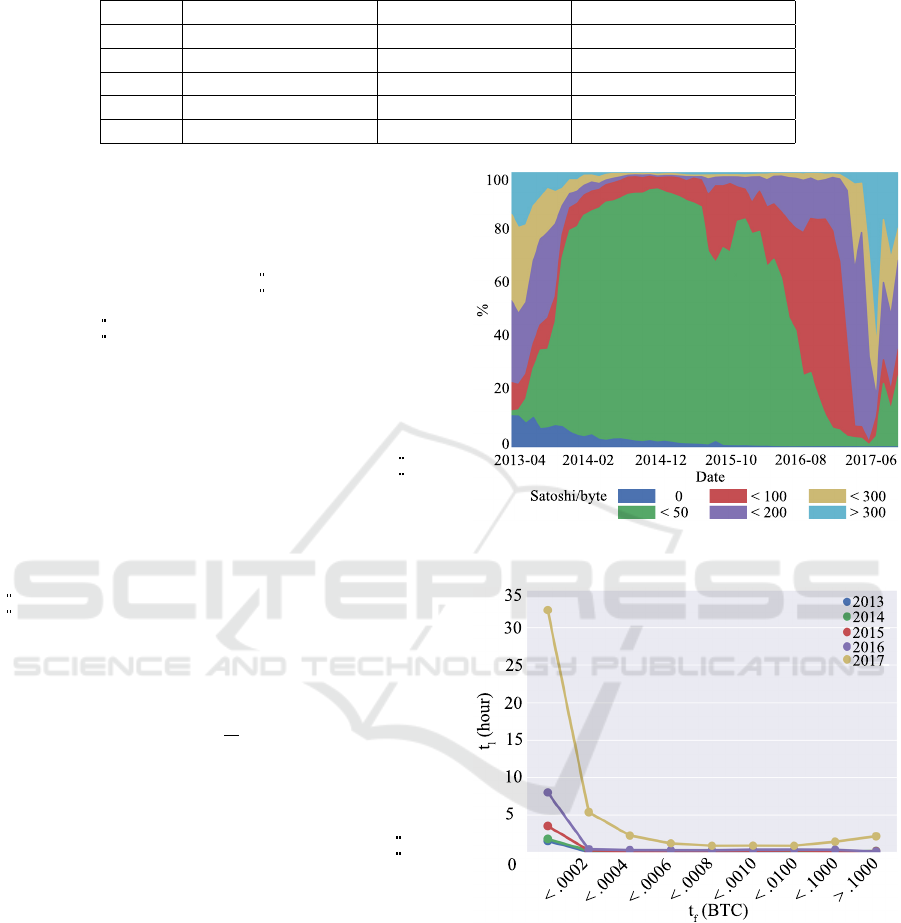
Table 1: Bitcoin blockchain regions analyzed.
Name Start Date End Date Block Height Range
2009 09-01-2009 03:54:25 08-03-2009 06:31:22 1 – 6710
2011 01-04-2011 19:58:59 09-05-2011 12:58:13 116 167 – 122876
2013 21-04-2013 03:03:51 01-06-2013 12:37:51 232 333 – 239042
2015 21-03-2015 04:01:39 06-05-2015 14:37:12 348 499 – 355208
2017 15-12-2016 18:17:45 19-06-2017 12:04:23 443 599 – 471951
t
f
=
n
∑
i=1
t
in
i
−
m
∑
i=1
t
ou
i
(2)
Figure 1 plots the calculated values for t
f
in blocks
from 2013 to late 2017, categorized into six payment
classes ranging from 0 to 0.01
B. As we can see in
the figure, in the first half of 2016 fees between 0
and 0.0001 B almost disappeared. Considering that
the Bitcoin price raised from less than 1000 USD to
more than 5000 USD between mid 2016 and second
half of 2017, this is indicative of a huge increment in
the monetary value collected by miners. If we com-
pare the Bitcoin price and the fee paid in USD, we see
a substantial co-movement, which indicates that B is
the dominant unit to consider when deciding about
what fee to offer.
Because the number of bytes per transaction can
vary in all major blockchain systems today, including
Bitcoin, an interesting metric to study is how many
B per bytes a transaction t has to offer in payment
to miners. This metric is known as the fee density
t
ρ
(Rizun, 2015). For some transaction t, with asso-
ciated fee t
f
and having a payload of t
q
bytes, the fee
density is defined as:
t
ρ
=
t
f
t
q
. (3)
Figure 2 plots the observed fee density, similarly
to the fee plot in Figure 1. The observed average
transaction size t
q
is 500 B. At the end of 2017, we
see some transactions offering less than 0.0001 B in
payment. We observe almost no transactions with fee
density t
ρ
= 0. This indicates that density has be-
come an important metric for miners when deciding
whether or not to include a transaction in their next
block.
3.3 Transaction Latency
As shown above, a blockchain-based application may
attempt to offer various mining fees to improve the
commit latency of its messages. In the following we
will investigate to what extent we are able to do so in
practice.
The experienced commit latency t
l
of most trans-
actions can relatively easily be observed in the ava-
iable data. All transaction are timestamped when
Date
0
< 300
> 300
< 100
< 200
Satoshi/byte
< 50
%
2017-06
2016-08
2015-10
2014-12
2014-02
2013-04
0
100
60
80
40
20
Figure 2: Observed fee density (ρ) distribution from 2013
to 2017.
2013
2014
2015
2016
2017
35
30
25
20
15
10
5
0
< .0002
< .0004
< .0006
< .0008
< .0010
< .0100
< .1000
> .1000
t
f
(BTC)
t
l
(hour)
Figure 3: Relation between t
l
and t
f
grouped by year.
added to a mining pool, and blocks are similarly
timestamped when mined.
Let B
epoch
be the timestamp of some block B con-
taining the transaction t, and let t
epoch
be the times-
tamp of when that transaction was first added. Then
the commit latency of observed transactions t can
simply be calculated from:
t
l
= B
epoch
−t
epoch
(4)
Figure 3 plots the observed transaction latency (in
hours) against the five fee density classes for each
CLOSER 2018 - 8th International Conference on Cloud Computing and Services Science
646
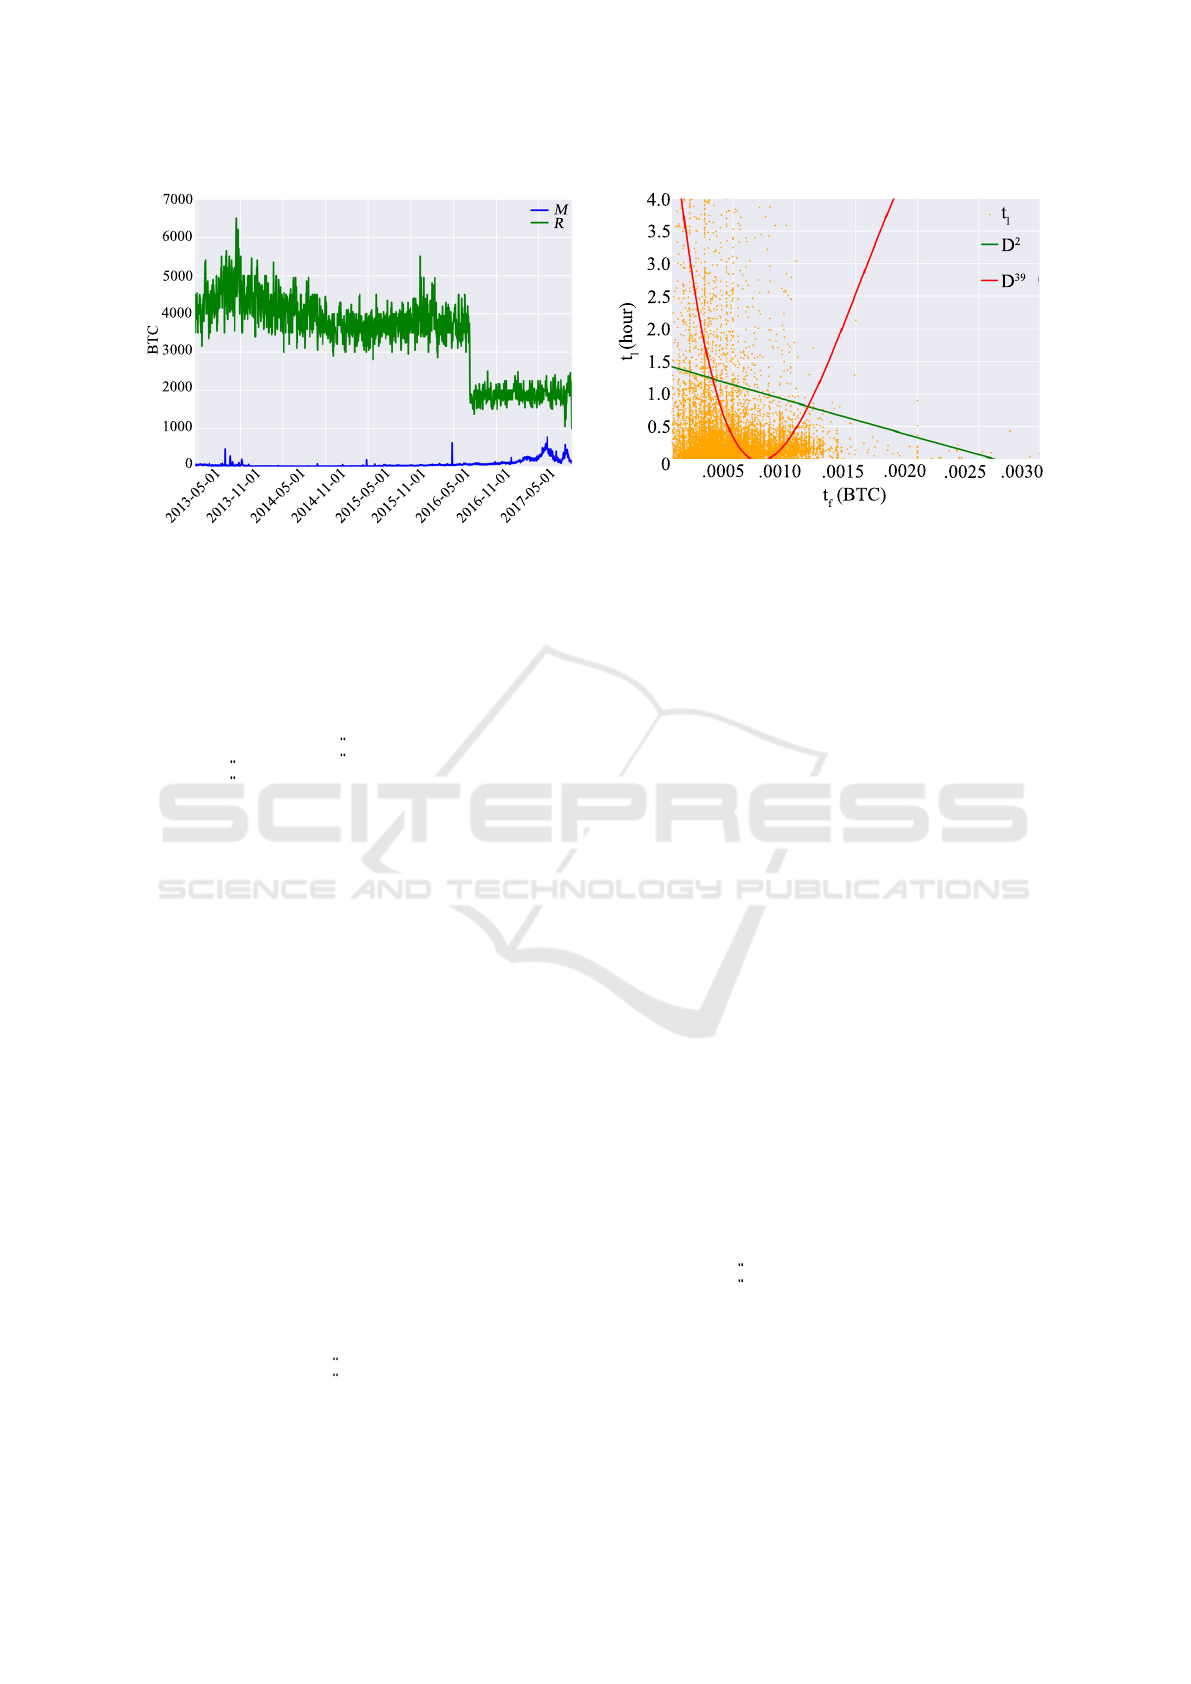
BTC
7000
6000
5000
4000
3000
2000
1000
0
2013-05-01
2013-11-01
2014-11-01
2014-05-01
2015-05-01
2015-11-01
2016-05-01
2016-11-01
2017-05-01
Figure 4: Daily miners revenue divided in block reward R
and the sum of transaction fees M.
year included in our study. In all cases, we observe
that paying transaction fees gave a significant boost
to latency, and that in 2017 doing so became more
important than previously. We also observe the exis-
tence of a threshold from where increasing payment
has little effect. For the years 2013–2016, the thresh-
old was around 0.0002 B, while in 2017 it increased
to 0.0006 B.
In addition to the total mining reward (M) from
all transaction fees in a block, miners also receive a
block reward (R) for each mined block. The block
reward has historically been an important incentive
for miners to produce blocks, regardless of the trans-
action fees offered by clients. However, the reward
mechanism in Bitcoin is designed to halve the size of
R every 210 000 blocks. As can be seen in Figure 4,
in the period from 2009 to 2013 miners had little con-
siderations for the transaction fees, and relied more
on the reward R. In mid 2016, when the block reward
was last halved, we observe a clear shift in how the
miners profit from their efforts, becoming more influ-
enced by the transaction fees.
This observation is not surprising as we expect
most miners to be rational (Aiyer et al., 2005), trying
to optimize their profit. With less block reward, ratio-
nal miners will need to prioritize transactions with a
higher fee density over lower ones until the max block
size is reached. If the total fee of the included transac-
tions is less than the expected monetary cost of min-
ing the block hCi, the miner may even opt to wait until
a higher density transaction arrives. This can signifi-
cantly increase experienced commit latency and jitter.
We expect M to overcome R by 2020 when the reward
is halved again to 6.25
B. Hence, for applications that
intend to use blockchain as a service for communi-
cation, there is a clear potential and need for clever
usage of the transaction fee mechanism to optimize
t
l
D
2
D
39
t
l
(hour)
0.5
1.5
2.0
2.5
3.0
3.5
4.0
1.0
0
.0005
.0010
.0015
.0020
.0025
.0030
t
f
(BTC)
Figure 5: Fee-latency interpolation F with a 2 and 39
degrees polynomials for Bitcoin transactions analyzed in
2017.
the commit latency and the monetary cost of sending
messages.
4 MODELS
With data from the 2017 transactions, we generated
two models that applications can use when deciding
what transaction fees to offer.
4.1 Fee-latency
The first model F describes the expected latency of
some transaction t given some transaction fee t
f
. We
compute two variants of F using polynomial regres-
sion: one of degree 2 (F
2
) and one of degree 39 (F
39
).
The lower degree regression is used to show the gen-
eral trend, while the higher degree one is used to
show the utility threshold. The resulting regressions
are shown in Figure 5. Measured Mean Absolute Er-
ror (MAE) was 1.755 for F
2
and 1.7476 for F
39
. For
some given transaction fee x, the function F
2
is given
by
F
2
(x) = 6248x
2
− 555.8x + 1.42 (5)
From the plot of F
2
, we we see a clear linear
trend that transactions offering higher fees experience
lower commit latency, which is what we expected.
From F
39
in Figure 5, we also see a clear threshold
at about 0.007 B when the benefits of adding extra fee
starts declining.
4.2 Fee Density-latency
As argued in Section 3.2, miners nowadays tend to
select transactions based on fee density, rather than
solely on the fee amount. We therefore generate a
Trading Network Performance for Cash in the Bitcoin Blockchain
647

ρ (Satoshi/byte)
t
l
F
39
F
2
t
l
(hour)
0.5
1.5
2.0
2.5
3.0
3.5
4.0
1.0
0
100 200
300
400 500
600
700
Figure 6: Fee density vs latency interpolation with a 2 and
39 degrees polynomial for Bitcoin transactions analyzed in
2017.
model D that provides the expected latency t
l
as a
function of the fee density t
ρ
= t
f
/t
q
.
Similar to F, we compute two variants of D us-
ing polynomial regression: one of degree 2 (D
2
) and
one of degree 39 (D
39
). The resulting regressions are
shown if Figure 6. Measured MAE was 1.749 for D
2
and 1.837 for D
39
.
Similarly to F, we also observe in D a clear trend
that offering higher fee-density transactions improves
commit latency. The threshold for diminishing re-
turns is about 300 Satoshi per byte.
4
Paying a higher
fee per byte gives little improvements The calculated
polynomial for D
2
is given by:
D
2
(x) =
5.416
10
8
x
2
−
2.215
10
3
x + 1.598 (6)
5 DISCUSSIONS
When Bitcoin was first released, one of its strengths
was its decentralized P2P architecture. Miners could
join the network all over the world, and more miners
meant a more robust service.
Over the years though, the opportunities to ex-
change block and transaction rewards into hard cash
enticed more and more people around the world to
join the mining effort and make money. This in-
creased the total hashing power of the system, but also
increased the difficulty of the proof-of-work puzzle,
as Bitcoin is designed to do. Eventually the puzzles
became too difficult for most individual casual miners
to solve, and people started teaming up into mining
pools to share both computational power and profit.
Today only a few large mining pools remain, and
the ability of the system to make progress has to a
large extent been centralized. Still, the mechanisms
4
1 Satoshi = 0.000000 01B.
controlling mining are governed by marked forces
that remain to be exactly described. This may be a
difficult task as most large mining pools withhold in-
formation about their number of miners, the hardware
they use, their profit, their transaction selection crite-
ria, etc. Observational studies, like the one described
here, might be the only plausible method for under-
standing the mechanisms governing these systems.
Towards that end, Table 2 summarizes our find-
ings by listing the effect of changing two key design
parameters in Bitcoin: the block size Q and the block
creation time T . Decreasing Q might first appear as
a good solution for the number of advantages it has.
However, its few disadvantages are critical for both
performance and scalability. We therefore deem that
decreasing Q is ill judged. It is likely much easier to
deal with the orphan rate amplification resulting from
increasing Q.
For the block creation time T , we have the oppo-
site scenario. An increment in T will reduce perfor-
mance as miners will make less profit and thus have
less incentive to mine. The only advantage is a lower
orphaning rate since blocks will have more time to
propagate.
As we can observe from Table 2, the throughput
γ increase when either the block size Q is raised or
the creation time T is lowered. According to Croman
et al. (2016), the block size should not exceed 4 MB
given T = 10 min. A good compromise could be to
increase the block size limit to 1.5 MB and lower the
creation time to 8 min. In that way, the system have
a potential throughput capacity of 3.20 kBps and 10
transactions per second.
We cannot find a clear and general relation be-
tween Q and t
f
in our studies. They seem to relate
only when the drastic change in the block size oc-
curs. We do, however, find that from 2013 to 2017
the relation between t
f
and t
l
became more notice-
able day-by-day, having almost an inverse proportion-
ality in the latest data from 2017, as seen in Fig-
ure 3. In 2017, zero-fee transactions almost disap-
peared from the system. This is probably due to the
incredibly high commit latency many clients were ex-
periencing at that time, with zero-fee transactions tak-
ing up to an average of 33 h to get committed into
blocks. At the same time, clients that paid only mod-
est transaction fees, less than 0.0002 B, experienced
commit latencies of only 5 h, while the ones that paid
between 0.0008 B and 0.0010 B expected latencies
of less than 1 h. Hence, applications that intend to
use blockchains as a service for communication will
benefit from having a dynamic fee-latency prediction
model, like the one described here, to optimize per-
formance.
CLOSER 2018 - 8th International Conference on Cloud Computing and Services Science
648

Table 2: Scalability and performance tradeoffs when changing block size Q and block creation time T .
Higher ↑ Lower ↓
Q
+ improved scalability with more transactions
accepted per day
+ improved commit latency t
l
± lower fees (good for clients, bad for miners)
− orphan rate amplification
− increased centralization
− congestion concern solved with transaction
eviction by miners
− no permanent effect
+ no transaction spam
+ no 0-fee transactions
+ less mining cost
+ less propagation time
+ less chance of orphaning
± higher fees (good for miners bad for clients)
− less throughput
− higher commit latency t
l
T
+ lower orphaning rate
+ no physical changed needed to support faster
inner node communication
− lower throughput γ (unless Q is increased)
− less scalable (unless Q is increased)
− mining profit is confined
+ higher throughput γ
+ system is more scalable
+ increased mining profit
− require faster inner-node communication
− exponential increment of orphaning rate
6 CONCLUSION
The Bitcoin blockchain has undoubtedly emerged as
a notable substrate and service for communication.
The built in mechanism for gaining monetary value
by doing useful work for others has clearly moved the
underlying architecture from its initial P2P model, to
a more centralized model resembling a public cloud-
like service. Individual incentives for providing the
service is no longer motivated by own needs for it, but
rather motivated by the prosperity of earning money.
Although the service provided by the Bitcoin sub-
strate is highly robust, it is also painstakingly slow.
Commit latencies of transactions are often measured
in hours. Applications that intend to use Bitcoin, or
one of its derivatives, as a public cloud-like service
for communication, can still improve their messaging
performance by adjusting the offered transaction fee
to the number of bytes sent. There are, however, clear
limits to what can be achieved. For Bitcoin, spend-
ing more than 300 Satoshi per byte seems to be inef-
fective. As the incentives to mine new blocks shift
focus from block fees to transaction fees in the years
to come, we expect that new schemes for optimizing
messaging performance needs to be developed.
ACKNOWLEDGMENT
This work was supported in part by the Norwegian
Research Council project number 263248. We would
like to thank the anonymous reviewers for their useful
insights and comments.
REFERENCES
Aiyer, A. S., Alvisi, L., Clement, A., Dahlin, M., Martin, J.-
P., and Porth, C. (2005). Bar fault tolerance for coop-
erative services. In Proceedings of the Twentieth ACM
Symposium on Operating Systems Principles, SOSP
’05, pages 45–58, New York, NY, USA. ACM.
Augspurger, T., Bartak, C., Cloud, P., Hayden, A., Hoyer,
S., McKinney, W., Reback, J., She, C., Horikoshi, M.,
den Bossche, J. V., et al. (2012). Pandas: Python Data
Analysis Library. software v0.21.0, Pandas commu-
nity.
Cheriton, D. R. and Zwaenepoel, W. (1985). Distributed
process groups in the V kernel. ACM Transactions on
Computer Systems, 3(2):77–107.
Croman, K., Decker, C., Eyal, I., Gencer, A. E., Juels, A.,
Kosba, A., Miller, A., Saxena, P., Shi, E., G
¨
un Sirer,
E., Song, D., and Wattenhofer, R. (2016). On scal-
ing decentralized Blockchains. In Financial Cryptog-
raphy and Data Security. FC 2016., volume 9604 of
LNCS, pages 106–125, Berlin, Heidelberg. Springer
Berlin Heidelberg.
Trading Network Performance for Cash in the Bitcoin Blockchain
649

Houy, N. (2014). The economics of Bitcoin transaction
fees. Working Papers 1407, Groupe d’Analyse et de
Th
´
eorie Economique (GATE), Universit
´
e Lyon 2.
Hunter, J., Dale, D., Firing, E., Droettboom, M., et al.
(2017). Matplotlib for data plotting. software v2.1.1.
Johansen, H. D., van Renesse, R., Vigfusson, Y., and Jo-
hansen, D. (2015). Fireflies: A secure and scalable
membership and gossip service. ACM Transactions
on Computer Systems (TOCS), 33(2):5:1–5:32.
Kihlstrom, K. P., Moser, L. E., and Melliar-Smith, P. M.
(1998). The SecureRing protocols for securing group
communication. In Proc. of the 31st Annual Hawaii
International Conference on System Sciences, pages
317–326. IEEE.
Moser, L. E., Melliar-Smith, P. M., Agarwal, D. A., Bud-
hia, R. K., and Lingley-Papadopoulos, C. A. (1996).
Totem: a fault-tolerant multicast group communica-
tion system. Communications of the ACM, 39(4):54–
63.
M
¨
oser, M. and B
¨
ohme, R. (2015). Trends, tips, tolls: A
longitudinal study of Bitcoin transaction fees. In Fi-
nancial Cryptography and Data Security: FC 2015.,
number 8976 in LNCS, pages 19–33, Berlin, Heidel-
berg. Springer Berlin Heidelberg.
Rizun, P. R. (2015). A transaction fee market exists without
a block size limit. Technical report.
Taylor, M. B. (2017). The evolution of bitcoin hardware.
IEEE Computer, 50(9):58–66.
van der Laan, W. J., Wuille, P., Andresen, G., et al. (2017).
Bitcoin client application. software v0.15.1.
van Renesse, R., Birman, K. P., and Maffeis, S. (1996). Ho-
rus: a flexible group communication system. Commu-
nications of the ACM, 39(4):76–83.
Waskom, M., Botvinnik, O., drewokane, Hobson, P., David,
Halchenko, Y., Lukauskas, S., Cole, J. B., Warmen-
hoven, J., de Ruiter, J., Hoyer, S., Vanderplas, J., Vil-
lalba, S., Kunter, G., Quintero, E., Martin, M., Miles,
A., Meyer, K., Augspurger, T., Yarkoni, T., Bachant,
P., Williams, M., Evans, C., Fitzgerald, C., Brian,
Wehner, D., Hitz, G., Ziegler, E., Qalieh, A., and Lee,
A. (2016). Seaborn. Software v0.7.1.
CLOSER 2018 - 8th International Conference on Cloud Computing and Services Science
650
