
Unmanned Aerial Survey for Modelling Glacier Topography in
Antarctica: First Results
Dmitrii Bliakharskii
1,2
and Igor Florinsky
2
1
Institute of Earth Sciences, St. Petersburg University, 199034, St. Petersburg, Russian Federation
2
Institute of Mathematical Problems of Biology,
Keldysh Institute of Applied Mathematics, Russian Academy of Sciences,
142290, Pushchino, Moscow Region, Russian Federation
Keywords: Unmanned Aerial System, Unmanned Aerial Vehicle, Photogrammetry, Digital Elevation Model, Crevasse.
Abstract: For Antarctic research, one of the most important support tasks is a rapid and safe monitoring of sledge
routes, snow / ice airfields, and other visited areas for detection of open crevasses, revealing of hidden,
snow-covered ones, as well as studying of their dynamics. We present the first results from a study of
applying unmanned aerial systems (UASs) and UAS-derived data to model glacier topography in contexts
of detecting crevasses and monitoring changes in glacier surfaces. The study was conducted in East
Antarctica in the austral summer 2016/2017. The surveyed areas included an eastern part of the Larsemann
Hills, an airfield of the Progress Station, an initial section of a sledge route from the Progress to Vostok
Stations, and a north-western portion of the Dålk Glacier before and after its collaps. The surveying was
performed by Geoscan 201, a flying-wing UAS. For the photogrammetric processing of imagery, we
applied software Agisoft PhotoScan Professional. High-resolution digital elevation models (DEMs) for
surveyed areas were produced. For the Dålk Glacier, we derived two DEMs related to the pre- and post-
collapsed glacier surface. A further analysis will be performed by methods of geomorphometry. The focus
will be on the revealing of crevasses.
1 INTRODUCTION
Unmanned aerial systems (UASs) are increasingly
used in sciences and industry (Aber et al., 2010;
Colomina and Molina, 2014; Shahbazi et al., 2014;
Pajares, 2015; Toth and Jóźków, 2016). In
particular, UAS-derived imagery is utilized for
producing high-resolution digital elevation models
(DEMs), which are then applied, e.g., to study and
model dynamics of slope, coastal, and fluvial
processes, to reveal fine geological features, etc.
(Smith et al., 2009; D’Oleire-Oltmanns et al., 2012;
Mancini et al., 2013; Bemis et al., 2014; Johnson et
al., 2014; Brunier et al., 2016; Florinsky et al.,
2018).
The use of UASs may significantly facilitate the
work of researchers in severe conditions of high
mountain glaciers and ice sheets (see a review of
UAS application in glaciology — Bhardwaj et al.,
2016). In Antarctica, UAS-derived data including
DEMs are used for geomorphological and vegetation
studies and surface evolution analysis (Lucieer et al.,
2014; Westoby et al., 2015; Dąbski et al., 2017).
Extreme temperature and meteorological conditions
of Antarctica make special demands on the
characteristics of UASs, installed equipment, and
aerial surveying techniques (Funaki and Hirasawa,
2008; Crocker et al., 2011; Goetzendorf-Grabowski
and Rodzewicz, 2017).
The glaciers of Antarctica are in continuous
motion. As a particular result, crevasses constantly
form on the surface and in the near-surface layer of
glaciers (Van der Veen, 1999; Colgan et al., 2016).
Crevasses pose a significant danger to polar
explorers. Thus, for Antarctic research, one of the
most important support tasks is a rapid and safe
monitoring of sledge routes, airfields (snow / ice
runways and skiways), and other visited areas for
detection of open crevasses, revealing of hidden
(snow-covered) ones, as well as studying of their
dynamics. For real-time detection and revealing of
crevasses, ground penetration radars are usually
applied, with antennas mounted in front of the
moving vehicle (for a detailed review of approaches
for crevasse detection, see Colgan et al., 2016, pp.
15–20). Although aerial imagery may be utilized to
Bliakharskii, D. and Florinsky, I.
Unmanned Aerial Survey for Modelling Glacier Topography in Antarctica: First Results.
DOI: 10.5220/0006812603190326
In Proceedings of the 4th International Conference on Geographical Information Systems Theory, Applications and Management (GISTAM 2018), pages 319-326
ISBN: 978-989-758-294-3
Copyright
c
2019 by SCITEPRESS – Science and Technology Publications, Lda. All rights reserved
319
monitor crevasses and their dynamics, a rapid aerial
survey from manned aircrafts is not always possible
due to its high cost as well as weather and lighting
conditions. Moreover, aerial photographs of glacier
surfaces cannot always be interpreted because of
specific conditions for image formation, such as low
contrast of scenes, glare from snow and ice surfaces.
UASs introduce a low-cost alternative to manned
aerial survey. The processes of crevasse formation
and propagation are reflected in the geometry of a
glacier surface. So, to reveal crevasses and monitor
glacier surfaces, it might be possible to use
secondary products of unmanned aerial survey, that
is, DEMs derived from stereo images. In this paper,
we present the first results from a study of applying
unmanned aerial survey and UAS-derived data to
model glacier topography in Antarctica in contexts
of detecting crevasses and monitoring changes in
glacier surfaces under austral summer conditions.
2 STUDY AREAS
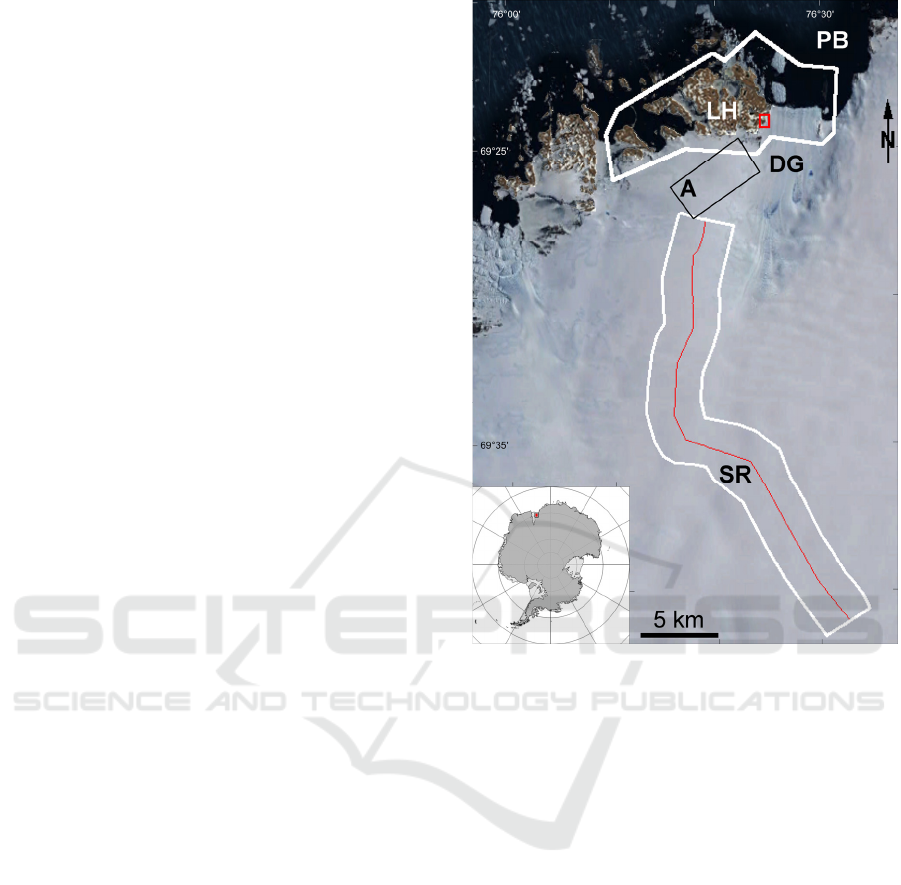
The study was conducted in and near the Larsemann
Hills, East Antarctica (Figure 1). The Larsemann
Hills are ice-free, low rounded hills with an area of
about 40 sq km located on the south-eastern coast of
the Prydz Bay, Princess Elizabeth Land (Stüwe et
al., 1989). This coastal oasis includes Stornes and
Broknes peninsulas, four small peninsulas, and
about 130 islands. The Larsemann Hills is one of the
Antarctic Specially Managed Area (ATCM, 2014).
There are three year-round operated polar stations in
this area: Progress (Russia), Zhongshan (China), and
Bharati (India).
There were four surveyed areas (Figure 1):
An eastern part of the Larsemann Hills.
An airfield (skiway) of the Progress Station
located on the ice plateau south of the
Larsemann Hills.
An initial section (from 69°27'24" S, 76°19'04"
E to 69°40'40" S, 76°32'46" E) of a sledge
route from the Progress to Vostok Stations.
A north-western portion of the Dålk Glacier.
The Dålk Glacier is a 15-km long, polar outlet
glacier draining into the south-eastern part of the
Prydz Bay east of the Larsemann Hills. On January
30, 2017, a rare natural catastrophic phenomenon
occurred: a wide collapsed depression formed in the
north-western margin of this glacier, at coordinates
69°23'58" S, 76°24'49" E (Popov et al., 2017).
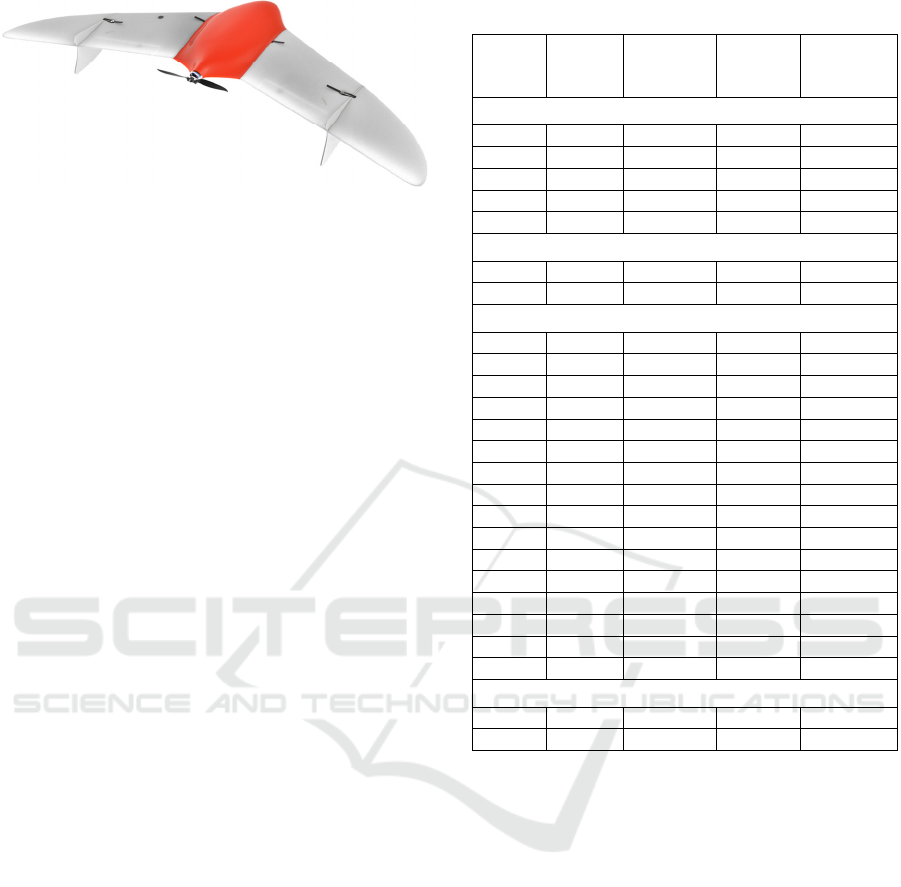
3 UAS CHARACTERISTICS
The surveying was performed by Geoscan 201
(Figure 2), a flying-wing UAS, with a wingspan of
2.3 m and a takeoff weight of 8 kg, launching by a
catapult and landing with a parachute (Geoscan,
2016). Geoscan 201 has an electric motor; the flight
duration is up to 2.5 hrs with a cruising speed of 110
km/h. On board there are:
A modem for the telemetry communication
with a laptop ground control station (GCS).
A visible-band digital camera Sony DSC-RX1
equipped with a Carl Zeiss Vario Sonnar T
lens (central shutter; 35 mm focal length) and
Figure 1: Geographical location of the surveyed areas o
n
the background of the Google Earth image mosaic: the
white frame LH — the eastern part of the Larsemann Hills
(see Figure 3); the black frame A — the airfield area (see
Figure 4); the white frame SR — the area of the initial
section of the sledge route (the red line) from the Progress
to Vostok Stations (see Figure 5); the red frame marks the
area of a collapsed portion of the Dålk Glacier (see Figure
7); DG — Dålk Glacier, PB — Prydz Bay.
GISTAM 2018 - 4th International Conference on Geographical Information Systems Theory, Applications and Management
320
a 35.8 × 23.9 mm sensor (a matrix of 6000 ×
4000 pixels with pixel sizes of 6 × 6 μm).
A GNSS receiver Topcon for high-precision
determination of image projection centres.
A ground GNSS base station includes a receiver
Topcon HiPer V.
To consider the lens distortion, we previously
performed a laboratory photogrammetric calibration
of the camera, as well as a field camera calibration.
The following camera settings are used during an
aerial survey: (1) the lens is locked to focus to
infinity; (2) the shutter priority are 1/1000 and 1/800
seconds for sunny and cloudy weather,
correspondingly; (3) an aperture and ISO sensitivity
values are selected automatically, one time per a
flight stripe; (4) images are recorded as JPEG files.
The combination of the mentioned camera and
GNSS receiver allows determining image projection
centres with the planimetric and vertical accuracies
of 2 cm and 3–4 cm, correspondingly.
The Geoscan 201 flight is performed in an
automatic mode using an autopilot. One should
specify a flight mission in the GCS by selecting a
surveyed area and setting flight parameters. The key
parameter is an overlap between images. It is
recommended to set 70 % forward and 50 % side
overlaps. Then, one of the three interrelated
parameters should be set: ground sample distance,
flight altitude, and strip width. Flights can be
conducted either at a constant altitude above ground
level (AGL) or a constant altitude above sea level.
We used the first option. Finally, a GCS program
calculates the flight stripes and coordinates of image
capture positions.
Before sending the Geoscan 201 to Antarctica, it
was modernized as follows: (1) a filament was built
into the camera lens to evaporate the possible
condensate when passing through 0° С; (2) a self-
heating function was embedded in the rechargeable
batteries; and (3) the rubber catapult was
supplemented by a spring.
4 AERIAL SURVEYING
The aerial survey was conducted in January and
February 2017 under various meteorological
conditions including clear sunny weather, variable
cloudiness, and overcast. The air temperature ranged
from –1 °C to –12 °C. The wind speed varied from 0
m/s to 28 m/s at the flight altitude. On and near the
coast, the wind was northeast. On the ice sheet, the
wind was south katabatic in morning and north
afternoon. General flight characteristics are
summarized in Table 1.
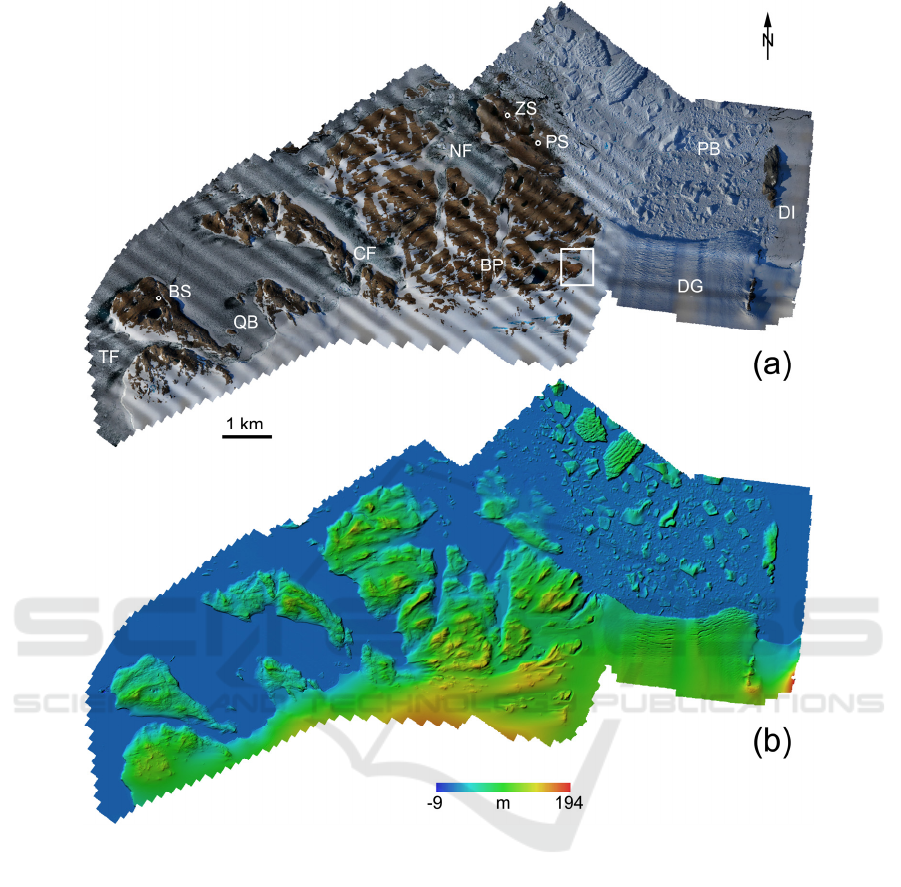
The eastern part of the Larsemann Hills with an
area of about 67 sq km (Figure 3a) was surveyed in
four flights (Table 1). The weather was sunny; the
air temperature ranged from –1 °С to –5 °С; the
wind speed was up to 5 m/s at the flight altitude.
Totally, the aerial survey consisted of 99 flight
stripes including 5,451 images.
Figure 2: A UAS Geoscan 201 (Geoscan, 2016).
Table 1: Flight characteristics.
Date Flight
Flight
altitude (m
AGL)
Number of
flight
stripes
Number of
images
Larsemann Hills
14.01 2 370–410 19 1,089
–"– 3 –"– 26 1,230
20.01 14 310–350 20 1,594
–"– 15 –"– 34 1,538
Total 99 5,451
Airfield
14.01 1 520 16 856
14.02 30 390 17 1,271
Sledge route
17.01 5 400–430 26 1,280
–"– 6 –"– 32 1,484
–"– 7 300–320 23 1,428
–"– 8 –"– 25 1,260
18.01 9 –"– 16 766
–"– 10 –"– 11 535
–"– 11 –"– 24 1,025
–"– 12 –"– 17 800
–"– 13 400–430 21 803
Total 195 9,381
03.02 20 400–430 21 813
–"– 21 –"– 21 1,053
04.02 23 300–320 29 1,400
–"– 24 –"– 26 1,614
–"– 25 –"– 29 1,316
Total 126 6,196
Dålk Glacier, collapsed area
20.01 14 310–350 20 1,594
09.02 29 320–330 30 1,011
Unmanned Aerial Survey for Modelling Glacier Topography in Antarctica: First Results
321
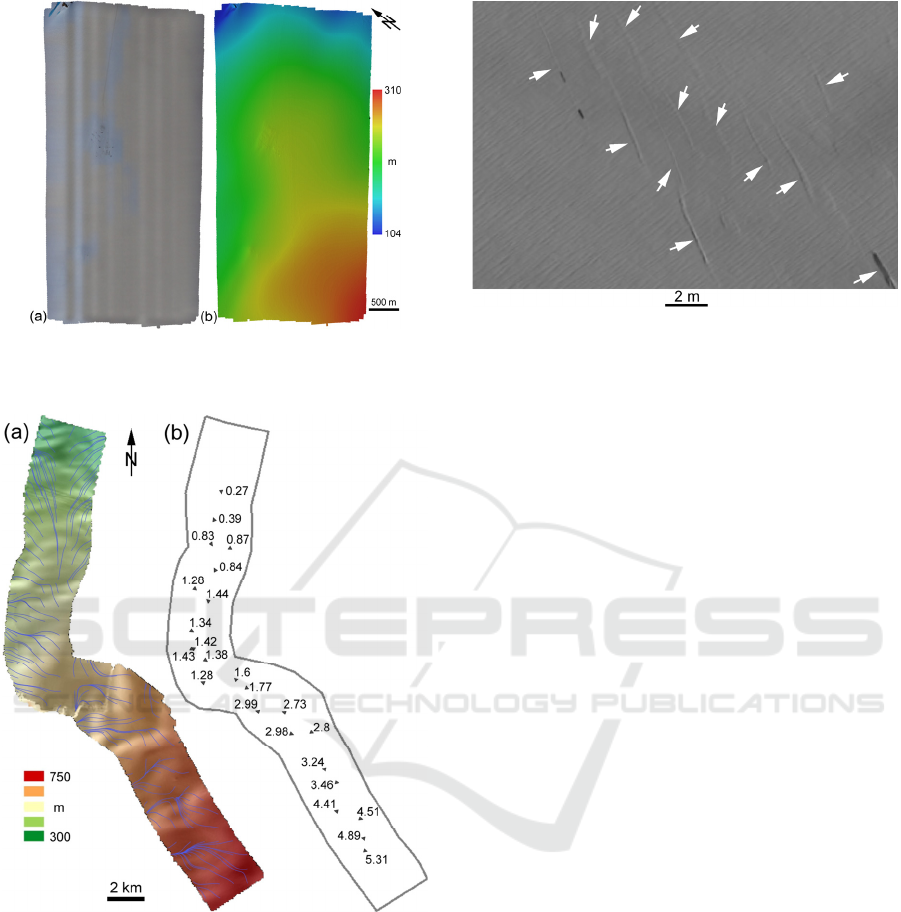
The airfield area of about 10 sq km (Figure 4a)
was surveyed twice — in mid-January and mid-
February — to estimate the snow melting (Table 1).
During the first flight, the weather was sunny; the air
temperature ranged from –3 °С to –5 °С; the wind
speed was 3–5 m/s at the flight altitude. The first
survey consisted of 16 flight stripes including 856
images. During the second flight, it was variable,
mid-level cloudiness; the air temperature was –8 °С;
the wind speed was about 10 m/s at the flight
altitude. The second survey consisted of 17 flight
stripes including 1,271 images.
The area of the initial section of the sledge route
from the Progress to Vostok Stations with a length
of about 30 km and a width of around 3 km (Figure
5a) was surveyed twice — in mid-January and early
February — to estimate the ice movement. As
ground control points, we used 17 plastic stakes and
10 barrels. During the first and second surveys, we
performed nine and five flights, correspondingly
(Table 1). During the first survey, the weather was
sunny; the air temperature ranged m/s gusting up to
18–20 m/s at the flight altitude. The surveyed area
was about 102 sq km. The first survey consisted of
195 flight stripes including 9,381 images. During the
second survey, weather conditions deteriorated: it
Figure 3: The eastern part of the Larsemann Hills: (a) orthomosaic; (b) elevations. BP — Broknes Peninsula, PS
—
Progress Station, ZS — Zhongshan Station, BS — Bharati Station, DG — Dålk Glacier, PB — Prydz Bay, QB — Quilty
Bay, TF — Thala Fjord, CF — Clemence Fjord, NF — Nella Fjord, DI — Dalkøy Island; the white frame marks the are
a
of a collapsed portion of the Dålk Glacier (see Figure 7).
GISTAM 2018 - 4th International Conference on Geographical Information Systems Theory, Applications and Management
322
was overcast with a cloud base of about 1000 m; the
air temperature ranged from –7 °С to –12 °С; the
wind speed was 15–20 m/s gusting up to 25–28 m/s
at the flight altitude. In this connection, it was
impossible to perform aerial surveying of the entire
study area (the surveyed area was about 73 sq km).
The second survey consisted of 126 flight stripes
with 6,196 images (Figure 6).
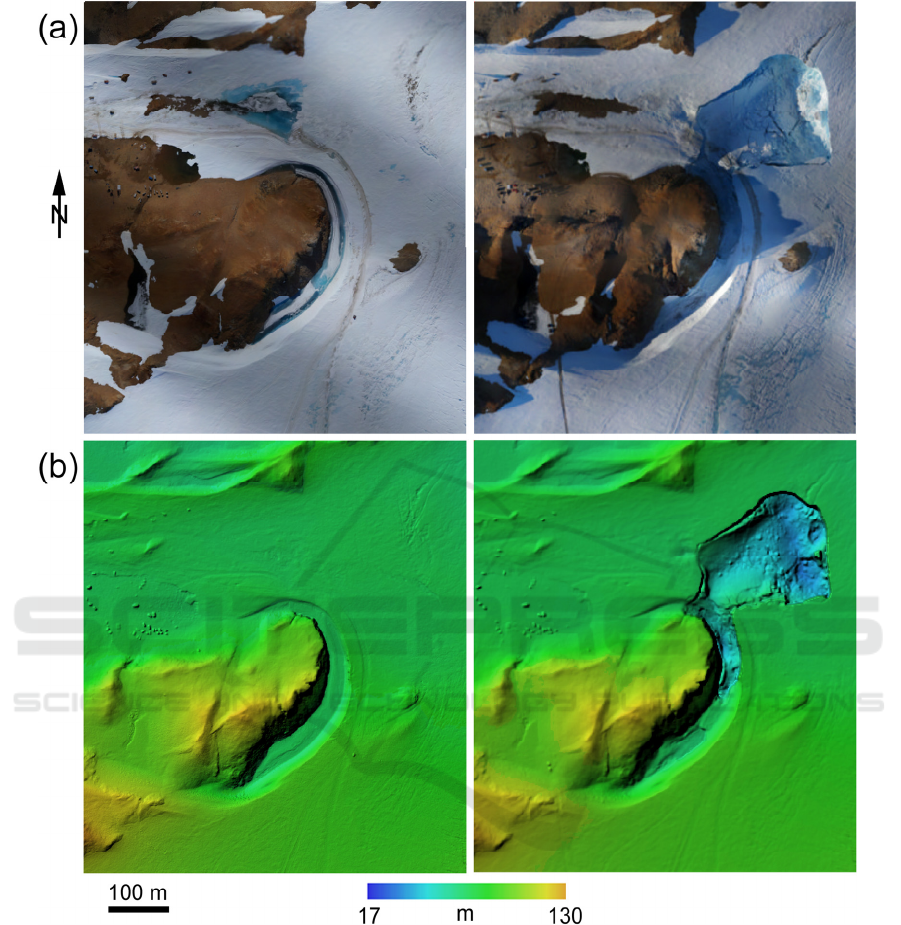
The collapsed portion of the Dålk Glacier and an
adjacent territory with an area of about 7.5 sq km
(Figure 7a) was surveyed in two flights, before and
after the glacier’s collapse (Table 1). The weather
was sunny; the air temperature ranged from –1 °С to
–5 °С; the wind speed was 0–5 m/s at the flight
altitude. The aerial surveying consisted of 20 and 30
flight stripes including 1,594 and 1,011 images for
the first and second flights, correspondingly.
Each flight took about 2 hrs. For all flights,
forward and side overlaps were about 70 % and
50 %, correspondingly. Aerial images have the
average resolution of 6 cm.
We described only those aerial surveys, which
images were then successfully processed (Section 5).
Testing flights were also conducted. It has been
empirically found that in Antarctica, it is advisable
to perform unmanned aerial survey in sunny
weather, at variable and high cloudiness (5–6 km
AGL). On contrast images captured in such a good
lighting conditions, microtopographic ice features
created by the wind are clearly visible on the ice
surface. A correlation algorithm uses these ice
microfeatures for searching conjugate points in the
photogrammetric processing of images (Section 5).
Under low cloudiness and hence diffuse lighting,
one obtains low-contrast, almost white aerial
photographs, which are difficult or impossible to
process because ice microfeatures are not visible.
It is absolutely impossible to perform unmanned
aerial survey under low clouds (100–200 m AGL).
In this case, whiteout occurs when there is no
contrast between ice- and snow-covered terrain and
sky, that is, ice, sky, and horizon are
indistinguishable.
Sometimes, it was difficult to determine the
cloud height. As a result, the UAS went into the
clouds. In these cases, the UAS had ice build-up on
the leading edge of wing, Pitot tube, and screw
Figure 6: An example of aerial photographs of the sledge
route area. Arrows mark crevasses.
Figure 4: The airfield area (mid-January): (a) orthomosaic;
(b) elevations.
Figure 5: The area of the initial section of the sledge route
from the Progress to Vostok Stations (mid-January):
(a) elevations and thalweg lines; (b) ice movement
(meters). Arrows show the direction of movement.
Unmanned Aerial Survey for Modelling Glacier Topography in Antarctica: First Results
323
blades that led to an increase in UAS’s weight and
its emergency landing.
5 IMAGE PROCESSING
The image processing consisted of two stages: (1) a
post-processing of the on-board GNSS receiver
measurements relative to the base station; and (2) a
photogrammetric processing of the aerial images.
For the first stage, we used Pinnacle software
(Topcon Positioning Systems, Inc.). We positioned
images with corresponding coordinates of image
projection centres. The coordinates were utilized in
the next stage as reference data.
For the second stage, we used Agisoft PhotoScan
Professional 1.3.2 software (Agisoft, 2017). This
choice is determined by the fact that Geoscan 201
and Agisoft PhotoScan represent a unified software–
hardware system (Inozemtsev, 2014). This software
implements a set of traditional photogrammetric
Figure 7: The north-western margin of the Dålk Glacier before (left) and after (right) the surface collapse (for the location
of this area, see Figures 1 and 3): (a) orthomosaics; (b) elevations.
GISTAM 2018 - 4th International Conference on Geographical Information Systems Theory, Applications and Management
324
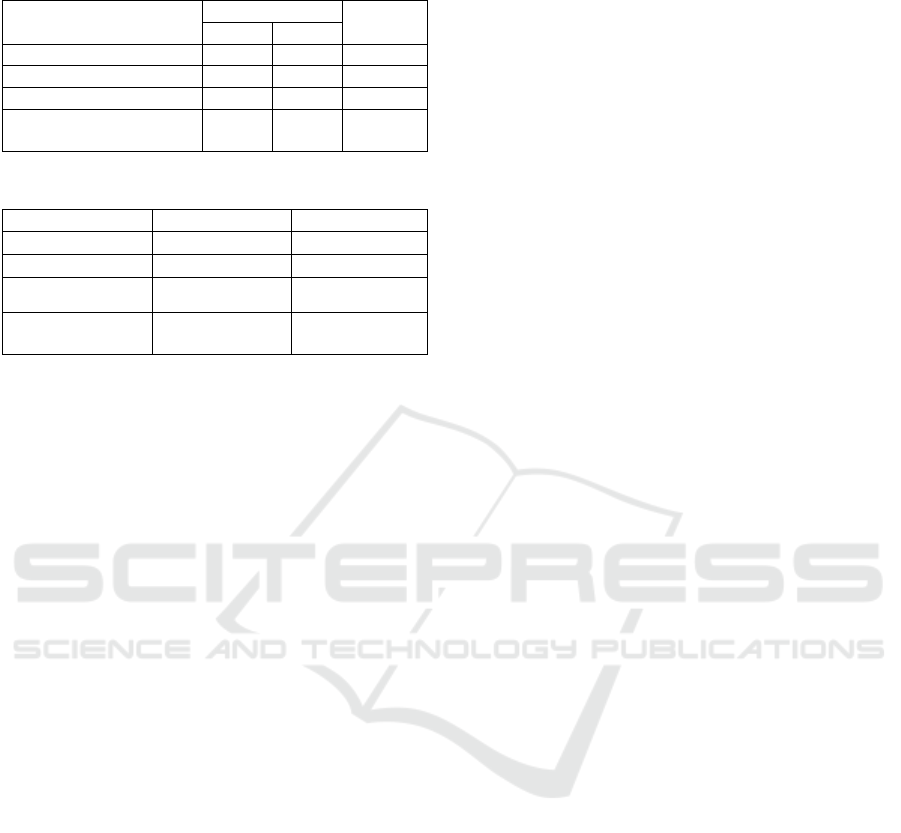
Table 2: Accuracy of the aerial triangulation in terms of
standard deviation.
Area
Planimetric (m)
Vertical
(m)
X Y
Larsemann Hills 0.09 0.12 0.08
Airfield 0.05 0.04 0.03
Sledge route 1.9 0.5 0.8
Dålk Glacier,
collapsed zone
0.05 0.05 0.06
Table 3: DEM characteristics.
Area Matrix size Resolution (m)
Larsemann Hills
68,913 × 41,879
0.28
Airfield
30,991 × 26,771
0.27
Sledge route
12,817 × 19,082
1.9
Dålk Glacier,
collapsed zone
8,400 × 7,655
0.22
methods (Kraus, 2007; Mikhailov and Chibunichev,
2016) and structure-from-motion approaches
(Hirschmüller, 2008; Smith et al., 2016).
The image processing is based on an algorithm
developed in Agisoft (2017). The brightness of
images is analysed, so that a large number of
conjugate points are defined on overlapping images.
Using conjugate points, the parameters of image
orientation and lens distortion are determined. Using
reference points, a photogrammetric model, derived
from all images of the block, becomes a metric one.
Thus, the block aerial triangulation is performed. For
accuracy of the aerial triangulation, see Table 2.
Densifying a cloud of conjugate points to a dense
point cloud using all obtained elements, one can
obtain an irregular digital surface model (DSM).
Then, one can derive a regular DSM from the
irregular one by linear interpolation. In a general
case, when the dense point cloud is obtained, one
can produce a DEM by applying a classification
algorithm developed by Agisoft (2017). Recall that a
DEM describes the topographic surface while a
DSM represents a surface enveloping or consisting
of portions of the topographic surface, vegetation
canopy, top of buildings, and other objects located
on the topographic surface. However, in this study, a
DSM can be considered a DEM for almost all areas
(except for very small zones including polar
station’s buildings).
Using obtained aerial imagery, we generated
high-resolution DEMs (Figures 3b, 4b, 5a, and 7b).
For the airfield area, we derived two DEMs related
to mid-January and mid-February dates of survey.
For the initial section of the sledge route, two DEMs
related to mid-January and early February dates of
survey were also produced. For the north-western
margin of the Dålk Glacier, we derived two DEMs
related to the pre- and post-collapsed glacier surface
(Figure 7b). General characteristics of the DEMs can
be found in Table 3. Notice that the DEMs of the
Larsemann Hills (Figure 3b) and the Dålk Glacier
(Figure 7b) describe mixed surfaces of the bedrock
and ice. The DEMs of the airfield area and the
sledge route describe the ice surface only.
Accuracy estimation of the obtained DEMs is a
non-trivial task. Usually, it can be solved using
GCPs with known planimetric coordinates and
elevation values. However, in this study it was
impossible to set up GCPs at all glacier areas due to
safety issues. At the sledge route, we set up 27
GCPs, but these cannot be used for the DEM
accuracy estimation because of a high speed of the
ice movement and a time gap between geodetic and
aerial works (GCPs moved together with the ice).
On the initial section of the sledge route, the ice
movement ranged from 0.28 m to 5.31 m in 21 days
between the first and second surveys (Figure 5b),
that is, up to 0.25 m per day. For a rough estimation
of the DEM accuracy, one may use data for the
accuracy of the aerial triangulation (Table 2).
6 CONCLUSIONS
We studied possibilities of applying a small UAS
and UAS-derived images to model glacier
topography in Antarctica. Optimal meteorological
conditions were empirically determined for
conducting unmanned aerial survey to obtain images
suitable for subsequent photogrammetric processing
and DEM generation. For four areas, high-resolution
DEMs of bedrock/glacier and glacier surfaces were
produced. Further analysis of the DEMs will be
performed by methods of geomorphometry
(Florinsky, 2016). The focus will be on a detailed
modelling of the collapsed area of the Dålk Glacier,
as well as the revealing of glacier crevasses.
ACKNOWLEDGEMENTS
The aerial surveying was conducted during the 62nd
Russian Antarctic Expedition in cooperation with
Geoscan Ltd. Data processing is supported by the
Russian Foundation for Basic Research, grant 17-37-
50011.
Unmanned Aerial Survey for Modelling Glacier Topography in Antarctica: First Results
325

REFERENCES
Aber, J.S., Marzolff, I., Ries, J., 2010. Small-format aerial
photography: Principles, techniques and geoscience
applications. Elsevier, Amsterdam.
Agisoft, 2017. Agisoft PhotoScan user manual:
Professional edition, version 1.3. St. Petersburg.
ATCM, 2014. Larsemann Hills, East Antarctica: Antarctic
Specially Managed Area Management Plan. Measure
15. In: Antarctic Treaty Consultative Meeting (ATCM)
XXXVII Final Report. ATCM.
Bemis, S.P., Micklethwaite, S., Turner, D., James, M.R.,
Akciz, S., Thiele, S.T., Bangash, H.A., 2014. Ground-
based and UAV-based photogrammetry: A multi-
scale, high-resolution mapping tool for structural
geology and paleoseismology. J. Struct. Geol., 69:
163-178.
Bhardwaj, A., Sam, L., Akanksha, Martín-Torres, F.J.,
Kumar, R., 2016. UAVs as remote sensing platform in
glaciology: Present applications and future prospects.
Remote Sens. Envir., 175: 196-204.
Brunier, G., Fleury, J., Anthony, E.J., Gardel, A.,
Dussouillez, P., 2016. Close-range airborne Structure-
from-Motion Photogrammetry for high-resolution
beach morphometric surveys: Examples from an
embayed rotating beach. Geomorph., 261: 76-88.
Colgan, W., Rajaram, H., Abdalati, W., McCutchan, C.,
Mottram, R., Moussavi, M.S., Grigsby, S., 2016.
Glacier crevasses: Observations, models, and mass
balance implications. Rev. Geophys., 54: 119-161.
Colomina, I., Molina, P., 2014. Unmanned aerial systems
for photogrammetry and remote sensing: A review.
ISPRS J. Photogramm. Remote Sens., 92: 79-97.
Crocker, R.I., Maslanik, J.A., Adler, J.J., Palo, S.E.,
Herzfeld, U.C., Emery, W.J., 2011. A sensor package
for ice surface observations using small unmanned
aircraft systems. IEEE Trans. Geosci. Remote Sens.,
50: 1033-1047.
Dąbski, M., Zmarz, A., Pabjanek, P., Korczak-Abshire,
M., Karsznia, I., Chwedorzewska, K.J., 2017. UAV-
based detection and spatial analyses of periglacial
landforms on Demay Point (King George Island,
South Shetland Islands, Antarctica). Geomorph., 290:
29-38.
D’Oleire-Oltmanns, S., Marzolff, I., Peter, K.D., Ries,
J.B., 2012. Unmanned aerial vehicle (UAV) for
monitoring soil erosion in Morocco. Remote Sens., 4:
3390-3416.
Florinsky, I.V., 2016. Digital terrain analysis in soil
science and geology. 2
nd
ed. Academic Press,
Amsterdam.
Florinsky, I.V., Kurkov, V.M., Bliakharskii, D.P., 2018.
Geomorphometry from unmanned aerial surveys.
Trans. GIS, 22, doi:10.1111/tgis.12296.
Funaki, M., Hirasawa, N., 2008. Outline of a small
unmanned aerial vehicle (Ant-Plane) designed for
Antarctic research. Polar Sci., 2: 129-142.
Geoscan, 2016. Geoscan 201. Geoscan Ltd, St.Petersburg,
https://www.geoscan.aero/en/products/geoscan201/bas
e
Goetzendorf-Grabowski, T., Rodzewicz, M., 2017. Design
of UAV for photogrammetric mission in Antarctic
area. J. Aerospace Eng., 231: 1660-1675.
Hirschmüller, H., 2008. Stereo processing by semiglobal
matching and mutual information. IEEE Trans. Patt.
Anal. Mach. Intell., 30: 328-341.
Inozemtsev, D.P., 2014. Automated aerial survey using a
software–hardware system ‘Geoscan–Photoscan’.
CAD & GIS for Roads, 1(2), 46-51 (in Russian).
Johnson, K., Nissen, E., Saripalli, S., Arrowsmith, J.R.,
McGarey, P., Scharer, K., Williams, P., Blisniuk, K.,
2014. Rapid mapping of ultrafine fault zone
topography with structure from motion. Geosphere,
10: 969-986.
Kraus, K., 2007. Photogrammetry: Geometry from images
and laser scans, 2
nd
ed. de Gruyter, Berlin.
Lucieer, A., Turner, D., King, D.H., Robinson, S.A., 2014.
Using an Unmanned Aerial Vehicle (UAV) to capture
micro-topography of Antarctic moss beds. Int. J. Appl.
Earth Observ. Geoinf., 27: 53-62.
Mancini, F., Dubbini, M., Gattelli, M., Stecchi, F., Fabbri,
S., Gabbianelli, G., 2013. Using unmanned aerial
vehicles (UAV) for high-resolution reconstruction of
topography: The structure from motion approach on
coastal environments. Remote Sens., 5: 6880-6898.
Mikhailov, A.P., Chibunichev, A.G. (2016).
Photogrammetry. MIIGAiK, Moscow (in Russian).
Pajares, G., 2015. Overview and current status of remote
sensing applications based on unmanned aerial
vehicles (UAVs). Photogramm. Eng. Remote Sens.,
81: 281-329.
Popov, S.V., Pryakhin, S.S., Bliakharskii, D.P., Pryakhina,
G.V., Tyurin, S.V., 2017. Vast ice depression in Dålk
Glacier, East Antarctica. Ice Snow, 57: 427-432.
Shahbazi, M., Théau, J., Ménard, P., 2014. Recent
applications of unmanned aerial imagery in natural
resource management. GISci. Remote Sens., 51: 339-
365.
Smith, M.J., Chandler, J., Rose, J., 2009. High spatial
resolution data acquisition for the geosciences: Kite
aerial photography. Earth Surf. Process. Landforms,
34: 155-161.
Smith, M.W., Carrivick, J.L., Quincey, D.J., 2016.
Structure from motion photogrammetry in physical
geography. Progr. Phys. Geogr., 40: 247-275.
Stüwe, K., Braun, H.-M., Peer, H., 1989. Geology and
structure of the Larsemann Hills area, Prydz Bay, East
Antarctica. Austral. J. Earth Sci., 36: 219-241.
Toth, C., Jóźków, G., 2016. Remote sensing platforms and
sensors: A survey. ISPRS J. Photogramm. Remote
Sens., 115: 22-36.
Van der Veen, C.J., 1999. Crevasses on glaciers. Polar
Geogr., 23: 213-245.
Westoby, M.J., Dunning, S.A., Woodward, J., Hein, A.S.,
Marrero, S.M., Winter, K., Sugden, D.E., 2015.
Sedimentological characterization of Antarctic
moraines using UAVs and Structure-from-Motion
photogrammetry. J. Glaciol., 61: 1088-1102.
GISTAM 2018 - 4th International Conference on Geographical Information Systems Theory, Applications and Management
326
