
A Personalized Reading Coach using Wearable EEG Sensors
A Pilot Study of Brainwave Learning Analytics
Xiaodong Qu
1
, Mercedes Hall
1
, Yile Sun
2
, Robert Sekuler
2
and Timothy J. Hickey
1
1
Computer Science Department, Brandeis University, 415 South Street, Waltham MA, 02453, U.S.A.
2
Psychology Department, Brandeis University, 415 South Street, Waltham MA, 02453, U.S.A.
Keywords:
Education/Learning, Quantitative Methods, Prototyping, Implementation, Machine Learning, Personalization
Sensors, Desktop/Laptop Computers, Wearable Computers, Behavior Change, Personal Data/Tracking,
Schools/Educational Setting.
Abstract:
The advent of wearable consumer-grade brainwave sensors opens the possibility of building educational tech-
nology that can provide reliable feedback about the focus and attention of a student who is engaged in a
learning activity.
In this paper, we demonstrate the practicality of developing a simple web-based application that exploits EEG
data to monitor reading effectiveness personalized for individual readers. Our tool uses a variant of k-means
classification on the relative power of the five standard bands (alpha, beta, gamma, delta, theta) for each of
four electrodes on the Muse wearable brainwave sensor. We demonstrate that after 30 minutes of training, our
relatively simple approach is able to successfully distinguish between brain signals produced when the subject
engages in reading versus when they are relaxing. The accuracy of classification varied across the 10 subjects
from 55% to 85% with a mean of 71%. The standard approach to recognize relaxation is to look for strong
alpha and/or theta signals and it is reasonably effective but is most associated with closed eye relaxation and
it does not allow for personalization. Our k-means classification approach provides a personalized classifier
which distinguishes open eye relaxation from reading and has the potential to detect a wide variety of different
cognitive states.
1 INTRODUCTION
Neurofeedback is a powerful therapeutic tool for
many types of learning disabilities (Bashivan et al.,
2016; Kovacevic et al., 2015; Toplak et al., 2008).
For example, over last two decades research has
shown the effectiveness of using EEG biofeedback
for enhancing performances of individuals with At-
tention Deficit Disorder (La Marca and O’Connor,
2016; Rasey et al., 1995). Our research focused
on general college students, and we are interested in
whether EEG neurofeedback could be an effective
form of learning analytics providing valuable feed-
back to learners about their cognitive state.
In this paper, we explore the possibilities of us-
ing inexpensive, consumer-grade brainwave sensing
headbands (the Muse band by Interaxon) to provide
neurofeedback on reading comprehension. Tradi-
tional neurofeedback protocols provide feedback us-
ing a fixed criterion, which is independent of the par-
ticular subject (Rasey et al., 1995). This is done typi-
cally looking for a high level of activity in some EEG
bands and a low level of activity in other EEG bands,
where this activity level is taken as an average over all
of the electrodes.
The Muse headband, which we use in our study,
is a simple four-electrode brainwave sensor that gen-
erates five bands of EEG data for each electrode ten
times per second. Our key idea is to attempt to train
the system to recognize focused reading by having
the subject engage in reading comprehension activi-
ties alternating with periods of relaxation and using
that trained system to provide audio and visual feed-
back to a reader.
Some researchers (Kovacevic et al., 2015) have
used the same portable devices (Muse) to provide
both visual and audio feedbacks of their subjects’
brainwaves while concentrating or relaxing. Others
(Lee et al., 2014) used a 32 electrode headset (the
NeuroScan system) to evaluate the effectiveness of
different approaches of audio notification, for exam-
ple, warning sounds in ICUs or factories where there
could be a lot of ambient sound. Our approach is to
focus on reading, and moreover to build a platform
Qu, X., Hall, M., Sun, Y., Sekuler, R. and Hickey, T.
A Personalized Reading Coach using Wearable EEG Sensors.
DOI: 10.5220/0006814705010507
In Proceedings of the 10th International Conference on Computer Supported Education (CSEDU 2018), pages 501-507
ISBN: 978-989-758-291-2
Copyright
c
2019 by SCITEPRESS – Science and Technology Publications, Lda. All rights reserved
501

that can be used to explore different types of audio
and visual feedbacks.
In this paper we show that a simple k-means clas-
sification algorithm can be used to obtain a classifica-
tion accuracy of around 70% over a one minute win-
dow. We also speculate about how this could be used
to develop personalized neurofeedback reading coach
applications. Our study also shows that the classifi-
cation accuracy varies widely by individual. The k-
means algorithm can classify some individuals read-
ing/relaxing activity with an accuracy of ∼85% while
others have an accuracy of below 60%. The standard
approach to recognize relaxation from non-relaxation
is to look for strong alpha and or theta signals (Jacobs
and Friedman, 2004) and it is reasonably effective but
is most associated with closed eye relaxation and it
does not allow for personalization. Our approach is
both personalizable and effective with open eye re-
laxation.
In the rest of this paper we describe collection and
analysis of EEG data from 10 subjects. We then de-
scribe a prototype implementation of a Personalized
Reading Coach based on a simple EEG classification
scheme. The scheme succeeds well for most, but not
all, readers.
2 THE PROTOTYPE
PERSONALIZED READING
COACH
We developed a simple web application by modify-
ing a sample application provided by Interaxon, the
manufacturer of the Muse headband. Interaxon’s web
application would plot the brainwave data from a sub-
ject in real-time. In particular, it produces measures
relative power from the alpha, beta, gamma, delta, and
theta bands averaged over the four electrodes. These
bands measure the power for the following ranges:
• delta: 2.5 - 6.1 Hz
• theta: 4 - 8 Hz
• alpha 7.5 - 13 Hz
• beta 13 - 30 Hz
• gamma 30 - 44 Hz
These bands were computed using a 256 sample FFT
and hence incorporate data from the previous 1.16
seconds since the unprocessed samples are generated
at 220Hz.
We modified the default Muse application by
adding a k-means classifier which would classify each
of the samples as either being a ”reading” sample or a
”relaxing/daydreaming” sample. We discuss how this
classifier was trained in a later section. The training
was done off-line and the results were loaded into the
application. The reading coach generates real-time
audio and/or visual responses when it detects that the
subject has a relatively low percentage of ”reading”
samples over a given period. It can also generate plots
that show the percentages over the entire course of the
reading period. For example, one audio feedback re-
sponse would be to play a warning sound, or to cue
a vocal suggestion (e.g. ”Perhaps you should take a
break!”). A visual cue could be to decrease the opac-
ity of the text so the words start to vanish if the subject
appears to lose focus.
Part of our plan for future work, is to evaluate the
effectiveness of these feedback approaches. The goal
of the current work was to develop a proof of principle
application but not to evaluate its effectiveness.
3 THE EXPERIMENT
The data on which this paper is based came from
an experiment with 10 subjects in which we mea-
sured their brainwave activity using the Muse portable
brainwave reader during four 20 minute sessions in
which they were engaged in four different kinds of
activity.
After completing the initial survey and signing the
Informed Consent form, subjects were fitted with a
Muse brainwave reader (described below) and asked
to complete a 20 minute survey.
The items in the first five minutes of the survey
were math problems from GRE quantitative reasoning
sample tests. Since many US graduate schools require
the Graduate Record Examinations (GRE), it was rel-
atively easy to recruit college students to be subjects
in this experiment since it would also give them more
practice with working on GRE math and reading com-
prehension problems. Subjects were told there were
many more questions than they could solve but were
asked to solve as many as they could. During the sec-
ond five minutes of the survey, subjects were asked to
close their eyes, focus on their breath, and count their
breaths if they were distracted. After five minutes an
audio notification prompted them to continue the sur-
vey. During the third five minutes, subjects completed
questions from GRE verbal reasoning sample tests,
again with the proviso that there were more questions
than they could answer, but they should do as many
as they could. In the final five minutes, subjects were
asked to again relax, focus and if necessary count their
breaths, but this time with their eyes open. We abbre-
viate these four sections as MATH, SHUT, READ,
OPEN.
A2E 2018 - Special Session on Analytics in Educational Environments
502

3.1 The Muse Brainwave Reader
EEG data were collected using wireless, bluetooth-
enabled Muse headsets. Power from a headset’s
rechargeable battery typically lasted for about 45 min-
utes, which limited the length of a testing session.
The headsets were equipped with four sensors,
with two placed at the mastoids (on the ear clips) and
two at frontal regions Fp1 and Fp2. Muse headsets
initially oversample EEG and then downsample it
to yield a 220Hz signal with 2uV (RMS) noise.
(Kovacevic et al., 2015; Hashemi et al., 2016)
Participants. Fourteen undergraduate and graduate
level college students were recruited for this study.
They agreed to participate in four 20 minute sessions
in which they would solve GRE math and reading
problems as well as relax with open or closed eyes
while their brainwaves were being recorded using the
Muse headband.
In total, 12 subjects finished all the four surveys.
Two subjects had severe electrode connectivity issues
in at least one of their 4 sessions, and so their data
needed to be discarded. This left 40 valid record-
ings for 10 subjects. We had 80 minutes of recorded
data for each subject. The Muse headband generates
a wide variety of data, but we were only interested
in recording the relative power of the five standard
bands (alpha, beta, gamma, delta, theta) at a rate of
10Hz, which generated a total of 480,000 samples per
subject. Each sample consisted of five relative power
bands for each of four electrodes, yielding 20 floating
point numbers between 0 and 1. Since we were look-
ing at relative power, the sum of these five values for
each electrode was always equal to 1.0.
The average age of the subjects who completed
the experiment was 22.8. There were four Females
and six Males.
4 K-MEAN CLASSIFICATION OF
CORTICAL OSCILLATIONS
Over each 20-minute experimental session we used
the Muse band to collect ∼12,000 samples of cortical
oscillations data. Samples were taken over the course
of four five-minute conditions, presented one after an-
other. The four conditions were
• MATH (M) in which subjects subjects attempted
to solve problems from GRE Quantitative tests
• SHUT (S), in which subjects relaxed with eyes
shut
• READ (R), in which subjects read and tried to an-
swer questions from GRE Verbal tests
• OPEN (O), in which subjects relaxed with eyes
open
Our analysis used the alpha, beta, delta, gamma, and
theta band oscillatory power collected from each of
the four MuseBand sensors as output by the Muse-
band device itself.
In this paper we are only focusing on the READ
and OPEN data for each subject as we want to esti-
mate how effectively this data can be used to distin-
guish Reading activity from Open Eye relaxation, in
which subjects’ minds tend to wander.
After collecting all of the subjects’ data for all
four sessions, we extracted the READ and OPEN data
and combined it into a single dataset for each individ-
ual. Fig. 1 shows the raw data for subjects 1 and 2.
The horizontal axis is the time with tic marks every
5 minutes. The vertical axis is the relative power and
the four graphs from top to bottom correspond to the
four electrodes from left to right (left ear, left fore-
head, right forehead, right ear). The top plot shows
the results for Subject 1 and the bottom plot for Sub-
ject 2. The color of each line indicates the band.
Some of the boundaries between READ and OPEN
are clearly visible in these Figures, as they alter-
nate READ, OPEN, READ, OPEN, READ, OPEN,
READ, OPEN in 3000 sample blocks, but one sees
quite a bit of variance both between the two subjects
and within each subject.
Fig. 2 shows a magnified view of the data from
the right ear electrode of Subject 1 from minute 5 to
minute 7 as they are switching from reading to open
eye relaxation. We can see that the alpha band domi-
nates after minute 6. Some of the other transition are
harder to see visually, which is why machine learning
is needed to classify these activities.
Next, we applied a k-means clustering algorithm
(for various k, but k=12 was optimal for this data
and then used those clusters to form a classifier us-
ing the standard approach, as follows. For each clus-
ter, we calculated the number of samples for each
type (READ and OPEN) that were in that cluster, and
used that information to label each cluster as either a
READ or an OPEN cluster. Any new sample, would
then be compared to the cluster points, and assigned
the label of whichever cluster point was closest.
Fig. 3 shows an example of a k-means classifier
with k=12. This classifier was generated using the
first three sessions of Subject 1 (shown in top plot
in Fig. 1). The horizontal axis corresponds to the 12
clusters. Each cluster has two bars, one for the READ
samples and one for the OPEN samples that are clos-
est to that cluster point than any of the other 12 cluster
A Personalized Reading Coach using Wearable EEG Sensors
503
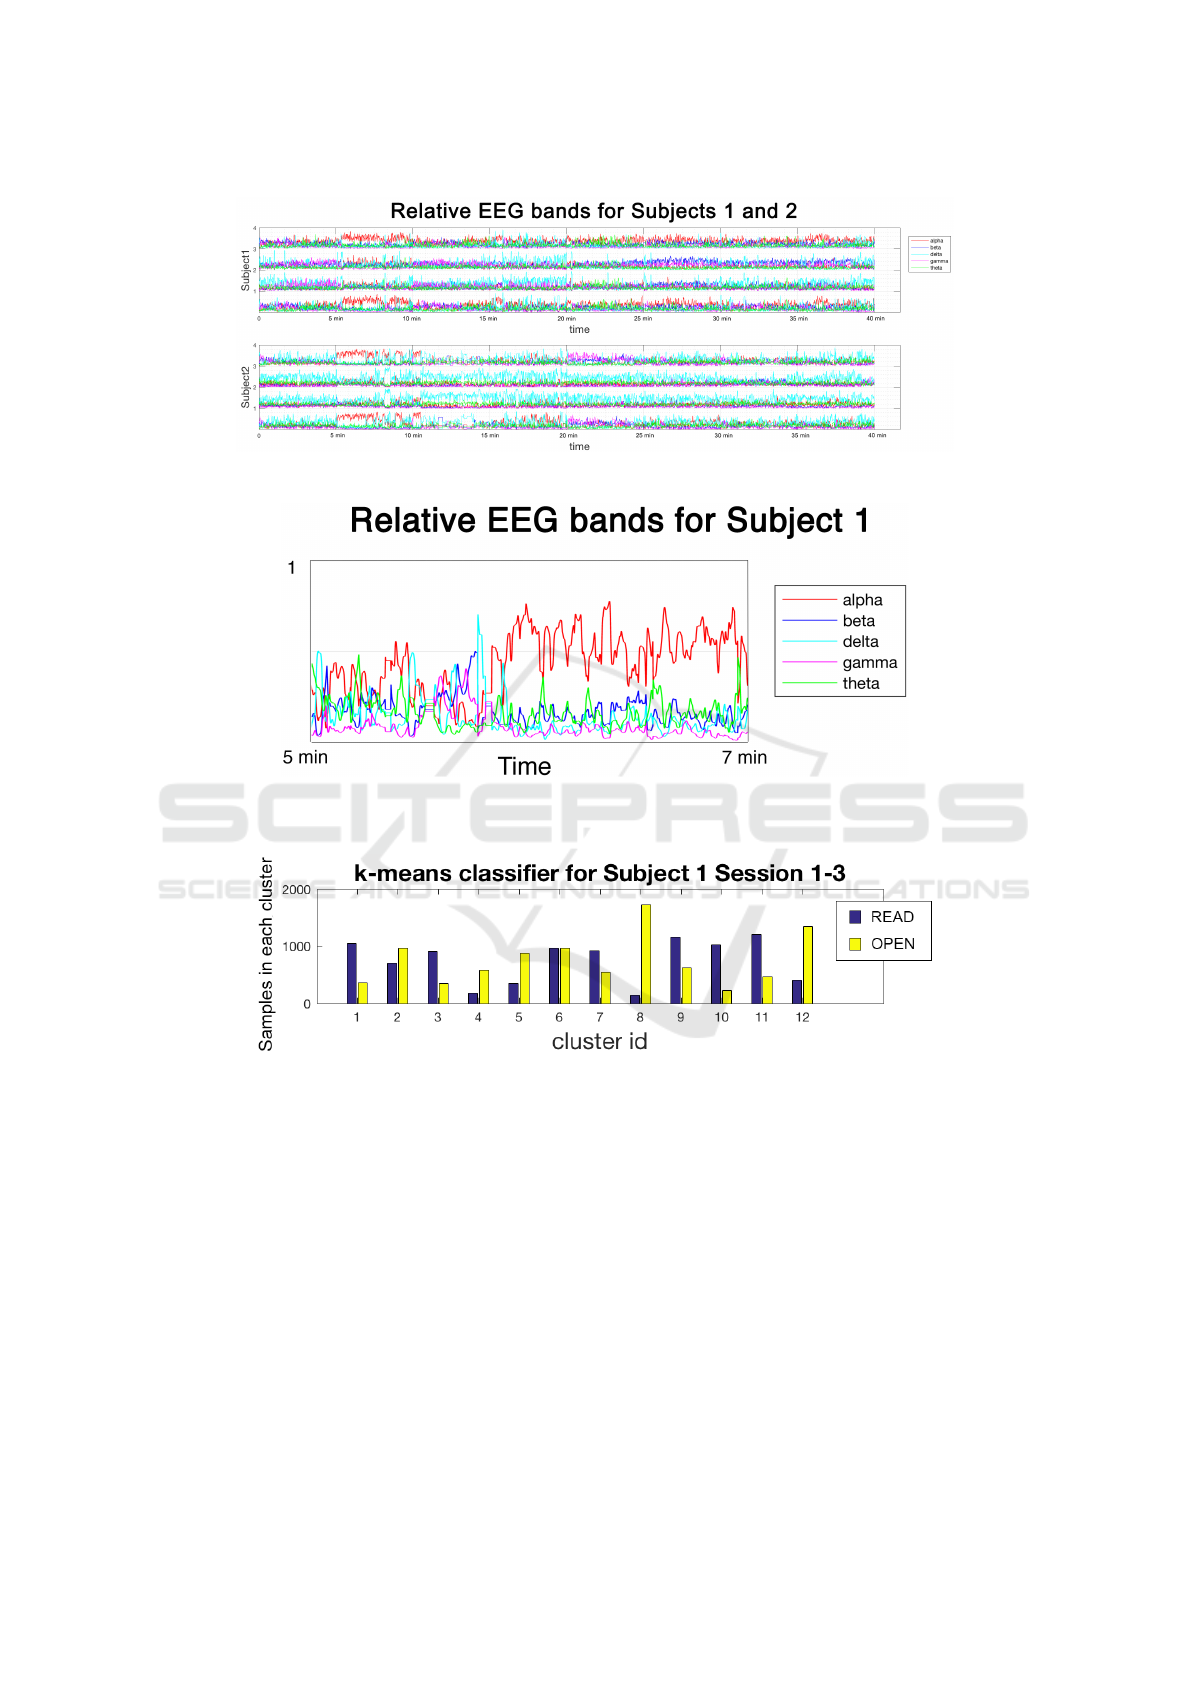
Figure 1: This shows the 5 bands of data for all 4 electrodes for subjects 1 and 2.
Figure 2: This shows the 5 bands of data for electrode 4 of the subject 1 for the 1200 samples (120 seconds) after switching
from reading to open eye relaxation. We can see that alpha dominates electrode 4 after the first minute.
Figure 3: This shows the 12 clusters in a k-means classifier for Session 1-3 of Subject 1.
points. The vertical axis is the number of samples of
the specified type (READ or OPEN) in that particular
cluster. Seven of the clusters are READ clusters (1, 3,
6, 7, 9, 10, 11) and the other five are OPEN clusters.
4.1 Predicting with a Sliding Window
To improve the accuracy of the k-means classifier and
to smooth out its prediction, we averaged the base pre-
diction over a 1 minutes window centered at time t
and chose whichever activity was predicted most of-
ten in that window.
Fig. 4 shows the prediction accuracy curve for the
k-means classifier trained on the first three sessions
for Subject 1. It is predicting the activity on the same
data that it was trained on, so this gives a measure
of how effective the k-means classifier is at repre-
senting the the data. The classification is correct at
a READ sample if the percentage of READ samples
in the 600 sample window centered at that point is
greater than 50%. Similarly for the correctness at the
OPEN samples. For this classifier, the accuracy was
about 89.5%.
Fig. 5 shows the accuracy curve for that same clas-
sifier on the fourth session for Subject 1. This is an
example of testing a classifier on a dataset it was not
trained on. In this case, the accuracy is about 85.4%.
A2E 2018 - Special Session on Analytics in Educational Environments
504
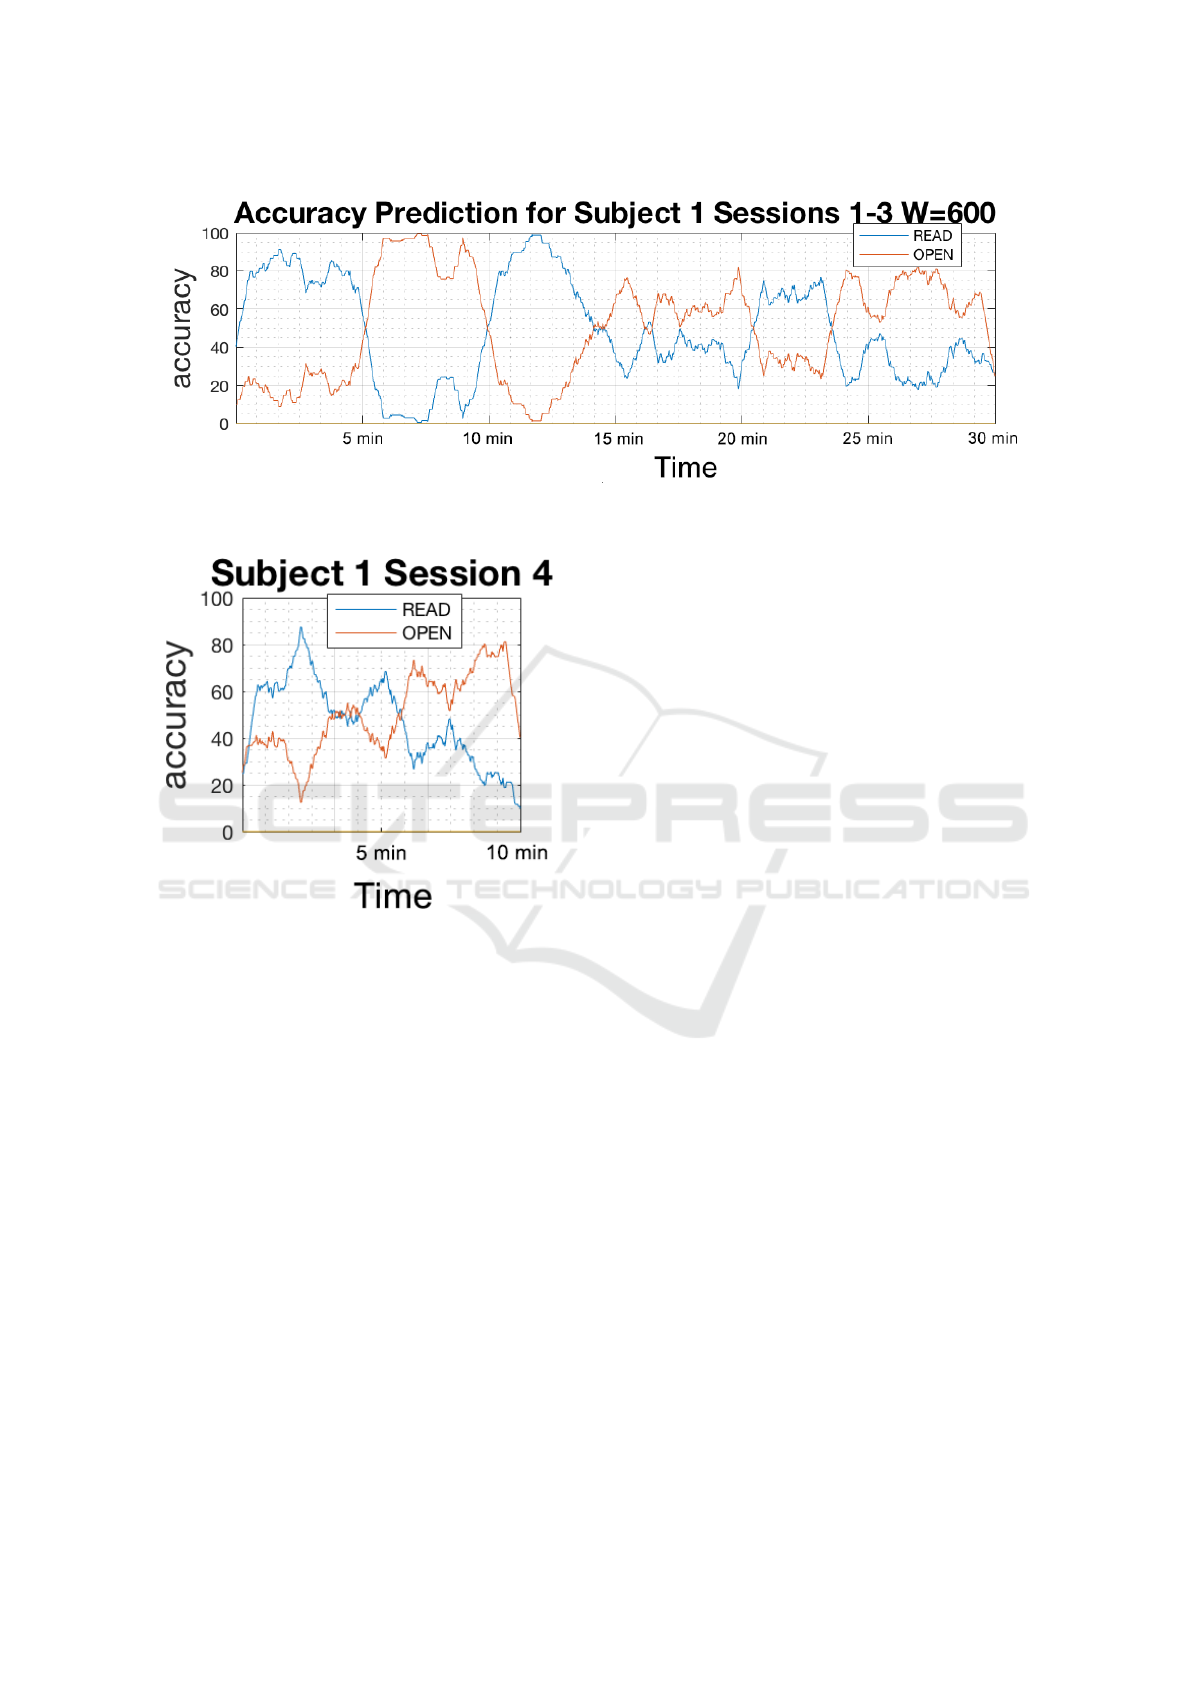
Figure 4: Prediction Accuracy for the training sessions (1-3) of Subject 1 using the classifier in Fig. 3 which provides 89.5%
accuracy overall.
Figure 5: Prediction Accuracy for testing session (4) of
Subject 1 using the classifier in Fig. 3 which provides 84.2%
accuracy overall.
4.2 Using K-means Classifiers in the
Personalized Reading Coach
Our current model for the Personalized Reading
Coach is that after generating multiple READ and
OPEN brainwave datasets for a subject, the k-means
classifier can then be stored in a file (as a collection of
cluster points in 20 dimensional space, each labeled
as either READ or OPEN). The Personalized Read-
ing Coach then provides both real-time auditory and
visual feedback when the READ prediction level over
a 600 sample window drops below a user-specified
threshold. It also generates a summary of the reading
prediction values during the session.
4.3 Cross-validation of READ/OPEN
Prediction
As an initial test of whether this approach would be
effective we performed a four-fold cross-validation on
each of the datasets for our 10 subjects by selecting
one of the four sessions as a testing dataset and re-
maining three as a training dataset, and then deter-
mining how well a k-means classifier trained on the
three training sessions would be able to correctly clas-
sify the activity in the testing session. The accuracy
of the prediction was made in terms of the percent of
samples correctly classified using a 1 minute sliding
window, and we averaged the accuracies over all four
possible testing sets to generate the mean accuracy for
that subject.
Fig. 6 shows a boxplot of this analysis for sev-
eral values of k. One can see that for k=12 we get
a mean accuracy of 71% over all the subjects and all
of the subjects had prediction accuracies in the range
55-85%. Increasing k beyond 12 did not have a sig-
nificant impact on the accuracy of the prediction.
Fig. 7 shows the details, by subject, of the training
and testing results for k=12. The first bar plot (from
the left) shows the accuracy of the k-means classifier
when applied to the dataset it was trained on, with-
out using a sliding window (that is with a window of
size w=1). The second bar plot shows the accuracy of
the classifier on the testing data with no window (i.e.
w=1). The last two bar plots show the accuracy on the
training and testing sets respectively, with a window
of size 600 (corresponding to 1 minute of samples).
We see that there is quite a bit of individual variation
in accuracy, from a low of 55% (just above chance) to
a high of 88%.
A Personalized Reading Coach using Wearable EEG Sensors
505
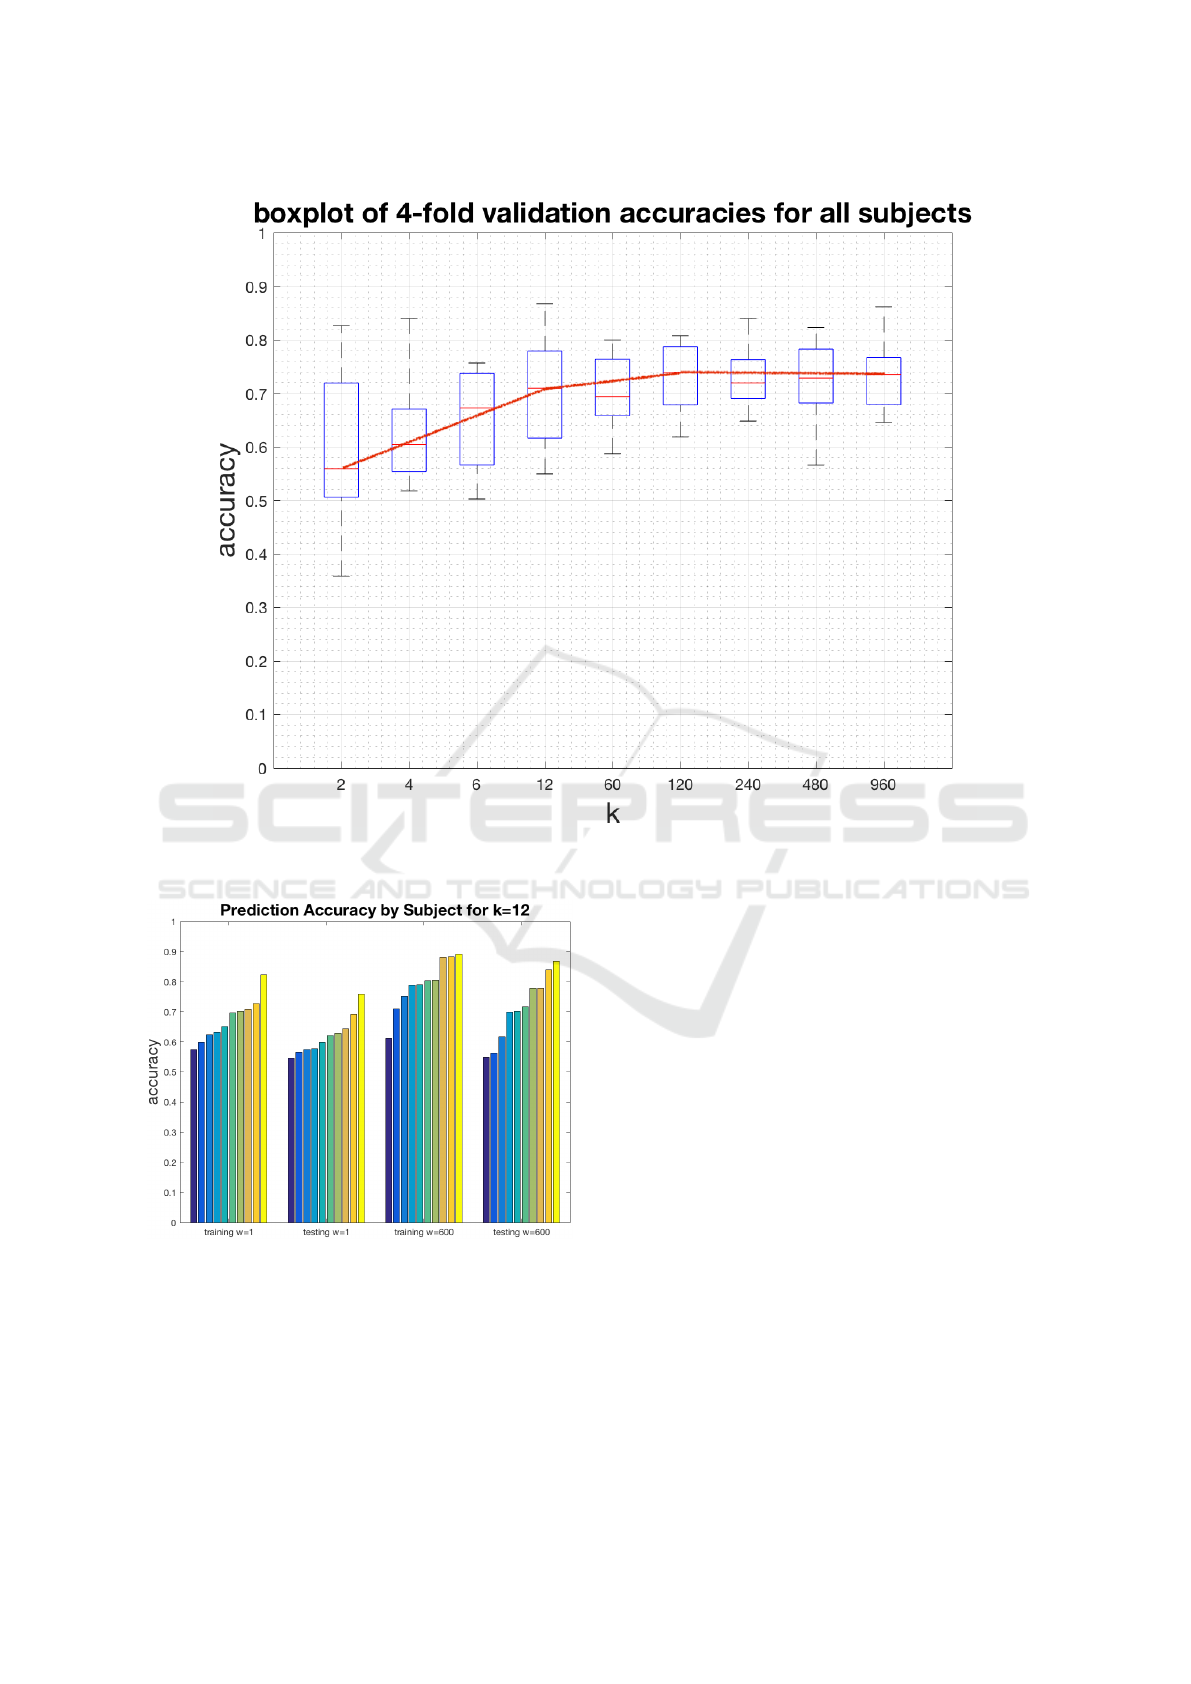
Figure 6: Prediction Accuracy by K The red line connects the means for the k=2, k=12, k=120 and k=960 boxes and shows
that after k=12 there are diminishing returns.
Figure 7: Prediction Accuracy as a function of k in 4-fold
cross-validation for k=12
5 DISCUSSION
Our results provide initial evidence that cortical oscil-
lations recorded from inexpensive, off-the-shelf wear-
able sensors can be used for most subjects to re-
liably distinguish reading comprehension activities
from relaxation/day-dreaming activities. To improve
the accuracy for all subjects, however, we may need
to collect more data and to explore more sophisticated
machine learning algorithms (e.g.. Support Vector
Machines or Deep Neural Networks). We may also
need to record subjects cortical oscillations for longer
periods of time to capture a more fully representative
range of mental activities involved in reading for com-
prehension.
6 LIMITATIONS
This pilot study has a number of limitations that we
plan to address in future research.
The most pressing limitation is the relatively small
size of the data set. We obtained 20 minutes of read-
ing brainwave recordings and 20 minutes of relaxing
brainwave recordings from 10 subjects. By increas-
ing the number of minutes of recorded activity, we
may be able to greatly increase the accuracy of the k-
A2E 2018 - Special Session on Analytics in Educational Environments
506

means cluster classifier. By increasing the number of
subjects, we may be able to better understand the va-
riety of brainwave patterns across readers and perhaps
find patterns that hold across all readers.
There were also mundane challenges in this study.
The battery life of the Muse headband sensor was
about 45 minutes, which is much shorter than most
college students spend in one reading session, hence
we could record only for relatively short periods.
Moreover, the EEG devices we used are sensitive to
large movements by the subjects’ heads. As a result,
we lost about 15% of all potential data because elec-
trodes had lost connection to a subject’s scalp.
7 CONCLUSIONS AND FUTURE
WORK
This pilot study demonstrates the feasibility of a new
approach to using portable brainwave readers to help
users improve their cognitive skills. In this study, we
focused on reading but the same methodology could
be applied to virtually any human activity in which
cognition plays a major role, e.g. musical perfor-
mance, problem solving in mathematics, athletic per-
formance, etc.
We plan on extending the current study by build-
ing the machine learning into the Personalized Read-
ing Coach application and exploring different algo-
rithms for brainwave classification. We will also look
at other cognitive activities besides reading. More-
over, we will focus on the more difficult problem of
using brainwave data to estimate the quality of the
cognitive activity, that is, to what extent are they com-
prehending and remembering what they read.
REFERENCES
Bashivan, P., Rish, I., and Heisig, S. (2016). Mental
state recognition via wearable EEG. arXiv preprint
arXiv:1602.00985.
Hashemi, A., Pino, L. J., Moffat, G., Mathewson, K. J., Ai-
mone, C., Bennett, P. J., Schmidt, L. A., and Sekuler,
A. B. (2016). Characterizing population EEG dynam-
ics throughout adulthood. eNeuro, 3(6):ENEURO–
0275.
Jacobs, G. D. and Friedman, R. (2004). EEG spectral anal-
ysis of relaxation techniques. Applied Psychophysiol-
ogy and Biofeedback, 29(4):245–254.
Kovacevic, N., Ritter, P., Tays, W., Moreno, S., and McIn-
tosh, A. R. (2015). My virtual dream: Collective neu-
rofeedback in an immersive art environment. PloS
one, 10(7):e0130129.
La Marca, J. P. and O’Connor, R. E. (2016). Neurofeedback
as an intervention to improve reading achievement in
students with attention deficit hyperactivity disorder,
inattentive subtype. NeuroRegulation, 3(2):55.
Lee, Y.-C., Lin, W.-C., King, J.-T., Ko, L.-W., Huang, Y.-T.,
and Cherng, F.-Y. (2014). An EEG-based approach for
evaluating audio notifications under ambient sounds.
In Proceedings of the 32nd annual ACM conference
on Human factors in computing systems, pages 3817–
3826. ACM.
Rasey, H., Lubar, J. F., McIntyre, A., Zoffuto, A., and Ab-
bott, P. L. (1995). EEG biofeedback for the enhance-
ment of attentional processing in normal college stu-
dents. Journal of Neurotherapy, 1(3):15–21.
Toplak, M. E., Connors, L., Shuster, J., Knezevic,
B., and Parks, S. (2008). Review of cogni-
tive, cognitive-behavioral, and neural-based inter-
ventions for Attention-Deficit/Hyperactivity Disorder
(ADHD). Clinical psychology review, 28(5):801–823.
A Personalized Reading Coach using Wearable EEG Sensors
507
