
Issue Tracking Systems: What Developers Want and Use
Davide Falessi
1
, Freddy Hernandez
2
and Foaad Khosmood
1
1
Dept. of Computer Science and Software Engineering, California Polytechnic State University,
San Luis Obispo, CA, U.S.A.
2
GoDaddy Inc., San Francisco, CA, U.S.A.
Keywords: Issue Tracking Systems, Survey.
Abstract: An Issue Tracking System (ITS) allows a developer to keep track of, prioritize, and assign multitudes of
bugs, feature requests, and other development tasks such as testing. Despite ITSs play a significant role in
day-to-day developers’ activities, no previous study investigated what developers want and use in an ITS.
The aim of this paper is twofold. First, we provide a feature matrix that maps six of the most used ITS to
features, and second, we measure the developers’ level of use and perceived importance of each feature.
This knowledge has multiple benefits such as supporting the decision of the ITS to use and revealing
promising areas of research and development. Specifically, quality improvement effort should target
improving functionality in use, and development effort should target supporting functionalities needed. In
this paper, we define and extract ten core ITS features and asked more than a hundred developers to rate
their importance and use. Our results show that Advanced Search and Flexible Notifications are the most
important features. Moreover, results show that no feature has been used by more than 90% of the
respondents. Another interesting finding is that 27% of respondents rate Workflow Automation as a useful
or required feature, despite having never used it themselves; this suggests the need to better training,
exposure or of availability of ITS features. In conclusion, our results pave the way to significant research
and development effort on ITS.
1 INTRODUCTION
ITS use is now common and standard in most
development projects. ITSs allow managers to assess
the status of a project at a glance; ITSs also often
facilitate communication among team members.
Various ITSs have been created with differing
specializations such as bug repositories (e.g.,
BugZilla (Serrano and Ciordia, 2005)) or versioning
systems (e.g., GitHub (Dabbish et al., 2012)) and
they have been growing in scope over the years to
provide more and more functionality. Past studies on
ITSs reveal the need for customized information
(i.e., developer-centric approach) and better
reporting (Just et al., 2008). Some of these studies
developed features addressing the need for open
source ITSs such as BugZilla (Baysal et al., 2014)
(Baysal et al. 2013). According to our best
knowledge, there is no study providing a rigorous
investigations on 1) the set of features provided by
different ITSs (Wikipedia is a good non peer
reviewed starting point), 2) what developers want or
use in their ITS.
The aim of this paper is twofold. First, we
provide a feature matrix that maps six of the most
used ITS to features, and second, we measure the
developers’ level of use and perceived importance of
each feature. This aim has multiple benefits:
1) It suggests promising areas of research: In
order to have the highest practical impacts,
quality improvement efforts should target
phenomena related to ITS features that are
important and used.
2) It suggests promising areas of development:
In order to provide better open source ITS,
open source developers should focus their
effort on developing the ITS features that are
important and used.
3) It suggests the ITS to use: Developers and
managers can choose the ITS that best fits
their needs according to what feature is
presented by what ITS.
Falessi, D., Hernandez, F. and Khosmood, F.
Issue Tracking Systems: What Developers Want and Use.
DOI: 10.5220/0006818405430548
In Proceedings of the 13th International Conference on Software Technologies (ICSOFT 2018), pages 543-548
ISBN: 978-989-758-320-9
Copyright © 2018 by SCITEPRESS – Science and Technology Publications, Lda. All rights reserved
543
2 METHODOLOGY
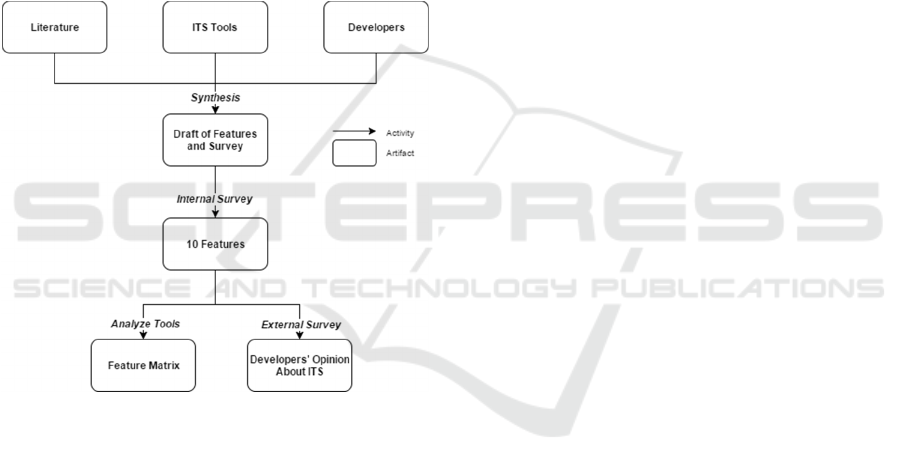
Figure 1 reports our approach. Specifically, we define
an initial set of features by synthesizing knowledge
from the literature on ITS and the features provided in
the ITSs we studied. Afterwards, we informally
interviewed 20 developers working on a university-
based research project called Digital Democracy
(www.digitaldemocracy.org). Later, by performing
an internal survey inviting the same 20 developers,
we define a set of core features that are self-
contained, useful, and independent of specific ITSs.
Next, we define a feature matrix that maps six of the
most used ITS to specific features. Eventually, we
identify the developers’ perceived importance and
usage of each feature by surveying more than a
hundred developers.
Figure 1: Research Method.
We design a web-based survey to collect the
opinions of developers who have experience using
ITSs. We apply the survey design principles
suggested in the software engineering literature
(Kitchenham, 2002). The questionnaire begins with
a short introduction about the purpose of the study.
The introduction also informs about our incentive to
participate: a chance to win one of three $100
Amazon gift cards. The rest of the questionnaire is
divided into the following parts:
2.1 Consent
In order to be compliant with Public Health Services
guidelines for the use of human subjects in research,
a short introduction about consent to participate in
the survey is provided. Respondents are also
informed that their results will be kept confidential.
2.2 Demographics
We ask respondents how many years of industry
development experience they possess, as well as
which country they live in, and their years of
experience using an ITS.
2.3 Qualification
To determine if a respondent has a basic
understanding of what an ITS is, we ask:
In most ITSs you can assign bugs to:
A. A specific person
B. A specific group of persons
C. All of the above
D. None of the above
We consider C to be the only correct answer.
2.4 ITS Features
In the final section of the questionnaire, we ask
respondents to answer two questions for each of the
ten selected features. Features and their
corresponding questions are shown one per page.
For each feature, we report its name, a description
will be reported in Section 3, and an example of use.
Afterwards, for each feature, we ask:
Have you ever used this feature?
• Yes
• No
• I do not know.
Please report your perceived importance of this feature.
• Required: My ITS must provide this feature. If my current
ITS did not provide this feature, then I would exchange it
for an ITS providing this feature.
• Useful: I would use this feature if my ITS provided it. If
my current ITS did not provide this feature, then I would
not exchange it for an identical ITS providing this feature.
• Useless: I would not use this feature even if my ITS
provides it.
• I do not know.
After completion of the survey, respondents are
asked to provide an optional email address if they
wish to participate in the drawing incentive.
2.5 Instrument Evaluation and
Distribution
The survey is distributed to developers of different
software development companies via personal
emails. The developers have been chosen via
convenience sampling, i.e., we invited the
ICSOFT 2018 - 13th International Conference on Software Technologies
544

developers we knew. The invitation asks
respondents to forward the survey to other
colleagues eligible to participate in the survey. We
keep the survey open for two weeks. The survey
allows only one answer per computer.
2.6 Threats to Validity
One possible threat to external validity of the results
of the survey is that responders are self-selecting
volunteers. However, we feel this is necessary in
order to assess the opinions of a diverse set of
developers given minimal resources. Another threat
to the validity of the results is the large proportion of
respondents from the United States (Figure 3); this
may have introduced a bias towards the opinions of
software developers in the United States. However,
statistical result show no significant impact of the
geographic location of the respondents to the level
of usage or level of importance of a feature.
3 TEN CORE ITS FEATURES
A group of four individuals (the first two authors
plus two developers) analyzed several popular ITSs,
looking for common and important features. Using
the product websites and documentation, we extract
ten core features that are self-contained, useful, and
independent to specific ITS. More precisely, all
features are distinct and atomic (i.e., it is not
possible to have only part of the feature
implemented in a tool), commonly found in ITS
tools (and hence somehow useful), and not described
according to a specific ITS implementation (i.e.,
there may be minor variations in implementation of
the feature across ITS). We describe each extracted
feature in the following subsections.
3.1 Advanced Search
The ITS search functionality provides filters for each
of the following criteria: all issues, type of issue,
value of a specific issue (e.g., “priority > 1, date <
1/1/1999, author = Megan”), any combination of the
above.
3.2 Graphical Reporting
The ITS provides graphical reports of project data
such as for instance the trend of open vs. closed
tickets.
3.3 Flexible Issue Deadlines
The ITS, when creating an issue, allows its deadline
to be set to a date (e.g., 4/10/15), or to a release
deadline (e.g., "Milestone 3", "v3.0.1", ...).
3.4 Flexible Notifications
The ITS allows the user to configure alerts (e.g.,
email) by choosing among the following triggers:
issue creation, modification of a specific issue
attribute (e.g., closing an issue, changing priority,
etc.).
3.5 Version Control Integration
The ITS allows the user to obtain knowledge by
merging information coming from both the ITS and
the version control system.
3.6 Grouping Issues
The ITS allows panels showing issues filtered by: all
issue, type of issue, value of a specific issue attribute
(e.g., priority > 1, date before 1/1/1999, author =
Markus), any combination of the above.
3.7 External Issue Creation
The ITS allows the user to create an issue via an
external source such as by emailing a specific
address with a specific subject.
3.8 Workflow Automation
The ITS allows the automation of a custom
workflow. For instance, the values of issue attributes
are updated automatically when values of other issue
attributes change.
3.9 Workflow Enforcement
The ITS allows the enforcement of a custom
workflow. For instance, values of issue attributes
can only be modified or assigned if certain
preconditions based on values of other issue
attributes are satisfied.
3.10 SQL-like Search
The ITS allows the user to query issues by using
SQL-like syntax.
Issue Tracking Systems: What Developers Want and Use
545
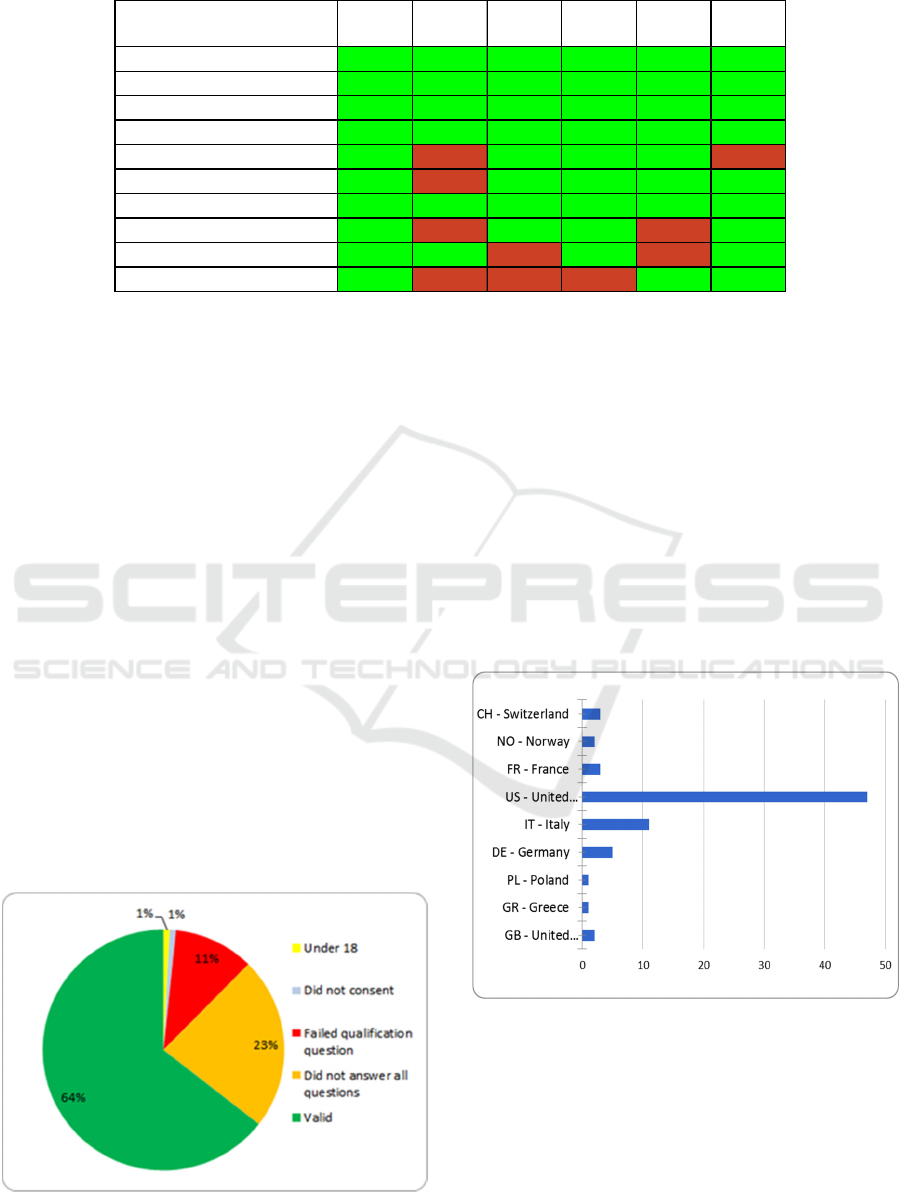
Table 1: ITS and their features.
4 FEATURE MATRIX
After extracting the ten features, we determine
which ITS supports which of the ten features. Table
1 shows the feature matrix that maps which ITS
supports which features.
JIRA notably supports all ten features, while
Redmine supports just above half of the features. We
note how JIRA is the only commercial ITS whereas
all the other ITSs are all free to use.
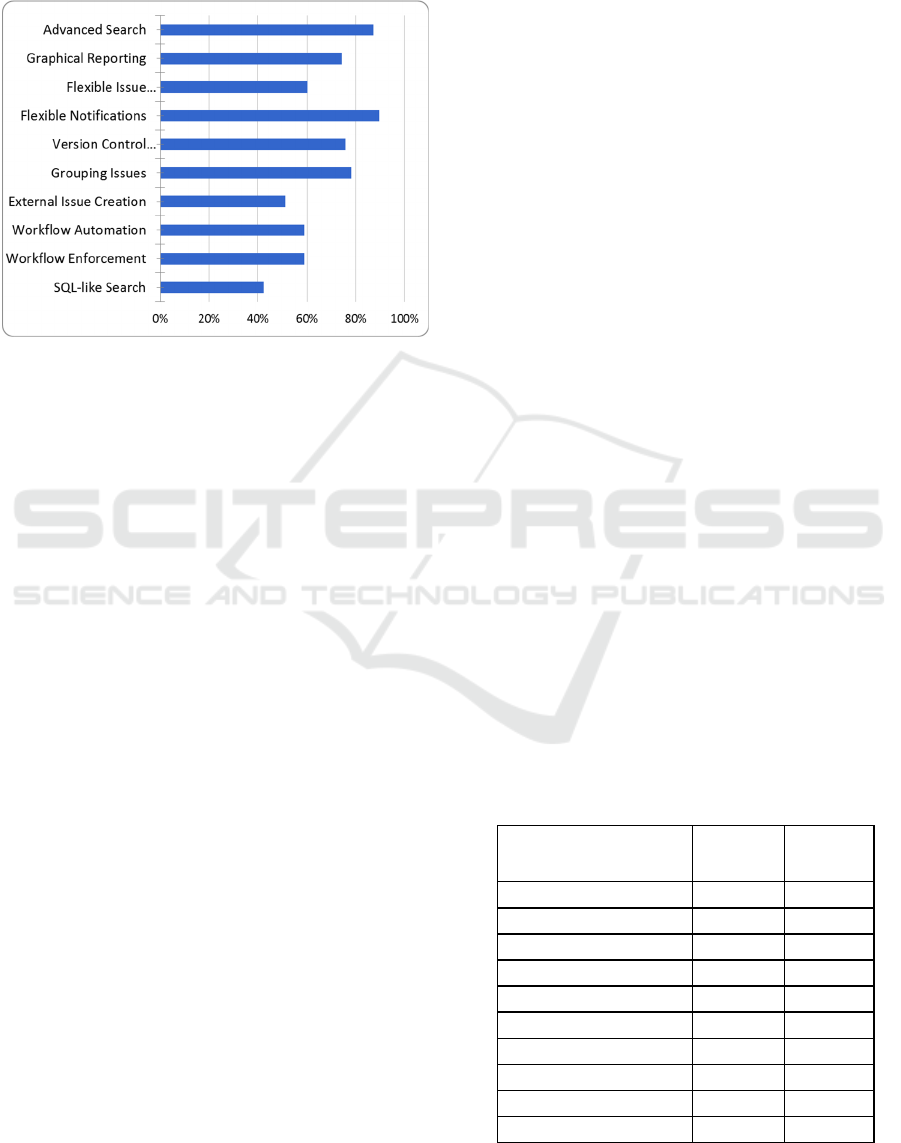
4.1 Qualification
Figure 2 summarizes the categories of responses we
receive. Specifically, out of 121 responses, 43 are of
no use to our analysis. Of these 43, there are two
respondents who do not meet the consent criteria,
and 13 who incorrectly answer the qualification
question. Moreover, although we cannot force
respondents to answer all questions, we need all
questions answered in order to analyze the data.
Thus, we do not consider the data from 28 respond-
Figure 2: Valid and invalid response categories.
ents who fail to answer all questions in our survey.
The following results are based on the 78 valid
responses received.
4.2 Demographics
Figure 3 reports the geographical distributions of
respondents. The 78 respondents come from the US
(60%) and Europe only (40%). Italy is the European
nation with the highest respondents (14%).
Additional results show that respondents have
experience using an ITS ranging from 0 to 20 years,
with an average of 6 years.
Figure 3: Number of respondents’ countries of residence.
4.3 Which Is the Most Used Feature?
Figure 4 describes the number of respondents that
have used specific features. According to Figure 4,
the top three most used features are Flexible
Notifications (90%) and Advanced Search (87%).
The least used feature is used by less than half of the
JIRA Redmin
e
Pivotal
Tracker
ZenHub GitHub Bugzilla
Advanced Search yes yes yes yes yes yes
Graphical Reporting yes yes yes yes yes yes
Flexible Issue Deadlines yes yes yes yes yes yes
Flexible Notifications yes yes yes yes yes yes
Version Control Integration yes no yes yes yes no
Grouping Issues yes no yes yes yes yes
External Issue Creation yes yes yes yes yes yes
Workflow Automation yes no yes yes no yes
Workflow Enforcement yes yes no yes no yes
SQL-like Search yes no no no yes yes
ICSOFT 2018 - 13th International Conference on Software Technologies
546
respondents and it is Feature 10: SQL-like Search
(42%). It is interesting to note that no feature has
been used by all respondents. This suggests that
different respondents use different features.
Figure 4: Percentage of respondents who have used a
feature.
4.4 Which Is the Most Important
Feature?
Figure 5 describes the number of respondents who
perceive the feature as useless, useful, required or I do
not know. There is clearly a cluster of four features
which have the lowest percentage of useless and the
highest percentage of required: Advanced Search,
Flexible Notifications, Version Control Integration
and Grouping Issues. Moreover, SQL-like Search is a
feature that has the highest percentage of useless and
the lowest percentage of required.
4.5 Does Importance Correlate with
Usage?
We merge the results from Figure 4 and 5 to find a
correlation between the importance and the usage of
ITS features. To measure the strength of the
correlation we use the Spearman coefficient (Pirie,
2008) because it is nonparametric; and, hence, it is
conservative and reliable. We coded the level of
usage with 1 if a feature is used, 0 otherwise. We
coded the level of importance with 1 if a feature is
perceived as Required or Useful, 0 otherwise. The
result of the coding is provided in Table 2. The
Spearman correlation between usage and importance
of features is 0.9725 with a P-value < 0.0001. The
correlation can be easily observed in Figure 6. This
results suggest an extremely strong correlation
between usage and importance of features.
It is worth noting that five out of ten features
have been used by no more than 60% of the
respondents. Moreover, for all ten features, the
percentage of respondents rating the feature as
useful (or required) is higher than the percentage of
respondents who used the feature. For instance, there
are 27% of respondents that, despite never having
used Workflow Automation, still rated it as useful
(or required).
5 CONCLUSION
Although the software development community has
strong opinions on the functionality and capabilities
of ITS products, reports on the perceived importance
of specific ITS features are rare. In this paper, we
design and conduct a survey to measure the
perceived comparative level of importance and of
use of 10 features offered by some ITS products.
After extracting the features and obtaining more than
a hundred developers’ opinions on them, we found
that Advanced Search and Flexible Notifications are
the most used and important features. These two
features are the ones that researchers and developers
might improve.
As expected, we observed a high correlation
between level of usage and of importance. However,
no feature has been used by more than 90% of the
respondents. Moreover, all features have been
identified as useful (or required) by some
respondents even if never used. The most relevant
example is Workflow Automation which has been
rated as useful (or required) by 27% of respondents
that never used it. We believe this difference
between importance and usage might be due to the
absence of training, exposure and / or availability of
Table 2: Level of importance and usage of features.
Importance Usage
Advanced Search 96% 87%
Graphical Reporting 88% 74%
Flexible Issue Deadlines 83% 60%
Flexible Notifications 96% 90%
Version Control Integrati
o
95% 76%
Groupi ng I ssues 95% 78%
External Issue Creation 77% 51%
Workflow Automation 86% 59%
Workflow Enforcement 82% 59%
SQL-like Search 68% 42%
Issue Tracking Systems: What Developers Want and Use
547
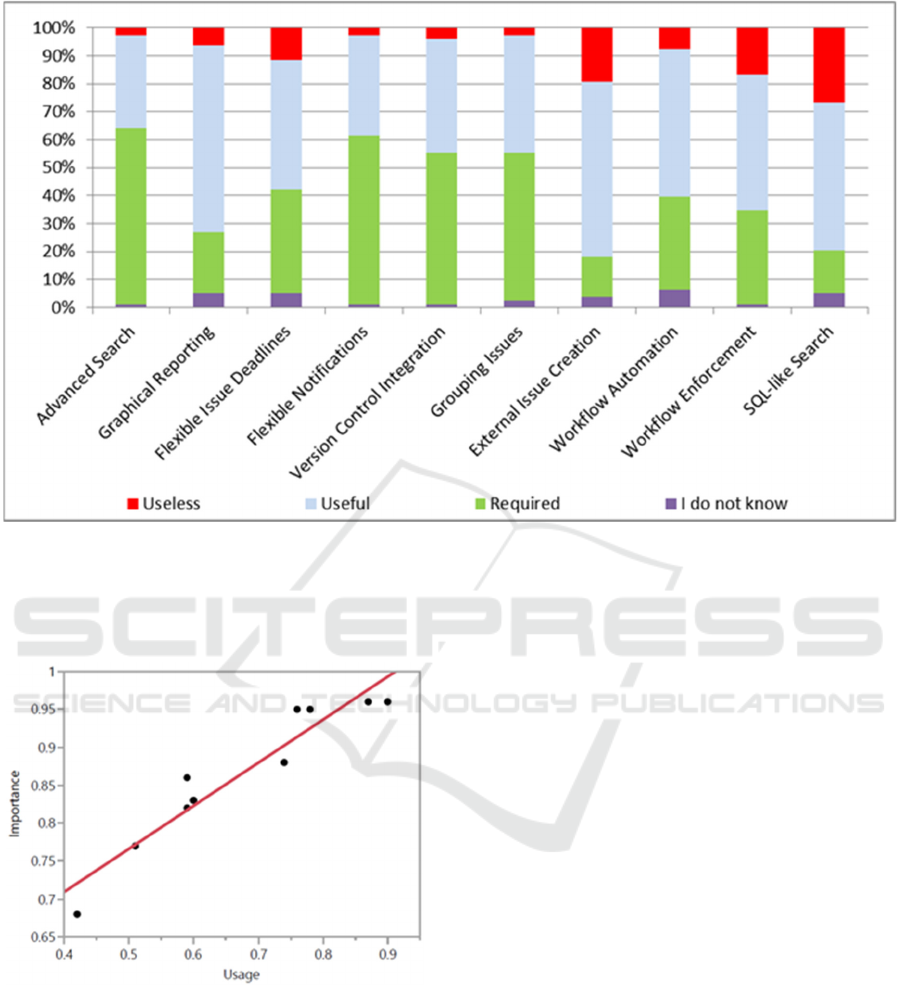
Figure 5: Perceived level of importance of features.
the feature in the ITS in use. These results are useful
to support the decision of the ITS to use and to
reveal promising areas of research and development.
Figure 6: Linear regression between importance and usage
of a data.
REFERENCES
Serrano, N., & Ciordia, I. (2005). Bugzilla, ITracker, and
other bug trackers.Software, IEEE, 22(2), 11-13.
Dabbish, L., Stuart, C., Tsay, J., & Herbsleb, J. (2012,
February). Social coding in GitHub: transparency and
collaboration in an open software repository. In
Proceedings of the ACM 2012 conference on
Computer Supported Cooperative Work (pp. 1277-
1286). ACM.
Baysal, O., Holmes, R., & Godfrey, M. W. (2014,
November). No issue left behind: Reducing
information overload in issue tracking. In Proceedings
of the 22nd ACM SIGSOFT International Symposium
on Foundations of Software Engineering (pp. 666-
677). ACM.
Baysal, O., Holmes, R., & Godfrey, M. W. (2013, May).
Situational awareness: personalizing issue tracking
systems. In Proceedings of the 2013 International
Conference on Software Engineering (pp. 1185-1188).
IEEE Press.
Kitchenham, B. A. (2002). Principles of Survey Research
Part 2: Designing a Survey Barbara A. Kitchenham
Department of Computer Science Keele University,
Staffordshire, UK. ACM SIGSOFT Software
Engineering Notes,27(1), 18.
Pirie, W. (1988). Spearman rank correlation coefficient.
Encyclopedia of statistical sciences.
Just, S., Premraj, R., & Zimmermann, T. (2008). Towards
the next generation of bug tracking systems. In IEEE
symposium on Visual languages and Human-Centric
computing, 2008 (pp. 82-85). IEEE.
ICSOFT 2018 - 13th International Conference on Software Technologies
548
