
Business Intelligence
Implantation on Federal Institute of Triângulo Mineiro (IFTM) System
Ernani Damasceno
1
, Ana Azevedo
2
and Agostinho Pinto
2
1
Department of Computing, Federal Institute of Triangulo Mineiro, Campus Paracatu, Brazil
2
Information Systems Department, ISCAP/ Polytechnic of Porto, Porto, Portugal.
Keywords: Information System, Analytics, Academic Registration Control, BI Data Mart.
Abstract
: Every organization aims to perform the activities in an efficiently way at selling products and services to
obtain profits. However, most of the times, there is not an effective project to support the company in the
process management. Every information system (IS) must be efficient, supported by substantial and fast
computer system and trained users to manipulate them without troubles. Based on this assumption, this
paper aims to analyze possible vulnerabilities in the Federal Institute of Triângulo Mineiro (IFTM) system
in order to implant a Business Intelligence (BI) system to help at decision making. It was noticed that the
IFTM- Paracatu campus system does not have proper Analytics tools to help managers in the decision
making. Thus, after a detailed survey of the necessity of the system, it was verified that the institute
secretary module, named Academic Registration Control (ARC), has important failures, for example,
delaying, inconsistent information and repetitive processes. As noted above, it was created a BI Data Mart
on ARC module, in order to solve basic failures, such as: weak reports, inconsistent student records and lack
of graphical analysis.
1 INTRODUCTION
Organizations need to continuously launch new
products and services, develop new tecnologies,
create new businesses and increment results
(Chiavenato, 2010). It is known that innovations are
necessary for every company which wants to grow,
so it is very important to use the appropriate
information system to control and to help at decision
making. Coordinators of the Federal Institute of
Triângulo Mineiro (IFTM) were faced with various
difficulties to access students’ data. Thus, it was
verified the necessity to implant tools to help
managers in decision making.
It is important to emphasize that an information
system based on a high quality computer, updated
and used in the correct way are the soul of well
succeed organizations nowadays (Stair and
Reynolds, 2015).
So, the use of tools to facilitate the data
interpretation may help the institution to make
strategies in order to help at making decisions.
Based on this assumption, it was verified that the
information system of IFTM, dos not have tools to
colect data to help the managers. Thus, after collect
the information about the system, the use of
Business Intelligence solutions give the support to
transform the data of academic department because
all students information are in this module of the
system.
The contribution of this paper is to reflect on
how to help organizations to better use data with
analytics tools. It shows some inportant thing,
namely that when managers understand the value of
analytics, they make investments in technology; thus
managers realyze that data analytics are not used
only in IT department but in all the organization; and
data analytics can help the organizations to achive
excellence.
This paper is organized as follows. Section 2
describes the background with relevant theoretical
subjects. Section 3 introduces the methodology
adopted. Section 4 refers to the results with the
dashboards. Section 5 demonstrates the discussion of
the results. Finally, section 6 presents the
conclusions.
528
Damasceno, E., Azevedo, A. and Pinto, A.
Business Intelligence.
DOI: 10.5220/0006818805280535
In Proceedings of the 10th International Conference on Computer Supported Education (CSEDU 2018), pages 528-535
ISBN: 978-989-758-291-2
Copyright
c
2019 by SCITEPRESS – Science and Technology Publications, Lda. All rights reserved

2 BACKGROUND
It is very important for every researcher to have
knowledge about previous research, in other words,
what were the discoveries found, what they said and
how they approached about a specific issue. Thus, a
scientific study has the condition to offer
innovations and improvements throughout new ideas
and experiments.
2.1 Information System (IS)
Information System is a set of interrelated
components that collect, manipulate, store and
disseminate data and information and provide a
mechanism of feedback to achieve a goal. This
mechanism helps the organizations to raise the
profits or enhance services to consumers (Stair and
Reynolds, 2015).
It is important to emphasize that innovations are
very important for a company success, then it is
necessary the use of a system to control and to help
at making decisions.
Technologies and IS are the main tools of the
organizations to create new products and services, as
well as an entirely new business model (Laudon and
Laudon, 2010).
When data are organized in a significant manner,
they become information that is, in fact, a collection
of organized and processed facts so that they have
additional value which expand beyond the value of
individual facts (Stair and Reynolds, 2015).
2.2 Business Intelligence
Business Intelligence (BI) systems combine data
with analytic tools in order to provide relevant
information to make decisions (Santos and Ramos,
2009). It means, to survive in a dynamic business
environment it is necessary that the organizations
have the relevant and timely business information to
support them in all decisions (Deshpandea, Ahmeda,
and Khodea, 2016).
Business Intelligence is an umbrella term that
includes the applications, infrastructure and tools,
and best practices that enable access to and analysis
of information to improve and optimize decisions
and performance (Turban, at all, 2009). Moreover, it
is considered a content free expression, therefore, it
means different things to different people. BI deals
with the capture of data, information and knowledge
that allow companies to compete more efficiently in
an evolutionary approach of data modelling. This
data is used to promote the structuring of
information at retrospective and historic warehouse,
allowing modelling with analytic tools (Barbieri,
2001).
2.3 Objectives and Benefits of BI
The main objectives of BI are to allow the
interactive access to data (sometimes in real time),
provide the manipulation of these data and supply
managers and analysts with the capability of making
appropriated analysis (Turban, at all, 2009). After BI
implementation, the decisions are based in facts not
in the individual perceptions of one member of the
organization. BI is linked to collect, store and
analysis of data, and among other very important
things, provide access to data in an easy and fast
way, in other words, there is the empowerment of
the user because the user gets the information more
easily without redundant data. Eckerson (2003),
quoted by (Turban, at all., 2009), shows the results
of a research among 510 organizations which
demonstrate the benefits of BI according to
participant visions. The benefits are:
Time Saving (61%)
Unique version of true (59%)
Better strategies and plans (57%)
Better tactic decisions (56%)
More efficient processes (55%)
Cost savings (37%)
Thompson (2004), also cited by Turban, at all.,
2009, reported from a survey that the greatest
benefits of BI are:
Faster and more accurate reporting (81%)
Better decision making (78%)
Better customer service (56%)
Higher revenue (49%)
So, it can be concluded that there are many benefits
of BI, both the intangibles reported by Eckerson
(2003) and the generation of reports described by
Thompson (2004).
2.4 Typical Architecture of a BI
System
In the 1970s, companies began using reporting
systems such as Management Information Systems
(MIS). However, these systems were statics, two-
dimensional and did not have analysis tools. MIS is
an organised set of people, processing, software,
database and equipment which provide routine
information to managers and decision makers who
Business Intelligence
529
focuses in the operational efficiency (Stair and
Reynolds, 2015). In the 1980s started the concept of
Executive Information Systems (EIS). This system
helps the managers of high hierarchy, including the
president of the company, the vice-president and
members of director council to make better decisions
(Stair and Reynolds, 2015).
The difference between EIS and the other
systems is that new resources to generate dynamic,
multidimensional, prognostic and forecast reports
were introduced. Posteriorly, these and additional
resources were named as BI, which uses the data of
the systems of the companies to support in decision
making (Turban, at all., 2009).
Nowadays, it is recognized that all the necessities
of information executives may be in a good business
intelligence system based on BI (Turban, at all.,
2009). A BI system has four major components: a
Data Warehouse (DW) with its source of data; the
Business Analytics environment, a collection of
tools for manipulating and analysing data in the DW,
including Data Mining; Business Performance
Management (BPM), for monitoring and analysis
performance; and a user interface (such as a
dashboard) (Turban, at all., 2009).
2.5 Business Analytics Environment
(BA)
Business Analytics (BA) is a broad category of
applications and techniques for gathering, storing,
analysing, and providing data access to help
business users make better business and strategic
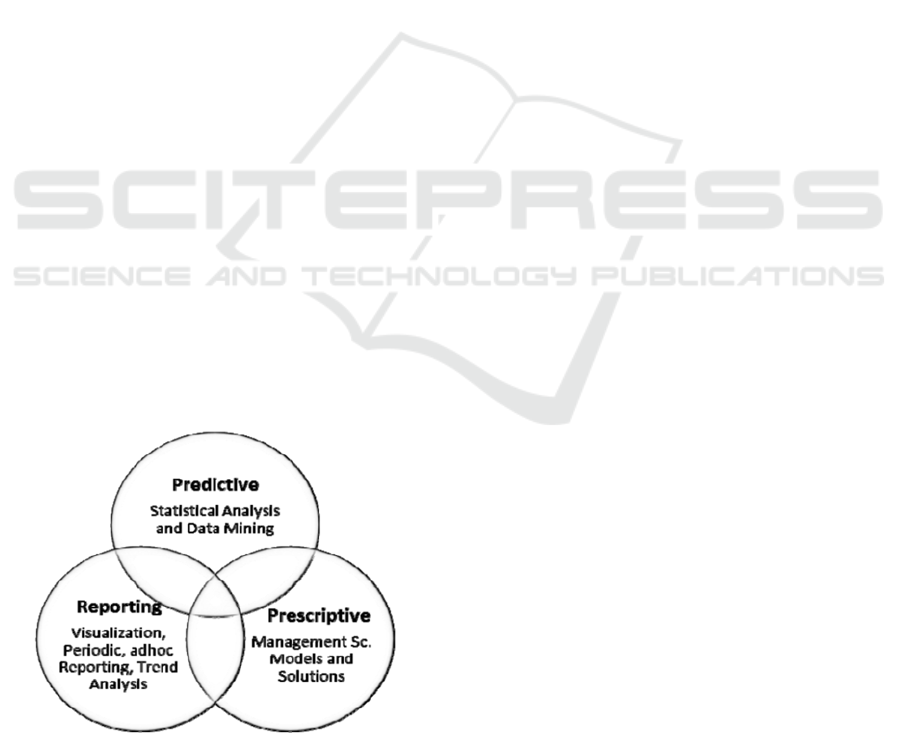
decisions (Turban, at all., 2009). Figure 1 shows the
three types of Analytics proposed by (Sharda,
Asamoah, and Ponna, 2013).
Figure 1: Three Types of Analytics.
Predictive analysis is used to examinate future
possibilities and it is made through an investigation
of each situation individually. It is necessary to
check the events, purchase habits, consumption
history, and others; this type of Analytics helps in
decision making, mapping possible developments. It
can also be said that this Analytics has a set of
technologies, for example data mining that discovers
relationships and patterns within large volumes of
data that can be used to predict behaviour and
events. Therefore, the predictive is oriented towards
the future, using past events to anticipate the future
(Barneveld, Arnold, and Campbell, 2012).
What defines Analytics of the type reporting or
descriptive is the urgency, that is, it will check in
real time all the data needed to make an immediate
decision. Descriptive Analytics is the most
commonly used and best understood Analytics type.
Descriptive analysis categorizes, characterizes,
consolidates, and classifies data. Descriptive
Analytics includes dashboards, reports (for example,
budget, sales, revenue and costs) and various types
of queries (Lustig and Brenda Dietrich, 2017).
Prescriptive Analytics examines data to evaluate
the possible consequences of each decision that the
manager makes. Prescriptive Analytics provides
information about what to do in a specific situation.
The prescriptive model uses an understanding of
what happened, why it happened and a variety of
"what can happen" analytics to help the user
determine the best course of action to be
accomplished through models and solutions.
Prescriptive analytics is usually not just with an
individual action, but it is in fact a set of other
actions (Maydon, 2017).
Thus, in order to understand the structure,
policies and operations of a company, analytics tools
are very important because it recommends solutions
that allow the organization to achieve its objectives.
To do so, it includes goal definition, how these goals
connect to more specific goals, determining the
action plans how an organization has to commit to
achieve those goals, and estipulate how different
business units and internal and external stakeholders
interact.
2.6 Interface
Because it is important to provide the user with a
more interactive way of viewing and analysing data,
dashboards have been used in this work since they
are one of the most commonly used interface types
in BI systems. A dashboard system can be a
sophisticated set of tools for gathering, analysing,
A2E 2018 - Special Session on Analytics in Educational Environments
530
and presenting data. At the end user, modular panels
can be easily designed and redesigned with a
graphical user interface (Maheshwari, 2015).
Dashboards provide lots of information on a single
screen and display quantitative measurements of
what is happening at a given time (Turban, at all.,
2009). However, dashboards have some advantages,
such as ease of management, through the broad and
intuitive view of project performance. It is possible
to get the visualization of a series of important
information and data for the execution of the team
activities and all this in a panel of easy handling and
shared by everyone. In summary, dashboards are
excellent project management tools and can
significantly contribute to faster results and more
agile decisions throughout project execution.
This work was made using Pentaho software,
because it is an appropriate tool for the solution of
the IFTM information system, since it is free and
easy to manipulate. This software developed by
Pentaho Corporation in 2004 provides tools and
services to create custom dashboards to support
large views of data and projects that make analytical
views clearer and more real.
3 METODOLOGY
This chapter shows the methodology used in this
article. From the OLTP system of IFTM, fact tables
and their dimensions were created with the star
schema adopted in the Data Mart of this work.
However, dimensional models implemented in
relational database management systems are referred
to as star schemas because of their resemblance to a
star-like structure. Dimensional models implemented
in multidimensional database environments are
referred to as online analytical processing (OLAP)
cubes (Kimball and Ross, 2013).
We can also see in this chapter the databases
analysis of IFTM using OLAP tools. Data
warehouse concept is used to demonstrate the tools
and BI solutions applied to the system of the
institution. The Data mart was adopted to solve the
problems of the academic department.
Then, through tools from the Pentaho software,
the data analysis information was generated in a
more specific way, responding to the demands of the
CRA department.
Finally, some simple dashboard models were
developed to help with data visualization, as
requested by the coordinator of the academic record
department.
3.1 IFTM Database
In order to create a Data Warehouse, a detailed
understanding of the relationships of the database
tables is required. In this way, the documents
necessary for the understanding of the DB were
requested to the coordination of the design and
elaboration of the system. Academic registration
department was chosen to implement Data mart
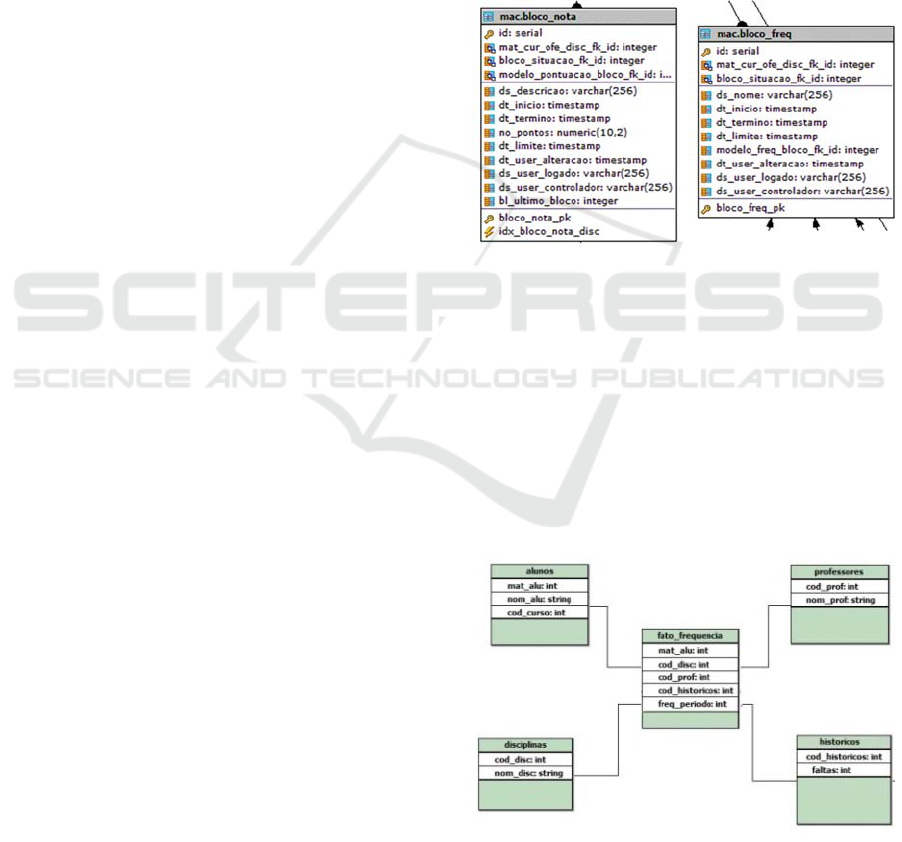
tools. The databases document contains a schema
named MAC with all tables and attributes used in
the system. Figure 2 illustrates the tables of
attendance and grades.
Figure 2: Tables of attendance and grades.
3.2 Fact Tables
The fact tables consist of the main components of
multidimensional models, since they allow storing or
recording the events to be analysed. (Santos and
Ramos, 2009). The fact tables and their dimensions
with the star schema adopted in the Data Mart of this
work were created from the database tables of IFTM
academic module. Figure 3 illustrates the star
schema of student’s attendance.
Figure 3: Fact table of student attendance.
Business Intelligence
531
3.3 Data Mart Implementation
In order to do this work, the Pentaho Community
Data Integration tools were used (Pentaho, 2017),
with the objective of analyzing data from the IFTM
database and creating the Data Mart for possible
solutions to the issues mentioned. It is very
important to use the ETL process in this phase
because it is necessary to integrate the data selecting
the best information to be used in decision aspects.
The next step was to create the extraction and
transformation of the data in order to elaborate the
Data Mart for later loading into the analysis tools.
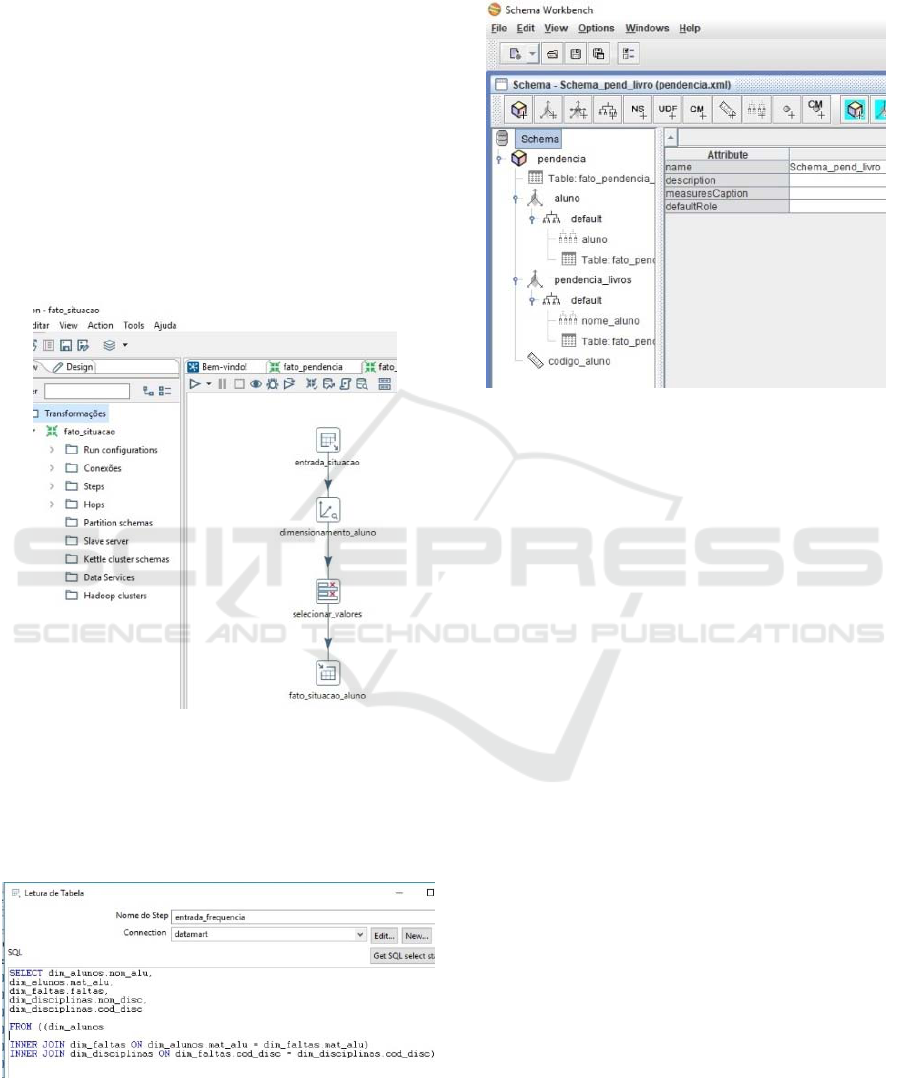
Figure 4 shows the creation data extraction and
transformation of the student's situation.
Figure 4: Transformation of the student's situation.
In Figure 5 it can be observed that only one
dimensioning tool was used, since the integration of
other dimension tables was done through a SQL
command.
Figure 5: Dimension tables with SQL command.
Afterwards, the OLAP cube were created after the
transformation of the control of books handed back,
as can be seen in figure 6.
Figure 6: Cube to control of books hand back.
Thus, the same processes were made regarding the
student's attendance, the occurrences received, the
situation of the student to conclude the course and,
finally, the pending books not handed back by the
students.
After the cubes are prepared, it is necessary to
make a publication to the analysis tools that are
demonstrated in a later sections. For this, it is
necessary to connect the DBMS, in this case
MySQL, with the administration_console tools,
through the address http: // localhost: 8099. It should
be noted that, the local server Tomcat was used for
the preparation of this work to use the tools of BI
solutions.
The OLAP tool chosen for Data Mart analysis is
Hitachi Group's Pentaho Business Analytics, a
leading data integration and business analytics
company, based on the open source platform for a
number of important data implementations (Pentaho,
2017).
It is not necessary to install Pentaho on the
computer. The user must download the files and put
them in a folder of his/her choice and run the file
start-pentaho.bat. Then enter the address http://
localhost:8080 into a browser, enter the username
and password. Soon after, the user can browse the
PUC (Pentaho User Console). After that, the user
can make reports using several tools, like Saiku,
Report Designer, Ctools, and JPivot.
All Schemas with OLAP cubes published from
Mondrian will be available for analysis. In this case,
tools will be used to load the cubes data into JPivot,
A2E 2018 - Special Session on Analytics in Educational Environments
532
a library that works from JSP tags, which allows the
user to execute typical OLAP navigations such as
slice and dice, drill-down and roll-up. Finally, the
Ctools-CDE tool was used, which allows the
development and implantation of dashboards quickly
and effectively.
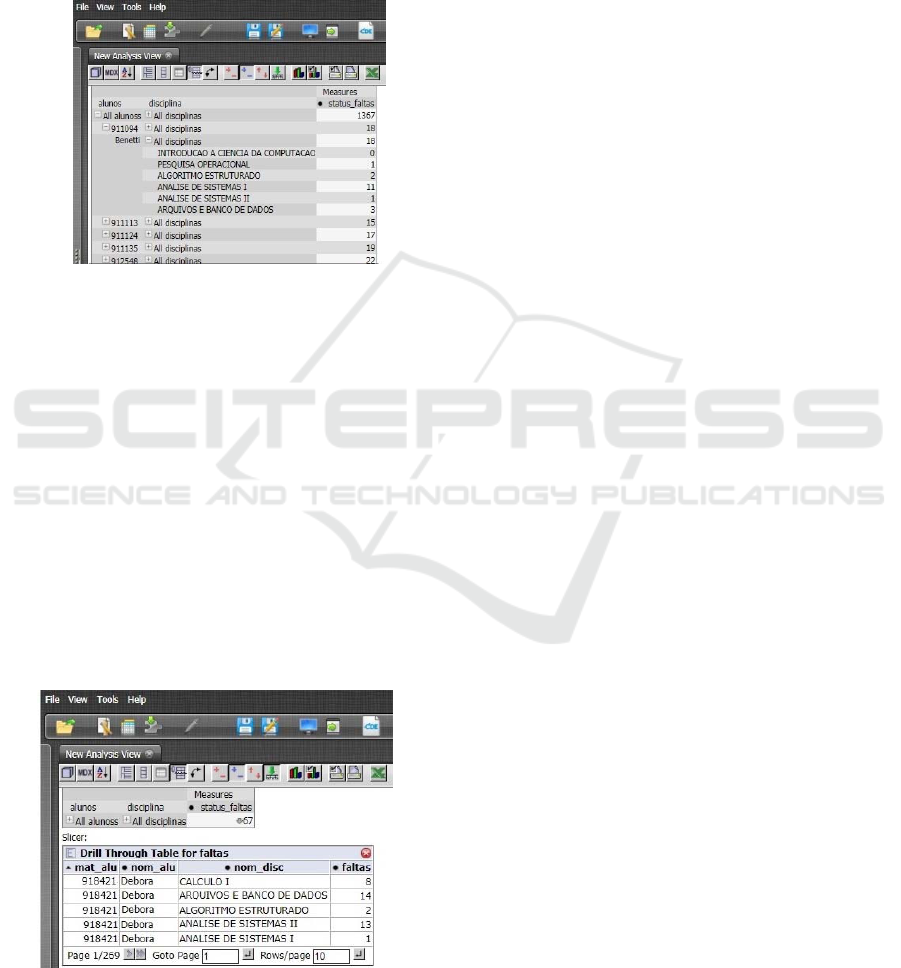
Figure 7 shows the analysis of the number of
student absences distributed by the subjects studied.
Figure 7: Absences analysis by subjects.
From the analysis presented, it is firstly shown that
the data of all the students in all the courses of the
program are loaded, generating the total of absences.
If the user needs more detail in the analysis, it is
necessary to click on the button with the "+" symbol
of “All alunos” to show the students listed by the
registration number with the overall total of
absences and, in the "+" symbol of “All disciplinas”,
to specify the number of absences by discipline. This
type of detail is called drill down, where the level of
detail of the data changes as the user specifies the
search, examining the data at different levels in the
hierarchy.
Next, figure 8 illustrates the operation of drill-
through.
Figure 8: Drill through analysis by absences.
When you want to do a more detailed analysis, you
can execute a drill-through query, in which you can
see all the individual transactions that contributed to
the aggregated data in the OLAP cube. In other
words, the user can retrieve the data in a lower level
of detail for a respective value of the measure.
It is important to note that the terms drill down
and drill through are sometimes confused, however,
the main difference between them is that drill down
operates on a predefined hierarchy of data - for
example, course, discipline and number of faults –
and the drill-through goes directly to the lowest level
of detail of the data and retrieves a set of rows from
that data source.
The analysis processes were also carried out in
the occurrences, that is, the students who have or do
not have a pending in their academic career, this
information is important to enable a student to carry
out trips or technical visits. Then, the analysis of the
pending books was done, because the student cannot
receive the diploma or certificate of completion of
course if he has some pending, such as books not
returned to the library. Next, the analysis of the
situation of the course conclusion was made, that is,
if the student is able to receive the diploma or if he
did not do some discipline, internship or final paper.
4 RESULT
According to the dictionary (Houaiss, 2001),
Interface is: user interaction with a program or
operating system that uses graphical features (icons
and windows) in editing documents, using programs,
devices and other elements. As a way of providing
the user with a more interactive way of visualizing
and analysing data, we used dashboards in this work,
since they are one of the most commonly used
interface types in BI systems.
Dashboards are designed to provide information
about some selected variables for each executive.
They use graphs and lists to show the status of
important and necessary parameters to achieve one
or more business goals, consolidated and adjusted on
a single screen. Dashboards also have a drill-down
capability to enable a root-cause analysis of
exceptional situations (Maheshwari, 2015). That is,
they are a set or group of analytical views related to
metrics tables, reports, spreadsheets, graphs and
other components of information analysis.
Pentaho has the Community Dashboard Editor
(CDE) tool, with which it is possible to draw
dashboards in a simple way, with a really
professional end result. The CDE allows the creation
Business Intelligence
533
of advanced panels with Pentaho (Pentaho, 2017). It
is possible to create dashboards for better
visualization of data from data in a Data Warehouse,
Data Mart, or other data source, as long as the tool is
connected to the desired database.
The data was extracted from the OLAP Wizard,
which is the selection panel of the databases that
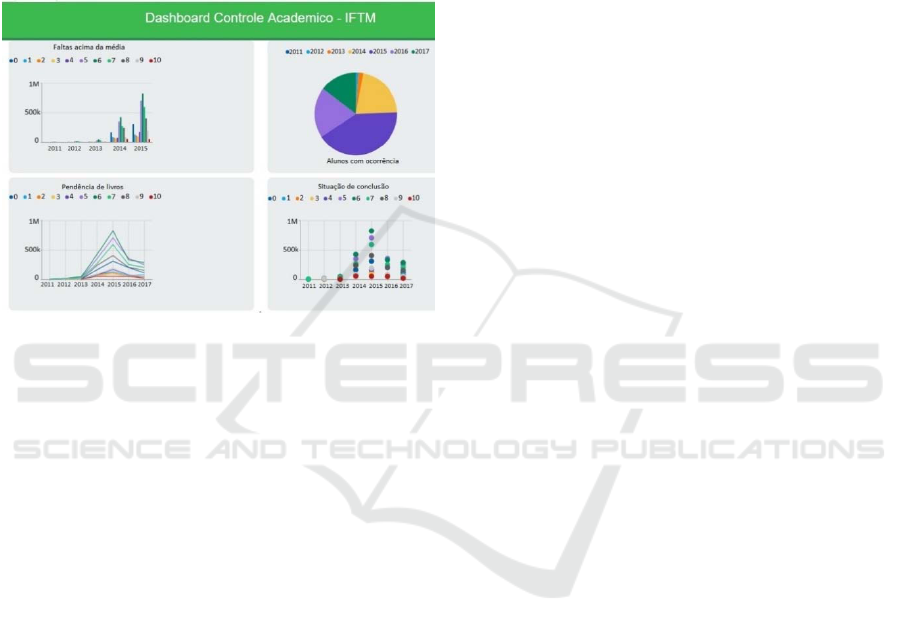
were connected like Pentaho. Figure 9 shows a four-
column dashboard from a layout provided by the
tool.
Figure 9: Dashboard with four columns.
Four different types of graphs were created: bar,
lines, pizza, and dots. The goal is to demonstrate that
the tool offers options for visualizing information
according to the necessity of the user.
5 DISCUSSION
The aim of this paper was to identify the problems in
the system of the institution using the BI tools. Then,
it was necessary to create a Data Mart because it is
faster to solve problems for a specific department.
We realized that, as an integral part of the
organization, the improvement of the processes of
the department occurred in a satisfactory manner,
and we are sure that they will also help in the
improvement of daily routines in other departments,
not yet implemented. The development phases, as
well as their results and analysis, will be presented
below. The first step was to carry out a survey of the
main problems in the various sectors of the IFTM, to
analyse the system and its respective documentation.
The data collection was done with the help of the
coordinators of each sector, and a request of the
system data in the IT department responsible for the
elaboration and maintenance of the system.
Next, an analysis of the system database was
done, using the documentation of entity and
relationship of the tables. A Data Warehouse of fact
tables and their dimensions was created. This phase
was very important because it demanded a greater
dedication and it was possible to acquire more
knowledge.
Soon after, with the use of the Pentaho software,
the process of creating the fact tables and their
respective dimensions through the Extract,
Transform and Load (ETL) process began,
according to the following: the transformation of the
situation of the student was elaborated, that is to say,
if he has already completed his course or if there is
any pending as a traineeship or completion of course
work; then the transformation of the student's
frequency, which shows the number of absences that
the student has in a given period, and finally, the
student's pending transformation, in which it is
possible to identify if the student has any books from
the library that were not returned or if he received
any disciplinary occurrence in his history.
As a result, a small Data Warehouse was
developed that facilitated the manipulation of the
data. This phase is also very important because it is
in the transformation that the data is filtered. That is,
a database in which there are tables with multiple
attributes, only those attributes pertinent to a given
situation are selected.
The next action was the creation of OLAP cubes
from the created schemas of the three situations
mentioned in the first step of creating the Data Mart.
From this implementation it was verified more
agility in the manipulation of the data, with that we
have the reduction of the delays. It is necessary to
mention that, for creating a more complex dashboard
you need to have a good knowledge about graphic
design, but this is not the focus of the work, but
rather create solutions that will give greater
convenience to the execution of daily processes.
Thus, according to the methodology used, the
solutions presented partially fulfil the data
generation requirements through the specific reports
of CRA department. In summary, solutions have
been created that solve the demands requested by the
sector coordinator. It has been shown that Pentaho is
a great tool due to its benefits, such as, improved
consistency in decision making; replaces smaller-
scaled solutions with integrated information,
facilitates access and distributes information more
widely.
We hope that the use of the acquired concepts
can help the implantation of the tools in any other
department that presents problems in future
investigation. Thus, the IFTM system can work to
meet the needs of users who have some demand.
A2E 2018 - Special Session on Analytics in Educational Environments
534

6 CONCLUSION
As we have seen, a research project requires the
researcher to have a very solid theoretical basis for
the project to be executed with excellence. Before
collecting and analysing the data, it is necessary to
acquire prior knowledge to support the work, as
demonstrated with the Business Intelligence.
So the use of BI is a pertinent solution for the
optimization and effectiveness of the system.
Furthermore, a Data Mart was created, based on the
analysis of the IFTM data structure, since the data
for this type of system are fundamental and
indispensable.
Business Intelligence systems present themselves
as facilitators in the decision-making process.
However, its implementation requires some effort,
so it is natural to encounter certain difficulties.
Thus, it is concluded that research responds in a
positive way, since the tools provide the managers
with subsidies for making decisions. This finding is
obtained after demonstrating the BI tools to the
responsible for the CRA sector.
Future Research Directions include analysis on
financial, human resource and pedagogic
departments because they are important in the IFTM
processes.
REFERENCES
Barbieri, C. (2001). BI – Business Intelligence:
modelagem e tecnologia. Rio de Janeiro: Axcel Books.
Barneveld, A. v., Arnold, K. E., and Campbell, J. P.
(2012). Analytics in Higher Education: Establishing a
Common Language. EDUCAUSE, 1 - 11.
Chiavenato, I. (2010). Introdução à tória geral da
administração: uma visão abrangente da moderna
administração das organizações. Rio de Janeiro:
Elsevier.
Deshpandea, N., Ahmeda, S., and Khodea, A. (2016).
Business intelligence through patinformatics: A study
of energy efficient data centres using patent data.
Journal of Intelligence Studies in Business, pp. 13-26.
Houaiss, A. (2001). Dicionário Houaiss da Língua
Portuguesa. Rio de Janeiro, RJ: Objetiva Ltda.
Kimball, R., and Ross, M. (2013). The Data Warehouse
Toolkit: The Definitive Guide to Dimensional
Modeling, Third Edition. Indianapolis, IN: John Wiley
and Sons, Inc.
Laudon, K., and Laudon, J. (2010). Sistemas de
informação gerenciais; tradução Luciana do Amaral
Teixeira ; revisão técnica Belmiro Nascimento João.
São Paulo: Pearson.
Lustig, I., and Brenda Dietrich, C. J. (14 de 10 de 2017).
An IBM view of the structured data analysis
landscape: descriptive, predictive and prescriptive
analytics. Obtido de Analytics: driving better business
decisions: http://analytics-magazine.org/the-analytics-
journey/
Maheshwari, A. K. (2015). Business Intelligence and Data
Mining. New York: Business Expert Press.
Maydon, T. (14 de 10 de 2017). The 4 Types of Data
Analytics. Obtido de kdnuggets:
http://www.kdnuggets.com/2017/07/4-types-data-
analytics.html
Pentaho. (14 de agosto de 2017). Featured Customers.
Obtido de Pentaho: A Hitachi Group Company:
http://www.pentaho.com/customers
Santos, M. Y., and Ramos, I. (2009). Business
Intelligence-Tecnologias da Informação na Gestão de
conhecimento. Lisboa: FCA.
Sharda, R., Asamoah, D. A., and Ponna, N. (2013).
Business Analytics: Research and Teaching
Perspectives. Institute for Research in Information
Systems, 19 - 27.
Stair, R. m., and Reynolds, G. W. (2011). Princípios de
Sistemas de Informação - Tradução da 9ª edição
norte-americana. São Paulo: Cengage Learning.
Stair, R. m., and Reynolds, G. W. (2015). Princípios de
Sistemas de Informação - Tradução da 11ª edição
norte-americana. São Paulo: Cengage Learning.
Turban, at all. (2009). Business Intelligence - Um enfoque
gerencial para a inteligência do negócio. Tradução
Fabiano Bruno Gonçalves. Porto Alegre: Bookman.
Business Intelligence
535
