
Synthetic Optimisation Techniques for Epidemic Disease Prediction
Modelling
Terence Fusco, Yaxin Bi, Haiying Wang and Fiona Browne
Computer Science Research Institute, Ulster University, Shore Road, Newtownabbey, Antrim, Northern Ireland
Keywords:
Optimisation, Over-sampling, Schistosomiasis, Synthetic Instance Generation, SMOTE, SMAC, SIMO.
Abstract:
In this paper, research is presented for improving optimisation performance using sparse training data for
disease vector classification. Optimisation techniques currently available such as Bayesian, Evolutionary and
Global optimisation and are capable of providing highly efficient and accurate results however, performance
potential can often be restricted when dealing with limited training resources. In this study, a novel approach
is proposed to address this issue by introducing Sequential Model-based Algorithm Configuration(SMAC)
optimisation in combination with Synthetic Minority Over-sampling Technique(SMOTE) for optimised syn-
thetic prediction modelling. This approach generates additional synthetic instances from a limited training
sample while concurrently seeking to improve best algorithm performance. As results show, the proposed
Synthetic Instance Model Optimisation (SIMO) technique presents a viable, unified solution for finding opti-
mum classifier performance when faced with sparse training resources. Using the SIMO approach, noticeable
performance accuracy and f-measure improvements were achieved over standalone SMAC optimisation. Many
results showed significant improvement when comparing collective training data with SIMO instance optimi-
sation including individual performance accuracy increases of up to 46% and a mean overall increase for the
entire 240 configurations of 13.96% over standard SMAC optimisation.
1 INTRODUCTION
Optimisation techniques are a sub-domain of machine
learning that aim to discover optimal parameter and
model-based conditions for a given dataset. The bene-
fit of using an optimised approach is that it is possible
to quickly eliminate inefficient and least effective al-
gorithms from experiment conditions meaning more
efficient testing of training data. Optimised solutions
perform most effectively when using larger datasets
due to speed capability for filtering vast amounts of
data. These optimum processes involve using the most
appropriate parameter variables or hyper-parameters
in a training sample that enable the prediction model
to best resolve the issue at hand. Hyper-parameter se-
lection is an important tool in the optimisation process
as it can concurrently target and improve weaknesses
in a supplied data sample (Chan et al., 2013). The
context of proposed optimisation approaches in this
research are related to disease prediction modelling
for future prevention and control purposes. The spe-
cific problem this work is focused on is the epidemic
disease known as schistosomiasis and the host vector
freshwater snail. Schistosomiasis disease is caused by
parasitic worms and infection takes place when fresh-
water that has been contaminated by the snail comes
into contact with humans, crops and cattle resulting in
a detrimental effect on those infected. According to
the World Health Organisation, in 2015 around 218
million people required preventative treatment and
over 65 million people were treated for infection in
the same year (W.H.O., 2016). The number of schis-
tosomiasis infections has increased in recent years in
many parts of Africa and Asia therefore, the need to
provide early warning detection and prediction like-
lihood is imperative as a prevention and control tool.
The aim of this research is to develop viable disease
prediction models suitable for preventative measures
to implemented by relevant health bodies. Once this
information is provided to those communities at risk
of disease outbreak, inhabitants can take known pre-
cautions to evade infection by avoiding unnecessary
exposure to infested water bodies. The outcome of de-
veloping successful schistosomiasis prediction mod-
els for disease control purposes could drastically re-
duce the number of cases of people infected subse-
quently reducing costs associated with treatment and
adverse effects on livestock and crops. The authen-
Fusco, T., Bi, Y., Wang, H. and Browne, F.
Synthetic Optimisation Techniques for Epidemic Disease Prediction Modelling.
DOI: 10.5220/0006823800950106
In Proceedings of the 7th International Conference on Data Science, Technology and Applications (DATA 2018), pages 95-106
ISBN: 978-989-758-318-6
Copyright © 2018 by SCITEPRESS – Science and Technology Publications, Lda. All rights reserved
95

ticity and quantity of training data is of utmost im-
portance when applying classification techniques for
a particular disease research problem. A motivating
factor for the proposed SIMO approach is the limited
training resources available for application of algo-
rithms to construct disease prediction models. A so-
lution is required that modifies the existing training
sample in a way that can improve classification po-
tential without much distortion of the original data
to avoid undermining prediction results. In the cur-
rent state-of-art, automated optimisation techniques
are providing significant performance improvements
over standard applications leading to more technolog-
ically advanced approaches to a variety of research
problems. Active learning approaches are becoming
more prevalent in machine learning studies and are
especially common with image classification research
due to the nature of evolving discovery in that field.
Optimisation links both automation and active learn-
ing methods to find those features and parameters
which perform most favourably for a specific dataset
(Settles, 2012). Successful optimisation application is
often synonymous with larger datasets due to the abil-
ity to process information rapidly. Large reliable data
sources can often be difficult to acquire in the epi-
demic disease exploration field, which has resulted in
various techniques being constructed to amplify the
sparse training data available. Current sampling meth-
ods applied for improving imbalanced training data
address the issue using active learning and ensemble
learning approaches which is an interesting method
that achieved good results building on popular algo-
rithms (Jian et al., 2016).
2 RELATED WORK
Optimisation techniques are becoming more preva-
lent for a variety of machine learning problems. Deep
learning is one of the areas of interest which in-
volves optimisation techniques such as neural net-
work training and optimised machine learning algo-
rithms (Bengio et al., 2015). Improvement of exper-
iment efficiency and performance enhancement are
principle factors in the application of these methods
for use in the context of epidemic disease forecast-
ing. This focus on optimisation research can prove
to be a vital tool for rapid information sharing per-
taining to a variety of disease monitoring studies.
Constraints of this research regarding sparse train-
ing data prompted investigation of sampling methods
that could improve class balance and increase ma-
chine learning potential (L
´
opez et al., 2014). In ad-
dition to epidemiology studies, optimisation and par-
allel algorithm simulations have been previously ap-
plied to physics research with success and in partic-
ular the study of protein behaviours (Trebst et al.,
2006). This schistosomiasis disease prediction re-
search however, is more restrictive in terms of train-
ing data volume. Similar environment-based classifi-
cation problems using sparse sample data can poten-
tially benefit from findings in this work which face
the same optimisation sample limitations. Opposing
over-sampling and under-sampling techniques were
considered and are assessed and expanded upon in
this the following sections. Recent studies have com-
pared real-world data and synthetic repository data
for analysis of optimised active learning approaches
which is a common method for optimised experi-
ments (Krempl et al., 2015). The real-world data used
in this research is used collectively and also as a base
set for synthetic instance generation in order to as-
sess the proposed optimised model in this study. Op-
timisation in many branches of machine learning re-
quires an ever expanding number of training instances
for comprehensive experiment conclusions and when
this is not available Sequential model-based optimi-
sation is an approach which applies algorithms in an
iterative sequential order to achieve optimum learn-
ing conditions (Hutter et al., 2011). Another popular
approach is Bayesian optimisation which employs an
active learning procedure focusing on best performing
algorithms during the optimisation process (Feurer
et al., 2015).
2.1 Data Sampling
Data sampling or re-sampling of skewed data is a
common technique used in machine learning and
specifically when using real-world data. Class imbal-
ance problems can frequently occur when using au-
thentic environment data samples due to variations
and density levels of spatial attributes. Over-sampling
is a machine learning approach which uses additional
sampling of instances in a supplied training set to in-
crease the set size while balancing the data with in-
creased minority classes. Under-sampling techniques
are similar to over-sampling in that both methods
share common aims but address the issue from differ-
ent perspectives. Under-sampling is a contrapositive
of over-sampling in that it reduces the size of a data
sample by focusing on reduction of the majority class.
A re-sampling approach was applied with this initial
research to discover performance implications when
using a limited training set. Similar conditions were
applied to corresponding over-sampling experiments
with the set used being the collective sample contain-
ing 223 instances and 8 attributes in total. The re-
DATA 2018 - 7th International Conference on Data Science, Technology and Applications
96

sampling method used provided a random sub-sample
of the collective set using a bias to compensate for the
minority class distribution. This was applied in frac-
tions of the overall set for comparison purposes with
under-samples of 100%, 80%, 60%, 40%, 20% and
results recorded for analysis.
2.2 Synthetic Minority Over-sampling
Technique
Synthetic Minority Over-sampling Technique
(SMOTE) is a popular approach applied when using
imbalanced sample data partly due to suitability for
consecutive classification potential (Chawla et al.,
2002). Increased training pools can provide improved
classification potential therefore, over-sampling
techniques were deemed to be the most appropri-
ate sampling choice for this sparse data problem.
SMOTE is a sampling approach aimed at increasing
a dataset size with the purpose of improving minority
class balance (S
´
aez et al., 2015). Synthetic instances
are generated with minority bias as an alternative to
over-sampling with replacement while also reducing
the majority class hence increasing algorithm sensi-
tivity to classifier assignment. For each instance x
i
in the minority class, SMOTE searches the minority
for the k nearest neighbours of x
i
. One of these
neighbours is selected as a seed sample ˆx. A random
number between 0 and 1 denoted δ is chosen. The
synthetic instance x
new
is then created as shown in
Equation 1.
x
new
= x
i
+ ( ˆx − x
i
) × δ (1)
2.3 Sequential Model-Based Algorithm
Configuration
Sequential Model-Based Algorithm Configuration
(SMAC) optimisation is a method that seeks to op-
timise model parameters to the ideal setting before
classifier application. SMAC optimisation is similar
in many ways to Bayesian optimisation in that it
also uses a sequential approach with active learning
for providing optimised algorithm conditions (Snoek
et al., 2012). It aims to find the best performing model
and parameter settings for a particular dataset in order
to improve learning conditions for algorithms (Thorn-
ton et al., 2013). This is achieved using exploration of
algorithm hyper-parameter space and includes exam-
ining new algorithms for performance analysis.
2.4 Research Issues
An issue that often arises when using automated op-
timisation processes concerns performance potential
when using a sparse dataset for learning. Limited
training resources can reduce effectiveness of opti-
misation capability and restrict potential for some
automated techniques to be considered. The pro-
posed model in this paper focuses on development
of environment-based prediction models and issues
surrounding the perceived lack of real-world data for
modelling of vector-borne disease risk. In the data
samples used in this work, there is evidence of class
imbalance, which can be detrimental to the classifica-
tion and prediction process (He et al., 2008). Real-
world data composition in general terms tends to
contain unequally represented class categories. Train-
ing samples used encompass a six-year period from
2003-2009 around the Dongting Lake area in Hu-
nan Province, China. From initial analysis and pre-
experiment study phases, vector classes were identi-
fied that were unequally represented. This imbalance
can be due to a number of environment variables at
the time of collection and is common issue with many
real-world environment samples. Over-fitting can oc-
cur when classifying imbalanced data due to a pre-
dominant class in the set rendering classifier tendency
to assign that class label to new instances. A simple
solution for addressing class imbalance is to acquire
additional data, which would increase the training
pool and vary the class distribution. This is the most
apparent approach when using a sparse data sample
although difficulty lies in acquiring field survey in-
formation with corresponding freshwater snails. Lack
of data and difficulty in accessing new samples is a
significant component of the research problem being
addressed with this work.
Development of viable disease prediction models
can be restricted by a lack of field-survey data sam-
ples particularly in the case of vector-borne disease.
Substantial collections of earth observation data have
become more accessible in recent times however, cor-
responding vector distribution data has proven chal-
lenging to collect on a large scale therefore, optimi-
sation approaches were investigated to maximise po-
tential of classifier performance using limited data re-
sources (Corne and Reynolds, 2010). Motivation for
this work focuses on providing early warning infor-
mation to at-risk communities that can help with pre-
vention and control of schistosomiasis outbreak and
the destructive effects of transmission in local com-
munities. Successful results and improved optimisa-
tion performance of proposed SIMO method will in-
form future research on optimal synthetic instance
Synthetic Optimisation Techniques for Epidemic Disease Prediction Modelling
97

Table 1: Raw Data Snapshot.
AREA SD TCB TCG TCW MNDWI NDMI NDVI NDWI
N49 0.03 0.26 0.13 -0.10 -0.58 0.03 0.60 -0.61
N60 0.02 0.29 0.10 -0.09 -0.45 -0.01 0.43 -0.45
N74 0.10 0.52 0.08 -0.07 -0.24 0.00 0.18 -0.24
N75 2.26 0.21 0.07 -0.03 -0.27 0.11 0.32 -0.37
N76 0.37 0.41 0.11 -0.15 -0.47 -0.09 0.32 -0.40
N77 0.08 0.21 0.13 -0.01 -0.30 0.29 0.56 -0.54
dimensions and model parameters for classifica-
tion and prediction modelling. This can contribute to
the advancement in optimisation and over-sampling
approaches in any further experiment capacity in this
epidemiology domain.
Modified forms of SMOTE over-sampling and
SMAC optimisation currently exist and are useful
tools for many research problems however, the pro-
posed SIMO method provides a unified approach
combining the two techniques in order to find opti-
mum classifier performance which includes the opti-
mum performing synthetic sample increase quantity.
The research presented does not provide incontro-
vertible evidence of impending disease outbreak but
rather the most informed advice for monitoring and
control to present to health agencies dealing with pub-
lic health risks.
3 EXPERIMENT MATERIALS
Experiment data used in this paper is supplied by re-
search partners at the European Space Agency (ESA)
in conjunction with the Academy of Opto-electronics
in Beijing, China. ESA partners provided satellite
images over requested spatio-temporal parameters
which was then used for environment feature extrac-
tion by research partners at the Chinese Academy of
Sciences(CAS). Feature extraction was conducted us-
ing spectral and spatial software for high resolution
image processing which provided raw labelled envi-
ronment values. This data was then presented and pro-
cessed before being deemed experiment ready. The
study area on which all experiments are based is the
Dongting Lake area of Hunan Province, China as
shown in Figure 1.
3.1 Training Data
Training data was provided using a combination of
satellite information and environment feature extrac-
tion techniques which was then presented in a raw
data format before preprocessing for experiment pur-
poses. A snapshot of the training sample is provided
in Table 1. Training data used in these experiments is
a collective sample ranging from 2003-2009 contain-
ing 223 instances with eight attributes. The environ-
ment attributes used in all experiments are as follows:
• TCB - Tasselled Cap Brightness (soil)
• TCG - Tasselled Cap Greenness (vegetation)
• TCW - Tasselled Cap Wetness (soil and moisture)
• MNDWI - Modified Normalised Difference Wa-
ter Index (Water Index)
• NDMI - Normalised Difference Moisture Index
(soil moisture)
• NDVI - Normalised Difference Vegetation Index
(green vegetation)
• NDWI - Normalised Difference Water Index (wa-
ter index)
The theory and rationale reinforcing proposed pre-
diction models is that using satellite data and corre-
sponding field-survey samples can help with making
informed prediction models for application with fu-
ture satellite extracted environment information used
for training successful prediction models. The pro-
posed synthetic optimsation method in this paper can
assist in this research aim by assessing optimal clas-
sification parameters while evaluating synthetic in-
stance generation viability on a sparse sample. The
triumvirate of experts involved in this three-pronged
research project are briefly described in Figure 2.
Figure 1: Study Area Map.
DATA 2018 - 7th International Conference on Data Science, Technology and Applications
98

Figure 2: Research Partnership Components.
4 METHODOLOGY
To evaluate under-sampling of the sparse training set,
a selection of established algorithms were applied
having performed well in many fields of epidemic
disease detection research to date (Lin et al., 2011).
These included Naive Bayes, J48, SVM and MLP and
results are assessed using classification accuracy with
corresponding sample size as presented in Figure 4.
Initial optimisation experiments were conducted on
the collective training data to give the greatest data
pool from the sparse samples for optimisation to take
place. SMAC optimisation was applied with the top
ten performing configurations being displayed for use
in the next stage of testing (Kotthoff et al., 2016).
Table 2 shows experiment duration results ranging
from 1-24 hours of SMAC optimisation application
with the collective training pool of 223 instances over
a number of years from the Dongting Lake area of
Hunan Province, China. At the end of each selected
time period, the optimum performance algorithm to-
gether with weighted f-measure and classification ac-
curacy findings were recorded. Each duration interval
provided best performing algorithm results in terms
of weighted f-measure and classification accuracy to
provide a comprehensive algorithm analysis rather
than classification accuracy metrics alone.
4.1 Synthetic Instance Model
Optimisation
The proposed approach of this research is to im-
plement Sequential Model-based Algorithm Config-
uration(SMAC) while simultaneously introducing an
amplified number of synthetic instances using Syn-
thetic Minority Over-Sampling Technique(SMOTE)
to improve training potential with optimisation per-
formance. In implementing this proposed Synthetic
Instance Model Optimisation(SIMO), the aim is to in-
crease performance of the optimised algorithm used
to achieve greatest results. The success of this pro-
posed method could alleviate the need to conduct
Figure 3: SIMO Process Diagram.
much of the expensive and time-intensive field sur-
vey research that is required in order to make confi-
dent classification and prediction of the disease vec-
tor density and distribution. Results of this research
will enable discovery of those classifiers which per-
form better with larger training sets of data and iden-
tify those poorly performing classifiers whose perfor-
mance diminishes when increased synthetic instances
are added. This information can be utilised for apply-
ing optimisation methods with future predictions.
Parallel algorithm configuration processing is a
concept associated with optimisation and has been ap-
plied with success in the bioinformatics domain (Hut-
ter et al., 2012). It is the assertion of this study that
using optimised model processes in parallel with con-
tributory sample balance improvement methods can
significantly improve optimum performance poten-
tial of a sparse sample. The proposed SIMO model
was constructed using a combined process involv-
ing SMOTE over-sampling and SMAC optimisation
approaches. Combining approaches when optimising
provides scope for improvement and can utilise the
positive aspects of each respective technique. This
SIMO approach is in essence an active learning ap-
proach which implements optimisation operations to
both simulated instance sampling volume and model
configuration selection.
The following stages describe the Synthetic In-
stance Model Optimisation (SIMO) process that are
followed:
• SMAC optimisation is tested manually with the
collective real-world training sample with dura-
tion intervals ranging from 1-24 hours.
• SMAC optimisation is then applied in conjunction
with generated SMOTE synthetic data simulation.
• The top ten best performing algorithms from each
duration interval are then applied sequentially
with synthetically generated instances for perfor-
mance analysis.
Synthetic Optimisation Techniques for Epidemic Disease Prediction Modelling
99

Table 2: Benchmark Optimisation Results.
NumHrs Algorithm WeightedF Acc%
1 RandomTree 0.982 98.2
2 J48 0.663 69.1
3 Logistic 0.583 66.4
4 OneR 0.746 77.6
5 RandomTree 0.982 98.2
6 RandomTree 0.982 98.2
7 OneR 0.991 99.1
8 Logistic 0.991 99.1
9 Bagging 0.622 68.2
10 Adaboost 0.605 59.2
11 Vote 0.609 65.5
12 RandomTree 0.559 67.7
13 Logistic 0.59 66.8
14 OneR 0.62 69.1
15 Bagging 0.722 74.4
16 Logistic 0.66 71.3
17 RandomSubSpace 0.622 62.8
18 RandomSubSpace 0.599 62.8
19 RandomSubSpace 0.599 60.1
20 LWL 0.702 73.1
21 LWL 0.721 74.9
22 OneR 0.684 71.7
23 LMT 0.555 67.7
24 OneR 0.684 71.7
• Both approaches are then unified into a single op-
timisation process with the objective of providing
optimised synthetic instance generation models.
A model diagram of proposed SIMO approach is
shown in Figure 3 and shows the concurrent process
with training data being introduced to both SMOTE
and SMAC techniques before beginning the unified
SIMO approach. The experiment process involves
running SMAC optimisation for every hour ranging
from 1-24 hours to assess performance of optimised
techniques when applied with authentic sample data.
Results of these initial tests were recorded and anal-
ysed for research purposes. Subsequently the SIMO
unified approach was applied with synthetically gen-
erated data based on the original sample ranging from
1000, 5000 and 10,000 instance gamut. For each of
these synthetic sets, the first ten recorded optimised
results were extracted and contrasted with the perfor-
mance from the original data classification to assess
effectiveness. During each of the experiment phases,
a SMOTE Equilibrium approach was applied with in-
creasing sample magnitude to appropriately assess the
effects of the proposed synthetic data simulation ap-
proach.
5 RESULTS
From initial results applied with an under-sampling
technique in Figure 4, a gradual decline in perfor-
mance accuracy it is noticeable with increases from
20% to 100% of the full sample size when under-
sampling bias is implemented. This was expected
from under-sampling of an already limited data pool
but nonetheless contributed information of interest
for assessing classifier behaviour with each batch in-
crease. The performance of J48 decision tree de-
creased most significantly in terms of accuracy while
MLP provided a performance gain between 20% and
100% sample size which can be factored into any fu-
ture experiment thought process.
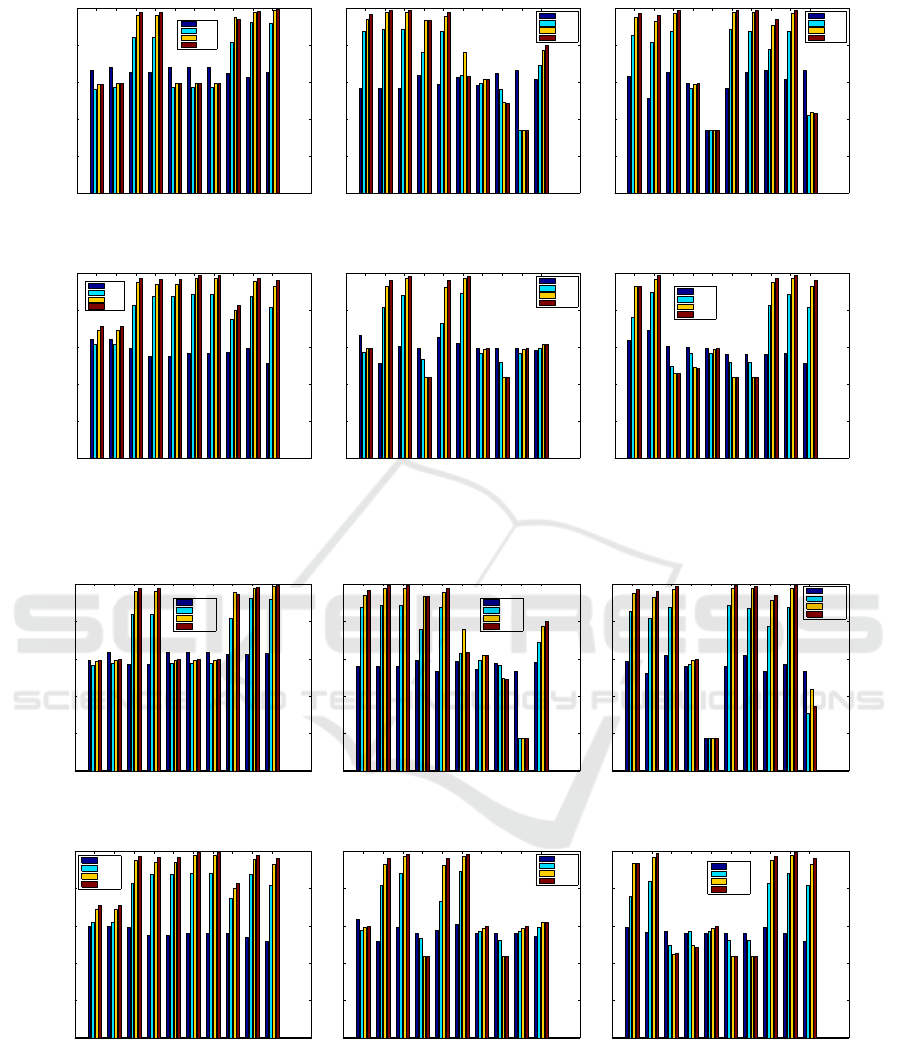
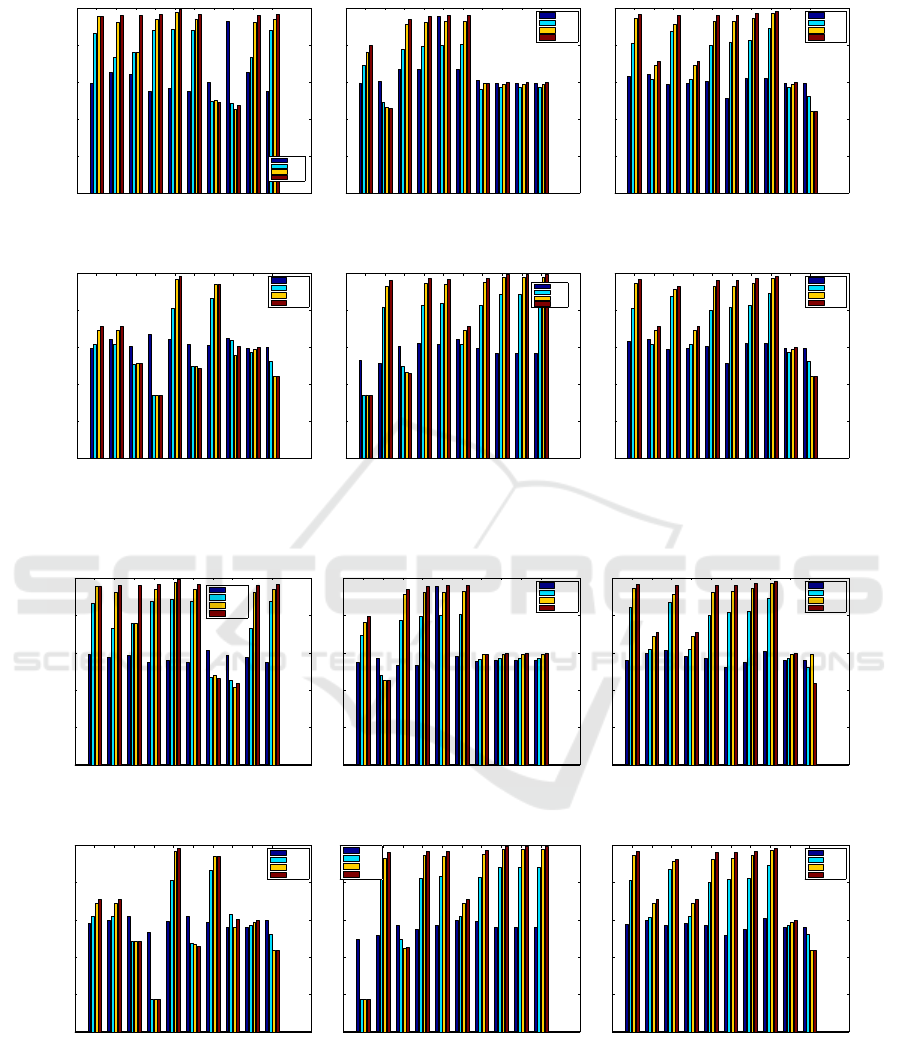
In relation to graphical representations in Figure
5, a selection of results are presented to show opti-
misation performance from novel SIMO method in
comparison with collective training optimisation con-
figurations. In each of the hourly configuration ac-
curacy results, the original collective data sample is
denoted using C with synthetic instance volume rep-
resented by S followed by instance number in 1000,
5000 and 10,000 gamuts. Figure 5 shows classifica-
tion accuracy improvements in the majority of cases
with increased synthetic instance simulation signify-
ing optimisation performance improvements which
shows scalability potential of the sparse training set.
Similarly in Figures 6, significant f-measure perfor-
mance improvements are noticeable when increasing
synthetic instances to the optimisation process across
the vast majority of models. These results using clas-
sification accuracy and f-measure metrics over a num-
ber of optimisation time intervals, help to reinforce
the necessity of proposed SIMO model as an effective
tool for improving epidemic risk prediction modelling
when using sparse sample data.
20 40 60 80 100
0
10
20
30
40
50
60
70
80
90
Sample Size (%)
Accuracy
NB
SVM
MLP
J48
Figure 4: Under-sampling Results.
DATA 2018 - 7th International Conference on Data Science, Technology and Applications
100
1 2 3 4 5 6 7 8 9 10
0
20
40
60
80
100
Configuration
Accuracy
C
S1000
S5000
S10000
(a) 1 Hour
1 2 3 4 5 6 7 8 9 10
0
20
40
60
80
100
Configuration
Accuracy
C
S1000
S5000
S10000
(b) 2 Hour Acc
1 2 3 4 5 6 7 8 9 10
0
20
40
60
80
100
Configuration
Accuracy
C
S1000
S5000
S10000
(c) 3 Hours
1 2 3 4 5 6 7 8 9 10
0
20
40
60
80
100
Configuration
Accuracy
C
S1000
S5000
S10000
(d) 4 Hours
1 2 3 4 5 6 7 8 9 10
0
20
40
60
80
100
Configuration
Accuracy
C
S1000
S5000
S10000
(e) 5 Hours
1 2 3 4 5 6 7 8 9 10
0
20
40
60
80
100
Configuration
Accuracy
C
S1000
S5000
S10000
(f) 6 Hours
Figure 5: SIMO Accuracy 1-6.
1 2 3 4 5 6 7 8 9 10
0
0.2
0.4
0.6
0.8
1
Configuration
F−measure
C
S1000
S5000
S10000
(a) 1 Hour
1 2 3 4 5 6 7 8 9 10
0
0.2
0.4
0.6
0.8
1
Configuration
F−measure
C
S1000
S5000
S10000
(b) 2 Hours
1 2 3 4 5 6 7 8 9 10
0
0.2
0.4
0.6
0.8
1
Configuration
F−measure
C
S1000
S5000
S10000
(c) 3 Hours
1 2 3 4 5 6 7 8 9 10
0
0.2
0.4
0.6
0.8
1
Configuration
F−measure
C
S1000
S5000
S10000
(d) 4 Hours
1 2 3 4 5 6 7 8 9 10
0
0.2
0.4
0.6
0.8
1
Configuration
F−measure
C
S1000
S5000
S10000
(e) 5 Hours
1 2 3 4 5 6 7 8 9 10
0
0.2
0.4
0.6
0.8
1
Configuration
F−measure
C
S1000
S5000
S10000
(f) 6 Hours
Figure 6: SIMO FMeasure Results 1-6.
5.1 Discussion
The method proposed in this paper is constructed us-
ing optimisation techniques in tandem with synthetic
instance generation methods. The aim of this work is
to find optimal conditions both in terms of parame-
ter settings and instance simulation volume for mak-
ing accurate classification of SD as well as discovery
of environment attribute influence on SD levels. The
predicted hypotheses of this work was that using the
Synthetic Optimisation Techniques for Epidemic Disease Prediction Modelling
101

proposed SIMO method could improve accuracy and
f-measure performance with synthetic instance opti-
misation over standalone SMAC optimisation during
empirical experiments ranging in a 24-hour tempo-
ral parameter setting. The expectation from results
using proposed SIMO approach is that performance
improvement should be evident with each synthetic
instance increment in comparison with optimised col-
lective sample performance. This should be replicated
with both accuracy and f-measure metrics in the main
with some potential individual exceptions that will be
identified for further analysis as is the case in Ta-
ble 2 for hour 3. In Figures 5 and 6, some of these
results are presented affirming the initial prediction
both in terms of accuracy and f-measure metrics. This
validation has rendered the SIMO model an effec-
tive performance enhancing model suitable for use
when applying optimisation approaches to a sparse
training sample. There are however some anomalous
results with a number of poor optimisation perfor-
mances observed when applied over a longer period
of time compared with shorter experiment durations.
These results require further investigation as to why
performance was so poor with certain parameter set-
tings and what the optimum classifiers from the poor-
est performing years were for future considerations.
6 CONCLUSIONS
In this study a novel SIMO method was presented us-
ing a hybrid approach incorporating SMAC optimsa-
tion and SMOTE instance generation with the aim of
evaluating and assessing optimal instance generation
volume and parameter settings for optimised classi-
fication. In summary, current findings have identified
optimal parameter settings and classifiers for a range
of duration intervals providing a knowledge base for
future optimisation experiments in this field. Individ-
ual classifier performance can now be correctly dis-
tinguished as that which performs best with reduced
or increased optimisation time periods. This informa-
tion is indicative of each algorithm’s potential for suit-
ability with more machine intensive problems such
as deep structured learning studies and can eliminate
certain algorithms from future SIMO prediction train-
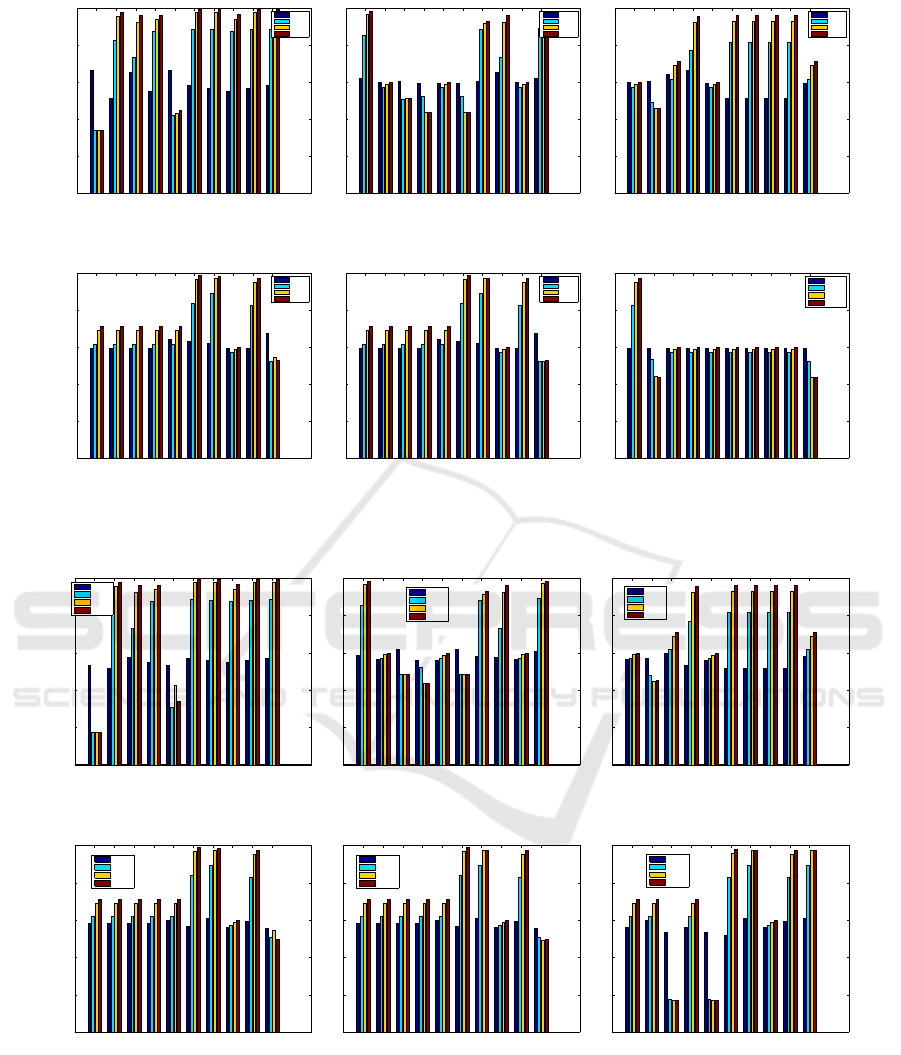
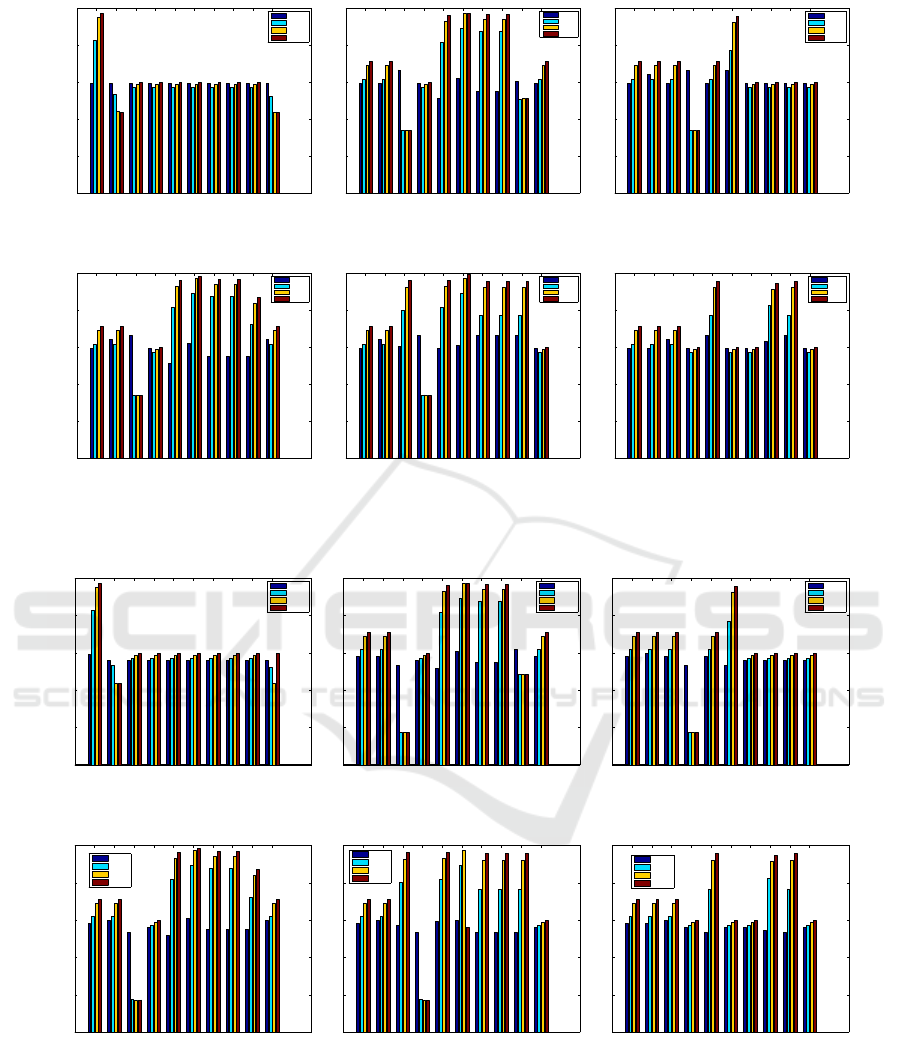
ing. In each of the examples in Figure 5 and 6, there
is evidence of increasing accuracy and f-measure per-
formance in the majority of cases which is positive
for insight when building future predictive models.
Another example is shown in Figure 10(a) with 13
hours of optimisation providing an average increase
of 27.2% on standard SMAC implementation with 9
out of 24 configurations having more than 15% av-
erage accuracy increase. In terms of f-measure, 25%
of average configuration increases resulted in more
than 2.5 f-measure improvement with total average
increase across all results of 0.18 and a high aver-
age increase of 3.4 when optimising for 4 hours with
0.43 increases in some cases. In Table 2, results show
high frequency of certain algorithms such as OneR
providing optimum performance in 5 of the 24-hour
intervals with other similar regularity from Random
Tree and Logistic Regression providing most accurate
performance levels with accuracy in the high 90%
range. These classifiers indicate optimal suitability for
use with this research problem and provide a basis
for future baseline experiments with the novel SIMO
model. The analysis factors that require further as-
sessment based on all results will contrast the ex-
ploration and exploitation benefits that is, determin-
ing which performance level provides the greatest im-
provement while remaining efficient and maintaining
data authenticity. The next phase of validating this
method will involve empirical evaluation of alterna-
tive sampling methods and representative datasets for
comparative performance analysis.
ACKNOWLEDGEMENTS
Training data is supplied by research partners at The
European Space Agency in conjunction with The
Academy of Opto-electronics, CAS, China.
REFERENCES
Bengio, Y., Goodfellow, I. J., and Courville, A. (2015). Op-
timization for training deep models. Deep Learning,
pages 238–290.
Chan, S., Treleaven, P., and Capra, L. (2013). Continu-
ous hyperparameter optimization for large-scale rec-
ommender systems. In Proceedings - 2013 IEEE In-
ternational Conference on Big Data, Big Data 2013,
pages 350–358.
Chawla, N. V., Bowyer, K. W., Hall, L. O., and Kegelmeyer,
W. P. (2002). SMOTE: synthetic minority over-
sampling technique. Journal of Artificial Intelligence
Research, pages 321–357.
Corne, D. W. and Reynolds, A. P. (2010). Optimisation and
generalisation: Footprints in instance space. In Lec-
ture Notes in Computer Science, volume 6238 LNCS,
pages 22–31.
Feurer, M., Springenberg, J. T., and Hutter, F. (2015). Ini-
tializing Bayesian Hyperparameter Optimization via
Meta-Learning. Proceedings of the 29th Conference
on Artificial Intelligence (AAAI 2015), pages 1128–
1135.
DATA 2018 - 7th International Conference on Data Science, Technology and Applications
102

He, H., Bai, Y., Garcia, E. A., and Li, S. (2008). ADASYN:
Adaptive synthetic sampling approach for imbalanced
learning. Proceedings of the International Joint Con-
ference on Neural Networks, pages 1322–1328.
Hutter, F., Hoos, H. H., and Leyton-Brown, K. (2011). Se-
quential model-based optimization for general algo-
rithm configuration. In Lecture Notes in Computer
Science, volume 6683 LNCS, pages 507–523.
Hutter, F., Hoos, H. H., and Leyton-Brown, K. (2012). Par-
allel algorithm configuration. In Lecture Notes in
Computer Science (including subseries Lecture Notes
in Artificial Intelligence and Lecture Notes in Bioin-
formatics), volume 7219 LNCS, pages 55–70.
Jian, C., Gao, J., and Ao, Y. (2016). A new sampling method
for classifying imbalanced data based on support vec-
tor machine ensemble. Neurocomputing, 193:115–
122.
Kotthoff, L., Thornton, C., Hoos, H. H., Hutter, F., and
Leyton-Brown, K. (2016). Auto-WEKA 2.0: Auto-
matic model selection and hyperparameter optimiza-
tion in WEKA. Journal of Machine Learning Re-
search, 17:1–5.
Krempl, G., Kottke, D., and Lemaire, V. (2015). Optimised
probabilistic active learning (OPAL): For fast, non-
myopic, cost-sensitive active classification. Machine
Learning, 100(2-3):449–476.
Lin, Y. L., Hsieh, J. G., Wu, H. K., and Jeng, J. H.
(2011). Three-parameter sequential minimal opti-
mization for support vector machines. Neurocomput-
ing, 74(17):3467–3475.
L
´
opez, V., Triguero, I., Carmona, C. J., Garc
´
ıa, S., and Her-
rera, F. (2014). Addressing imbalanced classification
with instance generation techniques: IPADE-ID. Neu-
rocomputing, 126:15–28.
S
´
aez, J. A., Luengo, J., Stefanowski, J., and Herrera, F.
(2015). SMOTE-IPF: Addressing the noisy and bor-
derline examples problem in imbalanced classification
by a re-sampling method with filtering. Information
Sciences, 291(C):184–203.
Settles, B. (2012). Active Learning. Synthesis Lectures on
Artificial Intelligence and Machine Learning, 6(1):1–
114.
Snoek, J., Larochelle, H., and Adams, R. P. (2012). Prac-
tical Bayesian Optimization of Machine Learning Al-
gorithms. Adv. Neural Inf. Process. Syst. 25, pages
1–9.
Thornton, C., Hutter, F., Hoos, H. H., Leyton-Brown, K.,
and Chris Thornton, Frank Hutter, Holger H. Hoos, K.
L.-B. (2013). Auto-WEKA: Combined Selection and
Hyperparameter Optimization of Classification Algo-
rithms. Proceedings of the 19th ACM SIGKDD In-
ternational Conference on Knowledge Discovery and
Data Mining, pages 847–855.
Trebst, S., Troyer, M., and Hansmann, U. H. E. (2006).
Optimized parallel tempering simulations of proteins.
Journal of Chemical Physics, 124(17).
W.H.O. (2016). Schistosomiasis. Website. last checked:
21.04.2018.
Synthetic Optimisation Techniques for Epidemic Disease Prediction Modelling
103
APPENDIX
1 2 3 4 5 6 7 8 9 10
0
20
40
60
80
100
Configuration
Accuracy
C
S1000
S5000
S10000
(a) 7 Hours
1 2 3 4 5 6 7 8 9 10
0
20
40
60
80
100
Configuration
Accuracy
C
S1000
S5000
S10000
(b) 8 Hours
1 2 3 4 5 6 7 8 9 10
0
20
40
60
80
100
Configuration
Accuracy
C
S1000
S5000
S10000
(c) 9 Hours
1 2 3 4 5 6 7 8 9 10
0
20
40
60
80
100
Configuration
Accuracy
C
S1000
S5000
S10000
(d) 10 Hours
1 2 3 4 5 6 7 8 9 10
0
20
40
60
80
100
Configuration
Accuracy
C
S1000
S5000
S10000
(e) 11 Hours
1 2 3 4 5 6 7 8 9 10
0
20
40
60
80
100
Configuration
Accuracy
C
S1000
S5000
S10000
(f) 12 Hours
Figure 7: SIMO Accuracy Results 7-12.
1 2 3 4 5 6 7 8 9 10
0
0.2
0.4
0.6
0.8
1
Configuration
F−measure
C
S1000
S5000
S10000
(a) 7 Hours
1 2 3 4 5 6 7 8 9 10
0
0.2
0.4
0.6
0.8
1
Configuration
F−measure
C
S1000
S5000
S10000
(b) 8 Hours
1 2 3 4 5 6 7 8 9 10
0
0.2
0.4
0.6
0.8
1
Configuration
F−measure
C
S1000
S5000
S10000
(c) 9 Hours
1 2 3 4 5 6 7 8 9 10
0
0.2
0.4
0.6
0.8
1
Configuration
F−measure
C
S1000
S5000
S10000
(d) 10 Hours
1 2 3 4 5 6 7 8 9 10
0
0.2
0.4
0.6
0.8
1
Configuration
F−measure
C
S1000
S5000
S10000
(e) 11 Hours
1 2 3 4 5 6 7 8 9 10
0
0.2
0.4
0.6
0.8
1
Configuration
F−measure
C
S1000
S5000
S10000
(f) 12 Hours
Figure 8: SIMO FMeasure Results 7-12.
DATA 2018 - 7th International Conference on Data Science, Technology and Applications
104
1 2 3 4 5 6 7 8 9 10
0
20
40
60
80
100
Configuration
Accuracy
C
S1000
S5000
S10000
(a) 13 Hours
1 2 3 4 5 6 7 8 9 10
0
20
40
60
80
100
Configuration
Accuracy
C
S1000
S5000
S10000
(b) 14 Hours
1 2 3 4 5 6 7 8 9 10
0
20
40
60
80
100
Configuration
Accuracy
C
S1000
S5000
S10000
(c) 15 Hours
1 2 3 4 5 6 7 8 9 10
0
20
40
60
80
100
Configuration
Accuracy
C
S1000
S5000
S10000
(d) 16 Hours
1 2 3 4 5 6 7 8 9 10
0
20
40
60
80
100
Configuration
Accuracy
C
S1000
S5000
S10000
(e) 17 Hours
1 2 3 4 5 6 7 8 9 10
0
20
40
60
80
100
Configuration
Accuracy
C
S1000
S5000
S10000
(f) 18 Hours
Figure 9: SIMO Accuracy Results 13-18.
1 2 3 4 5 6 7 8 9 10
0
0.2
0.4
0.6
0.8
1
Configuration
F−measure
C
S1000
S5000
S10000
(a) 13 Hours
1 2 3 4 5 6 7 8 9 10
0
0.2
0.4
0.6
0.8
1
Configuration
F−measure
C
S1000
S5000
S10000
(b) 14 Hours
1 2 3 4 5 6 7 8 9 10
0
0.2
0.4
0.6
0.8
1
Configuration
F−measure
C
S1000
S5000
S10000
(c) 15 Hours
1 2 3 4 5 6 7 8 9 10
0
0.2
0.4
0.6
0.8
1
Configuration
F−measure
C
S1000
S5000
S10000
(d) 16 Hours
1 2 3 4 5 6 7 8 9 10
0
0.2
0.4
0.6
0.8
1
Configuration
F−measure
C
S1000
S5000
S10000
(e) 17 Hours
1 2 3 4 5 6 7 8 9 10
0
0.2
0.4
0.6
0.8
1
Configuration
F−measure
C
S1000
S5000
S10000
(f) 18 Hours
Figure 10: SIMO FMeasure Results 13-18.
Synthetic Optimisation Techniques for Epidemic Disease Prediction Modelling
105
1 2 3 4 5 6 7 8 9 10
0
20
40
60
80
100
Configuration
Accuracy
C
S1000
S5000
S10000
(a) 19 Hours
1 2 3 4 5 6 7 8 9 10
0
20
40
60
80
100
Configuration
Accuracy
C
S1000
S5000
S10000
(b) 20 Hours
1 2 3 4 5 6 7 8 9 10
0
20
40
60
80
100
Configuration
Accuracy
C
S1000
S5000
S10000
(c) 21 Hours
1 2 3 4 5 6 7 8 9 10
0
20
40
60
80
100
Configuration
Accuracy
C
S1000
S5000
S10000
(d) 22 Hours
1 2 3 4 5 6 7 8 9 10
0
20
40
60
80
100
Configuration
Accuracy
C
S1000
S5000
S10000
(e) 23 Hours
1 2 3 4 5 6 7 8 9 10
0
20
40
60
80
100
Configuration
Accuracy
C
S1000
S5000
S10000
(f) 24 Hours
Figure 11: SIMO Accuracy Results 19-24.
1 2 3 4 5 6 7 8 9 10
0
0.2
0.4
0.6
0.8
1
Configuration
F−measure
C
S1000
S5000
S10000
(a) 19 Hours
1 2 3 4 5 6 7 8 9 10
0
0.2
0.4
0.6
0.8
1
Configuration
F−measure
C
S1000
S5000
S10000
(b) 20 Hours
1 2 3 4 5 6 7 8 9 10
0
0.2
0.4
0.6
0.8
1
Configuration
F−measure
C
S1000
S5000
S10000
(c) 21 Hours
1 2 3 4 5 6 7 8 9 10
0
0.2
0.4
0.6
0.8
1
Configuration
F−measure
C
S1000
S5000
S10000
(d) 22 Hours
1 2 3 4 5 6 7 8 9 10
0
0.2
0.4
0.6
0.8
1
Configuration
F−measure
C
S1000
S5000
S10000
(e) 23 Hours
1 2 3 4 5 6 7 8 9 10
0
0.2
0.4
0.6
0.8
1
Configuration
F−measure
C
S1000
S5000
S10000
(f) 24 Hours
Figure 12: SIMO FMeasure Results 19-24.
DATA 2018 - 7th International Conference on Data Science, Technology and Applications
106
