
A Commit Change-based Weighted Complex Network Approach to
Identify Potential Fault Prone Classes
Chun Yong Chong
1
and Sai Peck Lee
2
1
School of Information Technology, Monash University Malaysia, Jalan Lagoon Selatan,
47500 Bandar Sunway, Selangor, Malaysia
2
Department of Software Engineering, Faculty of Computer Science and Information Technology,
University of Malaya, Kuala Lumpur 50603, Malaysia
Keywords: Software Fault Identification, Software Change Coupling, Commit Change Data, Mining Software
Repositories, Complex Network.
Abstract: Over the past few years, attention has been focused on utilizing complex network analysis to gain a high-
level abstraction view of software systems. While many studies have been proposed to use interactions
between software components at the variable, method, class, package, or combination of multiple levels,
limited studies investigated how software change history and evolution pattern can be used as a basis to
model software-based weighted complex network. This paper attempts to fill in the gap by proposing an
approach to model a commit change-based weighted complex network based on historical software change
and evolution data captured from GitHub repositories with the aim to identify potential fault prone classes.
Experiments were carried out using three open-source software to validate the proposed approach. Using the
well-known change burst metric as a benchmark, the proposed method achieved average precision of 0.77
and recall of 0.8 on all the three test subjects.
1 INTRODUCTION
In recent years, research in software engineering in
the aspect of representing software systems using
complex networks has started to emerge with the
aim to gain a high-level abstraction view of the
analysed software systems (Ma et al. 2010, Concas
et al., 2011). Representing software systems using
complex networks allows software maintainers to
gain more insights on the studied software by
discovering unique or recurring structural patterns,
detecting abnormalities and outliers, or even
predicting future evolution trends (Turnu et al.,
2013). For instance, the work by Zimmermann and
Nagappan (Zimmermann and Nagappan, 2008) has
shown that it is possible to predict software defects
using graph theory metrics to reveal some extra-
deterministic information of the software that are
otherwise hidden from software maintainers, such as
fault prone software components.
However, the ways to represent software-based
complex networks are generally not standardized
across multiple studies due to the fact that different
studies might be addressing some specific issues at
different levels of granularity, i.e. package level
(Hyland-Wood et al., 2006), class level (Chong and
Lee 2015, Chong and Lee, 2017), or code level
(Myers, 2003). While most of the existing studies
focus on utilizing source code as the main source of
information to form a software-based complex
network, there is a lack of studies that attempt to
harness the data and metadata that are available on
source code management systems (SCMS).
Software engineering and big data researchers
have been drawn into using SCMS such as GitHub
due to its integrated social features and the metadata
that can be accessed through its API (Kalliamvakou
et al., 2015). Much research including qualitative
and quantitative studies have been conducted on
GitHub. In qualitative studies, the research focus on
analyzing software developers’ behavior, in an
attempt to identify the traits and characteristics of
software developers in successful software
development (Begel et al., 2013). On the other hand,
quantitative studies focus on using commit change
data to understand the evolution of a software, and
to construct software bug predictors to facilitate its
maintenance in the GitHub environment (Gousios et
Chong, C. and Lee, S.
A Commit Change-based Weighted Complex Network Approach to Identify Potential Fault Prone Classes.
DOI: 10.5220/0006828104370448
In Proceedings of the 13th International Conference on Software Technologies (ICSOFT 2018), pages 437-448
ISBN: 978-989-758-320-9
Copyright © 2018 by SCITEPRESS – Science and Technology Publications, Lda. All rights reserved
437

al., 2014). Due to the vast amount of data available
for projects hosted on GitHub, it is easy to retrieve
commit change related information of a particular
software. Various studies have found the frequency
of software change, especially pre or post-release, is
positively correlated to its fault proneness
(Nagappan et al., 2010). Hence, by studying the
commit change requests in GitHub, researchers are
able to discover and study recurring patterns of fault
prone software components.
However, based on our knowledge through
literature review, there is no study that attempts to
fully exploit the commit change data mined from
SCMS by creating a commit change-based complex
network to reveal the co-change behavior of
software components from a graph theory point-of-
view. We argue that a complex network modelled
based on the commit change data of software
systems can aid in the identification of bug prone
components by applying relevant graph theory
metrics. Graph theory metrics such as degree
centrality, closeness centrality, and clustering
coefficient had been proven to be correlated to the
quality of software systems (Chong and Lee, 2015).
Hence, applying this set of well-established graph
theory metrics on the proposed commit change-
based complex network can reveal bug or fault
prone classes and other interdependent classes that
are strongly related to the faulty class, i.e. when
ClassA is changed, there is a high probability that
ClassB will need to be changed as well.
This research proposes a way to utilize historical
software change and evolution data as an input to
model a commit change-based weighted complex
network. Through the application of well-
established graph theory metrics, potential fault
prone classes are identified. We use the well-known
change burst metrics proposed by (Nagappan et al.,
2010) as a benchmark to evaluate the accuracy of
our proposed approach on three open source projects
hosted on GitHub, namely fastjson, bitcoinj, and
kairosdb. Experiments show that the proposed
approach managed to achieve an average precision
of 0.77 and a recall of 0.8 when using change burst
metric as a benchmark. This paper is organized as
follows: Section 2 discusses the background and
related works in utilizing complex network analysis
to study the structure of software, as well as works
on change coupling metrics to identify potential
fault prone software components. Section 3 presents
the proposed approach to model a commit change-
based weighted complex network. Section 4 presents
the experimental design, along with the execution of
the experiment. Section 5 gives an overall
discussion based on the results obtained in the
previous section, followed by concluding remarks
and potential future work.
2 RELATED WORKS
There are several features in graph theory that can
be used to analyze the structure and behavior of
software systems. Recent studies of representing
objected-oriented software systems as complex
networks revealed that many of them share some
global and fundamental topological properties such
as scale free and small world (Potanin et al. 2005;
Concas et al., 2007; Louridas et al., 2008; Pang and
Maslov, 2013; Baxter et al., 2006). The scale free
characteristic in software systems can be interpreted
as the level of reuse of important classes, or the
number of dependencies between classes, while
software-based networks that exhibit small world
property signify that the cohesion strength among
software components are strong from a graph
theory’s point of view. Thus, complex networks and
graph theory analysis are excellent in evaluating the
impact of a particular class with respect to the whole
system.
Before applying graph theory metrics onto a
software system to be analyzed, one must construct
its complex network in advance. An object-oriented
software is typically composed of multiple classes.
At the source code level, classes in object-oriented
software may contain data structures, objects,
methods, and variables. Two classes can be
considered related if there are actions such as
passing of messages. Due to multiple ways of
representing nodes and edges, there is a need to
perform an in-depth review on existing works that
model software systems using complex networks.
2.1 Modelling Software-based Complex
Network
The work by Myers (Myers, 2003) proposed a
method to model software systems using complex
network by analyzing the interdependencies of
source code. A software collaboration graph based
on the calling of methods by one another is used to
analyze the structure and complexity of software
systems. The work by Myers is later extended in the
work by LaBelle et al. (LaBelle and Wallingford,
2004) and Hyland et al. (Hyland-Wood et al., 2006)
to include the usage of classes and packages.
On the other hand, the work by Oyetoyan et al.
(Oyetoyan et al., 2015) proposed an approach to
ICSOFT 2018 - 13th International Conference on Software Technologies
438

investigate the relationship between cyclic
dependencies and software maintainability. Cyclic
dependency graphs are used in this work, where
classes are represented as nodes and relationships
between classes are represented as edges. The
authors examined the change frequency of software
components in multiple releases, and identified if
the classes involved in circular dependencies are
more prone to changes. Based on their finding, the
authors discovered that circular dependencies are
positively correlated to change frequency, and it will
adversely affect the maintainability of software
systems.
The work by Valverde and Solé (Valverde and
Solé, 2003) discussed the usage of two graphs,
namely Class Graph and Class-Method Graph, to
analyze the global structure of software systems.
Class Graph is derived based on UML class
diagrams, where classes are represented as nodes,
while relationships among classes, such as
dependency and association, are depicted as edges
between nodes. Class-Method Graph is modeled
based on source code using the similar concept. For
both types of graphs, the complexity of nodes and
edges is ignored mainly because the authors
assumed that internal complexities do not change the
global structure of a software.
Based on the these studies, it is obvious that
there are various ways to represent software-based
complex network mainly because different studies
are addressing different issues at varying levels of
granularity. Since the focus of this paper is to
identify bug or fault prone software components,
information related to the evolution of software
components such as change history can be useful to
model a software-based complex network. It is
widely acknowledged that software components
constantly undergoing changes are more likely to be
fault prone due to their unstable structure. Hence, by
studying the commit change in SCMSs such as
GitHub, one can attempt to discover and learn
recurring patterns of bug or fault prone software
components.
2.2 Change Metric to Identify Bug or
Fault Prone Software Components
Studies have found that apart from using popular
source code metrics in software bug prediction,
change metrics are equally good, if not better, in
identifying bug or fault prone software components
when compared to code metrics (Muthukumaran et
al. 2015, Nagappan et al. 2010, Hassan 2009).
Change coupling, which is one of the most widely
used change metrics, was defined in (Wiese et al.,
2015) as the situation associated with recurrent co-
changes of software components found in the
software evolution or change history. In other
words, change coupling between any two classes is
measured by observing their co-change or co-evolve
patterns over a period of development history
(Ambros et al., 2009; Ajienka and Capiluppi).
According to the work by Zimmermann., et al
(Zimmermann et al., 2004), the authors treat change
coupling as association rules. The association rule
defines that if given a situation where when class A
is changed, class B is also changed in response to
that action, that will result in the association rule of
⟹ .
Various research studies were conducted to
analyze the relationships between all the software
components, evolution patterns, and relevant
information mined from SCMSs such as GitHub and
Subversion (Kagdi et al. 2013, Yang et al. 2017) in
order to capture the co-changing behavior.
Experimental results had shown that by studying co-
change patterns among software components,
developers can actually identify hidden
dependencies that are not revealed by traditional
static code metrics and it can be used to form the
basis of bug prediction model (Zimmermann et al.
2004, Xia et al. 2016, Huang et al. 2017).
Meanwhile, Nagappan et al (Nagappan et al.,
2010) proposed a new code change metric, called
the change burst metric, which is capable of
accurately predicting fault prone software
components in software projects with high
frequency of changes. The authors define change
burst as a sequence of consecutive changes in a
fixed interval of time, i.e. pre-release or post-release
of a major software version. If the amount of change
burst is relatively high on a piece of code, it could
indicate that the code is not tested or designed
properly, causing developers to issue emergency
post-release patch to fix the issue. With precision
and recall exceeding 90% when tested on Windows
Vista, the authors have shown that code change
metrics can outperform conventional source code
metrics for predicting defects in large-scale
commercial software.
Based on the these studies, it is clear that
utilizing data mined from software repositories can
be a promising way to study the inherent complexity
and co-change behavior of software systems. In this
paper, an approach to model a commit change-based
weighted complex network is proposed. The
proposed commit change-based network is capable
of revealing extra-deterministic information about
A Commit Change-based Weighted Complex Network Approach to Identify Potential Fault Prone Classes
439

the fault proneness of software components with the
aid of graph theory metrics such as degree centrality
and betweeness centrality. After applying relevant
graph metrics, one can identify the important nodes
in the network, or in this context, classes that change
frequently (due to the fact that the network is
modelled based on commit change data of software
components) throughout a fixed period of software
development lifecycle. The information derived
from graph theory analysis can be used to
supplement the raw commit change data mined from
SCMS to aid in identifying bug-prone software
components. The contribution of this paper can be
summarized as follows:
1. A novel way to model a commit change-
based weighted complex network
2. A way to identify classes that change
frequently (direct and indirect neighbouring
classes included) in order to reveal potential
bug prone classes, based on the modelled
commit change-based weighted complex
network.
3. Evaluation of the proposed approach using
three open-source projects archived in
GitHub repositories.
3 PROPOSED APPROACH
A complex network, , , is made up of a set
of nodes V, and a set of edges ⊆ that
connect pairs of nodes. In general, a complex
network can either directed or undirected. In both
directed and undirected networks, edges may be
associated with weights to denote the similarity of a
pair of nodes connected by an edge or the cost of
traveling through that particular edge. In a directed
network ,, , ∈ signifies that there is
an edge in that is linking node to node where
is the origin and is the terminus. On the other hand,
in an undirected network
,, if , ∈ ,
then edge , ∈ as well because the origin and
terminus are not specified in an undirected network.
Both directed and undirected networks can be
represented by their own adjacency matrix A. The
matrix A is a
|
|
|
|
matrix where the rows and
columns represent the nodes of the network. In an
undirected network, the entry
1, if, ∈
;∀, ∈ 1, ⋯ ,
|
|
. Value 0 indicates that there is
no relationship in between nodes and . Meanwhile
for a directed network, the value
represents the
weight associated with edge, . The value of
adjacency matrix A is symmetric for an undirected
network such that
. In a directed network,
however, the relation
is asymmetrical.
In OO software systems, objects and classes are
normally related through different kinds of binary
relationships, such as inheritance, composition and
dependency. Thus, the notion of associating graph
theory to represent large OO software systems and
to analyze their properties, be it structural
complexity or maintainability, is feasible.
In this paper, an approach to model a commit
change-based weighted complex network is
proposed. Table 1 illustrates an example where there
exist four commit changes over a period of time. For
each commit, all the affected classes (including add
a new line of codes, modify existing code, or
removal of code) are listed in the table. For example,
in Commit #1120, three classes, namely A.java,
B.java, and G.java were affected. Based on the
information provided in Table 1, a way to model the
associated weighted complex network is proposed.
Figure 1 illustrates an example of the proposed
approach to create a commit change-based weighted
complex network.
Table 1: Example of four commit changes and classes
affected by each commit change.
Commit
#1120
Commit
#1121
Commit
#1122
Commit
#1123
Affected
Classes
A.java
B.java
G.java
A.java
G.java
F.java
A.java
F.java
H.java
C.java
F.java
Figure 1: Example of commit change-based weighted
complex network.
The proposed approach takes into consideration
any kind of changes, including adding one or many
lines of code, modifying one or many lines of code,
and removing one or many lines of code. Based on
the commit change information shown in Table 1, a
weighted complex network that resembles the
interaction of commit changes among all classes is
created. Classes that are affected by the same
commit change are linked together with edges, while
the frequency of co-changes is used as a basis to
ICSOFT 2018 - 13th International Conference on Software Technologies
440
calculate the weights of edges. For example,
Commit #1120 affects three classes, namely A.java,
B.java, and G.java. Hence, edges are created to
connect all these three classes affected by the same
commit change #1120. As for the frequency of co-
changes, Class A.java and G.java were both affected
in Commit #1120 and Commit #1121. Hence, a
value of 2 is assigned to the edge connecting node A
and G.
Once the target software is modelled into its
respective weighted complex network, we can then
analyze it using graph theory metrics that are
correlated to fault proneness of software systems.
Before choosing the appropriate metrics, we need to
define the characteristics of complex network that
are capable of revealing fault proneness of software
components.
3.1 Community Structure of Commit
Change-based Network
The work by Malliaros and Vazirgiannis (2013)
discussed that real-world networks (networks not
modelled from random data) have special structural
patterns and properties that distinguish themselves
from random networks. One of the most distinctive
features in a real-world network is the community
structure, such that the topology of the network is
organized in several modular groups, commonly
known as communities or clusters. However, in
large-scale real-world networks (such as social
network, power grid network, and World Wide
Web), the community structure is usually hidden
from users, largely due to their inherit complexity.
Thus, discovering the underlying community
structure of a real-world network, or commonly
referred as community detection, is crucial toward
the understanding of the analyzed network.
In this paper, community structure of commit
change-based network can be used to represent and
identify classes that tend to co-change together from
a graph theory point-of-view. As mentioned earlier,
the work by Ambros, et.al., (Ambros et al. 2009)
found that change coupling for a collection of
classes, or in other words, the tendency for those
classes to co-change together, is positively
correlated to fault proneness. In this paper, several
community detection techniques that are commonly
used in the field of brain network research will be
adopted to discover the community structure of
commit change-based weighted complex network.
The findings will be used to identify classes that
exhibit high change coupling behavior.
3.1.1 Identifying Network Hubs
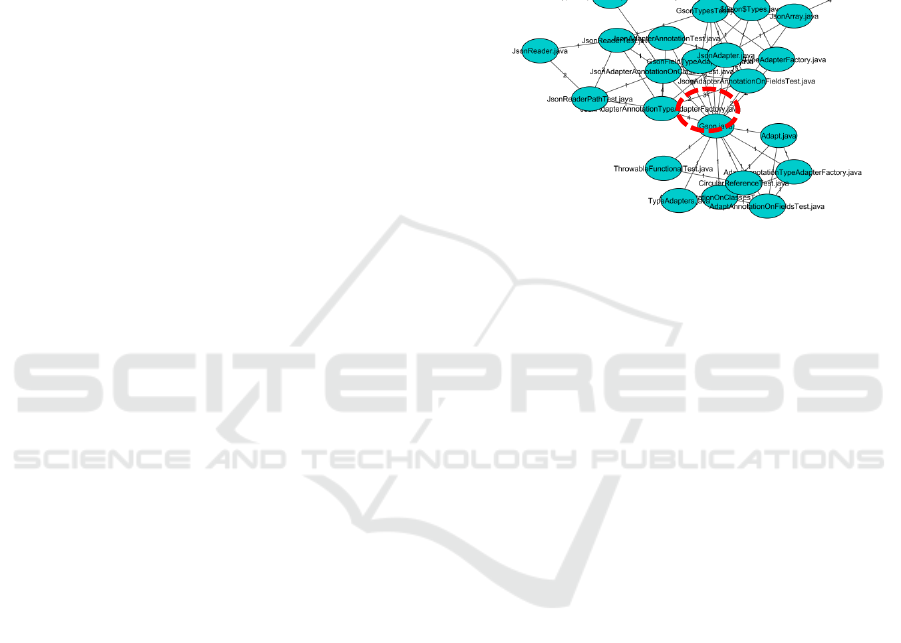
Figure 2 shows a snippet of commit change-based
weighted complex network constructed using the
proposed method on an open-source software
written in Java, called the Gson. The commit change
data were extracted from 1
st
January 2014 until 1
st
January 2015. The complex network is modelled
using an open-source network visualization tool,
called Cytoscape.
Figure 2: Snippet of Gson project represented in weighted
complex network using the proposed method.
Gson is a relatively small project and there were
only 109 commit changes during the examined one-
year period. Therefore, we can easily identify the
community structure of the network through visual
inspection. For example, the node marked with the
dotted circle possesses high degree centrality
(Gson.java) because a lot of other nodes are
converging toward this particular node. In the field
of graph theory, the presence of node with high
degree centrality is usually referred as a hub. The
work by Ravasz and Barabasi (2003) showed that a
hub plays a very important role in complex network
because it is responsible for bridging multiple small
groups of clusters into a single, unified network.
From the software change and evolution point-
of-view, hubs with high degree centrality are classes
that often co-change with other classes. This
behavior can be caused by the hub class providing
methods to be used by other classes, or in scenarios
where the hub classes are passing parameters to be
used by other classes. Hence, making changes to the
hub class will have cascading effect on other related
classes as well. The work by Turnu et al. (2012) also
demonstrated that there is a very high correlation
between the degree distribution of software-based
complex network and the system’s bug proneness.
Hence, we argue that identifying community
structure, or in other words, formation of hubs, is
important to reveal bug or fault prone software
components of the analyzed software. However,
since the complex network modelled in this paper is
A Commit Change-based Weighted Complex Network Approach to Identify Potential Fault Prone Classes
441

based on commit change data, identifying hub
classes alone will not be sufficient enough to
analyze the co-change pattern of all the classes exist
in a software.
3.1.2 Identifying Classes That Form Clique
with Hubs
Clustering coefficient of a node is the average
tendency of pairs of neighbors of a node that are
also neighbors of each other. If all the inspected
nodes are adjacent to each other, where there exists
an edge that connects each pair of the neighbors, it is
considered a complete clique (Watts and Strogatz
1998). Nodes inside a complete clique are
considered to be tightly coupled to each other, and
in the context of this paper, high change coupling.
Therefore, by combining the concept of hubs
and clustering coefficient, one can identify the
neighboring classes that are closely related to the
hubs. Neighboring classes that form a complete
clique with a hub can be interpreted as classes that
frequently co-change together with the hub classes
(Malliaros and Vazirgiannis 2013).
One way to identify hubs is by observing the
nodes which possess high degree at the tail of the
degree distribution in log-log scale (Ravasz and
Barabasi 2003). Figure 3 shows an example of the in-
degree distribution of a project in log-log scale. Based
on the figure, most of the nodes possess in-degree of
1, and the extreme values are roughly 60 times higher
than the average in-degree. The tail of the degree
distribution, as depicted by the red circle in Figure 3,
shows that there are several nodes with exceptionally
high in-degree. These nodes are usually considered as
the hubs, as discussed by Ravasz et al.
Figure 3: Identify hubs by observing the degree
distribution of in-degree.
However, it is possible that the identified nodes
(classes) with high in-degree might actually be god
classes or utility classes. Therefore, it is important
to differentiate between hubs and god classes.
Several studies have discovered that nodes that
behave like god classes share several characteristics,
especially when observed from the graph theory’s
point of view (Turnu et al. 2013, Turnu et al. 2012,
Concas et al. 2007). For instance, according to
Turnu et al. (2013), god classes tend to possess high
in-degree and out-degree. Therefore, in this study,
when a node is found to possess exceptionally high
in-degree and out-degree when compared to other
classes, it is flagged as god classes instead of hubs.
However, do note that the proposed approach to
model nodes and edges is based on the classes that
are affected by one or many commit changes. If
there are 5 classes affected in a commit change,
edges will be established between all 5 nodes that
correspond to the associated classes (i.e. every node
is connected to all the other nodes). In that case, for
every commit change that involved more than 2
nodes, a clique will be created.
In order to prevent false positive results when
identifying classes that form clique with hub classes,
the following technique is adopted. Given a
collection of classes
,
,…
, if these classes
only co-change together once (or very rarely), then
we can assume that the co-change behavior is only a
one-off operation in a certain period of software
development lifecycle. Hence, using the proposed
approach to model the commit change-based
weighted complex network, the weight of the edges
,
,…
that connect between all the
associated classes (nodes)
,
,…
representing
these classes will be very low to reflect this sporadic
behavior. Therefore, in this paper, we only take into
consideration classes that co-change together more
than 3 times in order to capture significant co-
change behavior. As a result, the modelled commit
change-based weighted complex network will only
consist of edges with weightage value of 3 or above.
There is a strong reason why a value of 3 is chosen.
As mentioned earlier, using a value of 1
(consider classes that co-change for a minimum one
time) will end up with creating a network with
complete clique, i.e. all classes (nodes) are linked to
each other. Figure 4a shows an example of network
formed when the value is set at 1 using kairosdb, an
open-source project available on GitHub. The
constructed network in Figure 4a is too densely
connected where almost all classes formed complete
clique with each other because the threshold for
minimum co-change was set at 1.
Using a value of 2, on the other hand, still do not
eliminate false positive results by a huge margin
(Figure 4b). In our preliminary experiment, plenty of
complete clique among all classes still exist with a
value of 2 (consider classes that co-change for a
minimum 2 times). It is only when the value is
change is 3 (consider classes that co-change for a
ICSOFT 2018 - 13th International Conference on Software Technologies
442
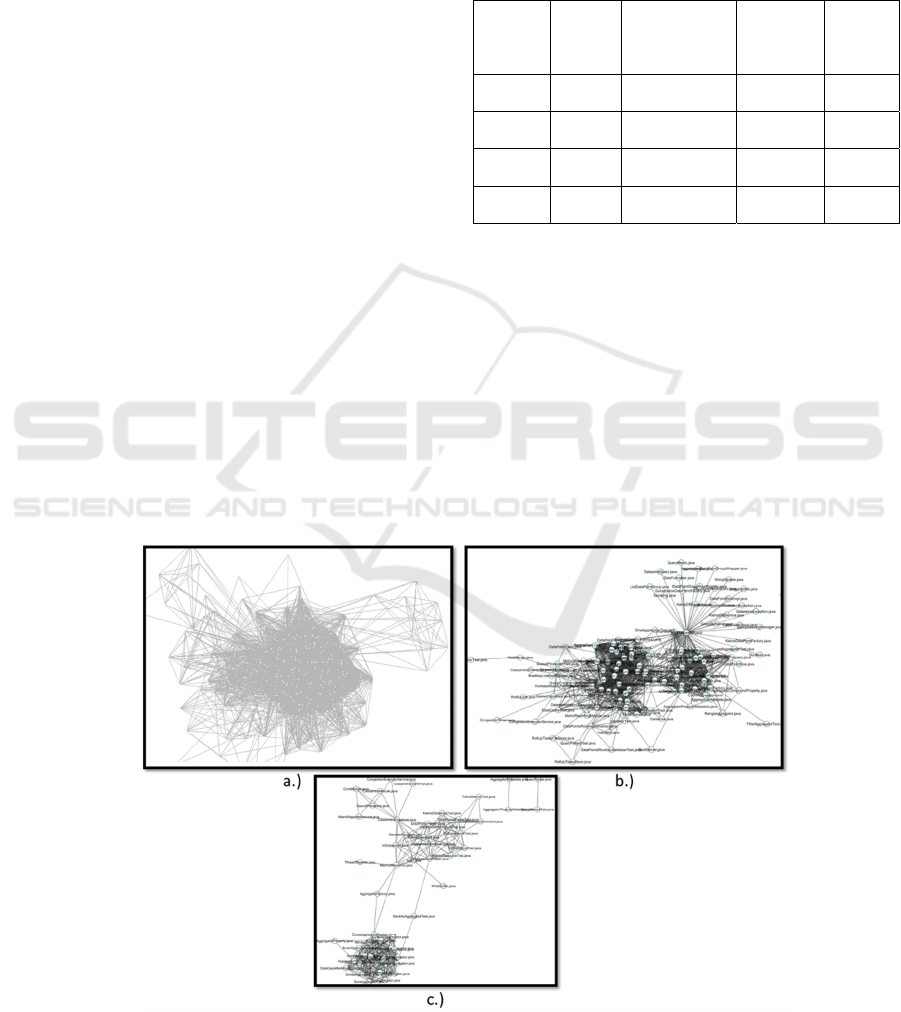
minimum 3 times), a lot of false positive results are
eliminated.
Any value larger than 3 is not suitable because
there is only a handful of classes that co-change
more than 3 times.
Besides that, we are using graph theory metrics
that consider weights of edges to help mitigate the
issue. For instance, maximum weighted clique is
used to identify classes that form a clique with hub
classes with the largest weight. This will ensure that
only significant co-change patterns are captured and
analyzed.
4 EXPERIMENT SETUP
In order to facilitate reproducibility and follow up
research, the tool that we used to extract relevant
commit change information from GitHub repository
is made available to the public (Chong 2017). The
shell script provides users a way to extract co-
change behaviour from any GitHub repository and
return the query in a csv format which contains three
columns, which are “weight”, “source”, and “target”
respectively. Users can specify the target repository
by changing the "repository name" variable. The
code also provides a way to specify the range of
dates for inspection by modifying the "SINCE" and
"UNTIL" variable. The output can be easily
exported to Cytoscape for further analysis.
Four open-source software systems written in
Java are chosen in this study. The sizes of the
software systems vary from 394 to 2422 classes to
reflect some representative distribution on the
population of open-source OO software systems.
Table 2 shows additional information about the
chosen projects.
Table 2: Summary of chosen projects.
Name
#
classes
Inspection
Period
Number
of
Commit
Changes
Nodes/
Edges
fastjson 2422
1
s
t
Jan 2016 –
1
st
Jan 2017
1510 129/488
dubbo 1212
1
s
t
Jan 2013 –
1
st
Jan 2016
50 0/0
bitcoinj 415
1
s
t
Jan 2016 –
1
st
Jan 2017
269 94/568
kairosdb 394
1
s
t
Jan 2016 –
1
st
Jan 2017
181 52/279
The inspection period in the third column refers to
the duration where we captured the commit change
data from the selected project. For fastjson, bitcoinj,
and kairosdb, the inspection period was set to be 1
year, from 1
st
January 2016 to 1
st
January 2017. A
total of 1510, 269, and 181 commit changes were
identified during the 1-year period for fastjson,
bitcoinj, and kairosdb respectively. On the other hand,
due to the fact that the dubbo is a relatively stable
project with less active developers, the inspection
period was stretched to 3 years instead, from 1
st
January 2013 to 1
st
January 2016. For the said 3-year
period, a total of 50 commits were identified.
Figure 4: Formation of network by varying the minimum co-change threshold on kairosdb project. a) 1 time, b) 2 times, c) 3
times.
A Commit Change-based Weighted Complex Network Approach to Identify Potential Fault Prone Classes
443

The last column refers to the total number of
nodes and edges formed in the commit change-based
weighted complex network using the proposed
approach. It was observed that for the dubbo project,
all the 50-commit changes (under inspection) were
unique, i.e. there were no classes that co-change
together more than once. There was however one
exception, where classes JavaBeanSerializeUtilTest.
java and JavaBeanSerializeUtil.java did co-change
twice during the 3-year inspection period.
Based on the dubbo project release notes, it was
further revealed that the project did not release any
major updated version from 2013 to 2016. There
were only small incremental updates to fix minor
compatibility issues. As a result, the commit change-
based weighted complex network to represent the
dubbo project only contains edges with weighted
value of 1, which is similar to an unweighted
network. Ultimately, it prevents us from identifying
significant community structure through analyzing
the weighted degree centrality of each node in the
network. Hence, we decided to discard the dubbo
project from the experiment. This unexpected
behavior had eventually revealed one of the
limitations of the proposed approach, such that it is
less suitable to be applied on structural stable
software, or software that undergoes a small amount
of changes or updates over a period of development
history.
4.1 Identification of Faulty Prone
Software Components
Next, based on the commit change-based weighted
complex network, graph theory metrics discussed in
Section 3.1.1 and 3.1.2 were applied to analyze the
chosen software, using several Cytoscape plugins
including Nemo (Orrú et al., 2015) (calculate
clustering coefficient and identify formation of
hubs), CytoNCA (Tang et al., 2015) (calculate
weighted degree centrality), and MClique (calculate
maximum weighted clique). Tables 3 shows the list
of hubs identified using CytoNCA plugin.
The second column of Table 3 records the
weighted degree centrality values of all the
identified hubs. It can be observed that although
fastjson is relatively larger (from the perspective of
number of classes) when compared to bitcoinj, the
weighted degree centrality values of the identified
hubs are almost comparable. Further investigation
revealed that 24 new releases were published for
fastjson during the 1-year inspection period, while
only 6 new releases were published for bitcoinj. This
observation is mainly attributed by the fact that on
Table 3: Summary of identified hubs.
Identified Hubs
Weighted Degree
Centrality
fastjson
ASMSerializerFactory.java 219
JavaBeanSerializer.java 191
JavaBeanDeserializer.java 185
ParserConfig.java 168
JSONSerializer.java 153
FieldSerializer.java 147
ASMDeserializerFactory.java 145
bitcoinj
WalletTest.java 191
TransactionBroadcastTest.java 133
PaymentChannelClientState.java 122
WalletProtobufSerializerTest.java 114
BitcoinUIModel.java 114
Wallet.java 110
PeerGroup.java 108
kairosdb
CassandraDatastore.java 49
AggregatorName.java 49
CassandraDatastoreTest.java 49
DatastoreTestHelper.java 43
average, more classes were affected by each commit
change request in the bitcoinj project. 23 out of the
24 identified releases published by fastjson during
the inspection period were either bug fixes,
compatibility updates, or optimization updates. Only
one of the releases introduced new functionalities.
On the other hand, the bitcoinj project is still on
its beta version. Hence, each commit change in the
bitcoinj project affected a relatively larger number of
classes because new functionalities are introduced to
the system in an incremental manner.
Next, we use the MClique plugin to identify the
maximum weighted clique in all the three studied
networks. Table 4 shows the results of the analysis.
Based on Table 4, it can be observed that some of
the hubs identified in Table 3 are also part of the
largest weighted clique. For instance, in fastjson
project, classes FieldDeserializer.java, ASMSeriali
ICSOFT 2018 - 13th International Conference on Software Technologies
444

zerFactory.java, ParserConfig.java, and JavaBean
Deserializer.java which were identified as hubs, also
formed clique among themselves. There are two
factors that contributed toward this observation.
Firstly, the studies discussed in Section 2 had
established a positive correlation between the
frequency of change and fault proneness of software
components. Due to that fact the proposed commit
change-based weighted complex network is
modelled based on commit change frequency,
classes (nodes) that possess high degree centrality
are deemed to be classes that change frequently
throughout a certain period of software development
cycle. Hence, it is likely that these identified hubs
are potentially poorly designed such that developers
are forced to perform periodical software patches to
fix the issues. Evidently, as pointed out earlier, 23
out of 24 releases of the fastjson project during the
inspection period were related to bug fixes.
Secondly, the reason why the identified hubs
also formed cliques among themselves is due to the
co-change tendency of highly coupled classes, which
in return also points toward poorly designed or low-
quality classes. The work by Chatzigeorgiou and
Melas (Chatzigeorgiou and Melas 2012) discovered
that in general, software components follows a
‘preferential attachment’ where some classes tend to
interact with the classes that belong to a similar
community or functional groups.
The authors claimed that important nodes (high
weighted degree centrality) in a software-based
complex network tend to act as attractors for new
members that join an existing network. Evidently,
this is shown in the bitcoinj project where the classes
involved in forming the largest clique were all
responsible for the payment functionality. Hence,
this behavior had caused the identified hub classes to
form clique among themselves.
4.2 Experiment Results
In order to evaluate the proposed approach, we
decided to utilize the change burst metric proposed
by (Nagappan et al. 2010) as a benchmark to
compare against our findings.
In (Nagappan et al. 2010), the authors defined
the change burst metric as a “sequence of
consecutive changes” to a file. They argued that if a
file gets changed frequently over a short period of
time, the probability of that file being faulty is
extremely high. The change burst metric contains
two parameters, namely gap size and burst size. Gap
size is used to determine the minimum time gap
between two changes (commits) to a file. If the time
interval or gap between the change commits is lesser
than the gap size, they belong to the same “change
burst” sequence. Burst size on the other hand,
determines the minimum number of changes
(commits) in a change burst. If the number of
commits in a change burst is less than the burst size,
the change burst will not be considered. Nagappan et
al. evaluated their proposed approach on Windows
Vista where they fixed the gap size and burst size to
the value of 3. Experiments showed that change
burst metric is an effective way to aid in identifying
fault prone software components. Hence, we decided
to use the change burst metric as the benchmark and
oracle to crosscheck our experiment findings using
the following steps.
1. Identify the list of hub classes that form cliques
among themselves by referring to Table 3 and
Table 4.
2. Run change burst metric to identify a list of
classes that undergoes frequent change burst.
The list of classes with high change burst value
are treated as the oracle in our experiment.
3. Crosscheck the list of identified classes in Step
1 and Step 2 and calculate the precision and
recall of the proposed method.
We have prepared another shell script to
automate the process of extracting change burst
behavior from GitHub repository, which is also
publicly available (Chong 2017). The underlying
working principle of the script is based on the work
by Nagappan et.al.
Table 4: Summary of identified cliques.
fastjson bitcoinj kairosdb
FieldDeserializer.java WalletTest.java CassandraDatastore.java
ASMSerializerFactory.java BitcoinUIModel.java DatastoreTestHelper.java
ParserConfig.java TransactionBroadcastTest.java KairosDatastore.java
JavaBeanDeserializer.java PaymentChannelClientState.java DataPointsParser.java
ASMDeserializerFactory.java PeerGroup.java H2Datastore.java
TypeUtils.java CoreModule.java
DataPointsParserTest.java
A Commit Change-based Weighted Complex Network Approach to Identify Potential Fault Prone Classes
445

Users can specify the target repository and the
range of inspection date by changing the provided
variables. Users can also specify the gap size and
burst size of the inspected project accordingly. The
output of this script returns a csv file which lists
down the maximum burst size and number of change
bursts for each and every file in the project. Table 5
shows the results of analyzing the change burst
characteristics of all the three analyzed software.
Table 5: Change burst metrics of the analyzed software.
Identified Hubs
Max
burst
size
Number of
change
bursts
fastjson
TypeUtils.java 10 7
SerializeConfig.java 12 6
JavaBeanDeserializer.java 25 5
ParserConfig.java 20 4
ASMDeserializerFactory.java 14 3
ASMSerializerFactory.java 40 3
FastJsonHttpMessageConverter.
java
17 3
JSONPath.java 12 3
JSONSerializer.java 13 3
DefaultJSONParser.java 26 2
bitcoinj
WalletTest.java 8 4
Transaction.java 5 3
Peer.java 8 2
Wallet.java 20 2
AbstractBitcoinNetParams.java 3 1
PeerGroup.java 4 1
kairosdb
CassandraDatastore.java 4 3
CoreModule.java 3 1
DataPointsParser.java 4 1
DataPointsParserTest.java 5 1
DatastoreTestHelper.java 4 1
PutCommandTest.java 4 1
PutMillisecondCommand.java 4 1
In Table 5, the maximum burst size is the
maximum number of consecutive changes in all
qualified change bursts. On the other hand, number
of change bursts is defined as the number of
qualified change bursts for the given gap size and
burst size (set at 3 in this case). As discussed in the
work by Nagappan et.al., change bursts show risky
activities which are indicative of the fault-proneness
of software components. Hence, high amount of
change bursts and burst size could indicate that these
classes are particularly risky and fault prone.
Based on the results retrieved from Table 4 and
Table 5, the precision and recall is calculated. Table
6 depicts the precision and recall of the proposed
approach when compared against the change burst
metric, where the metric is used as the oracle in our
experiment.
Table 6: Precision and recall of the proposed approach.
Project Precision Recall
fastjson 0.6 0.677
bitcoinj 0.5 0.5
kairosdb 0.714 0.714
It is shown that the average precision of the
proposed approach, when applied on the three test
subjects is 0.61, while the average recall is 0.63. One
important factor contributed toward this observation
- we have set a high threshold value for the gap size
and burst size, i.e. 3. The reference threshold of 3
was proposed by (Nagappan et al. 2010) when
experimenting with the Windows Vista operating
system in order to identify potential fault prone
software components. It is reasonable to assume that
the amount of commit change for a very large-scale
commercial software like the Windows Vista is
going to be much more frequent and larger in
volume when compared to open-source software.
Hence, when we applied the gap size and burst size
of 3 to the three test subjects, only a small number of
classes were identified. We attempt to rerun the
experiment by varying the burst size from 1 to 3,
while fixing the gap size to 3 in order to provide
some leniency toward the time interval between
multiple commits since the chosen test subjects are
not particularly large scale projects. Table 7 shows
the experiment results.
Table 7: Precision and recall for varying the gap size and
change burst values.
Gap Size = 3, Burst Size = 1
Project Precision Recall
fastjson 0.8 0.6
bitcoinj 0.84 0.5
kairosdb 0.8 0.7
AVERAGE 0.813 0.6
Gap Size = 3, Burst Size = 2
Project Precision Recall
fastjson 0.76 0.8
bitcoinj 0.7 0.76
kairosdb 0.86 0.84
AVERAGE 0.77 0.8
Gap Size = 3, Burst Size = 3
Project Precision Recall
fastjson 0.6 0.677
bitcoinj 0.5 0.5
kairosdb 0.714 0.714
AVERAGE 0.605 0.63
ICSOFT 2018 - 13th International Conference on Software Technologies
446

When the burst size is fixed at 1, the average
precision improve significantly. However, this
decision is at the trade-off of relaxing the constraint
of change burst metric. Using a threshold value of 1
for burst size is only suitable for inactive project
which have very little amount of commit changes
throughout the project lifecycle. Besides that, the
average recall is low when the gap size and burst
size is fixed at 1. This is mainly because when the
threshold for burst size is low, a large amount of
independent commit changes are treated as a series
change burst activities when in fact they are just
regular and routine updates to the projects, i.e. two
commit changes which are 3 days apart (gap size =
3) are considered as two change burst activities
(burst size = 1).
On the other hand, when the burst size is 2, the
results yield average precision and recall of 0.77 and
0.8 respectively for all the 3 chosen projects. We
argued that the threshold value of 2 is relatively
more well-suited for our experiment setting since the
chosen projects are considered small to medium-
sized projects, with moderately active developers.
5 CONCLUSION AND FUTURE
WORK
While a lot of research were conducted in both
software-based network analysis and software
change coupling metrics, we found that there is a
lack of studies that attempted to combine both
approaches to identify potential fault prone software
components. In this paper, we have proposed a novel
way to model commit change-based weighted
complex network based on historical data mined
from GitHub. Three open-source were chosen to
evaluate our proposed approach. In order to identify
potential fault prone classes, we decided to use three
well-established graph theory metrics that have been
proven to correlate with the structural stability of
software components such as the weighted degree
centrality and the clustering coefficient. To validate
the accuracy of our proposed approach, we used the
change burst metric as the benchmark. When the
threshold of the gap size and burst size of the change
burst metrics were set at 3, the proposed approach
achieved mediocre precision and recall. It is when
the burst size threshold were relaxed, the precision
and recall of the proposed approach improved
significantly. During the experiment, we had
unintentionally discovered one of the limitations of
the proposed approach, where it is not suitable to be
applied on structural stable software, or software
that rarely undergo changes. We argued that this
limitation is negligible, since it is counter-intuitive
to use the proposed approach on high quality and
well-designed software to identify potential fault
prone classes.
As part of the future work, we plan to expand the
proposed approach by utilizing more graph theory
metrics such as the eigenvector centrality,
betweenness centrality, and closeness centrality in
order to improve the richness of the graph theory
analysis results. With the aid of more graph metrics,
we can then experiment the proposed approach on
larger-scale open-source or commercial software
systems.
ACKNOWLEDGEMENTS
This work was carried out within the framework of
the research project FP001-2016 under the
Fundamental Research Grant Scheme provided by
Ministry of Higher Education, Malaysia.
REFERENCES
Ajienka, N. and Capiluppi, A. 'Understanding the
Interplay between the Logical and Structural Coupling
of Software Classes', Journal of Systems and Software.
Ambros, M. D., Lanza, M. and Robbes, R. (2009) On the
Relationship Between Change Coupling and Software
Defects, translated by 135-144.
Baxter, G., Frean, M., Noble, J., Rickerby, M., Smith, H.,
Visser, M., Melton, H. and Tempero, E. (2006)
'Understanding the shape of Java software', SIGPLAN
Not., 41(10), 397-412.
Begel, A., Bosch, J. and Storey, M. A. (2013) 'Social
Networking Meets Software Development:
Perspectives from GitHub, MSDN, Stack Exchange,
and TopCoder', Software, IEEE, 30(1), 52-66.
Chatzigeorgiou, A. and Melas, G. (2012) Trends in object-
oriented software evolution: Investigating network
properties, translated by IEEE, 1309-1312.
Chong, C. Y. (2017) 'Commit Change-based WCN',
[online], available: https://github.com/chongchun
yong/Commit-Change-based-WCN [Accessed
27/12/2017].
Chong, C. Y. and Lee, S. P. (2015) 'Analyzing
maintainability and reliability of object-oriented
software using weighted complex network', Journal of
Systems and Software, 110, 28-53.
Chong, C. Y. and Lee, S. P. (2017) 'Automatic clustering
constraints derivation from object-oriented software
using weighted complex network with graph theory
analysis', Journal of Systems and Software, 133,28-53.
A Commit Change-based Weighted Complex Network Approach to Identify Potential Fault Prone Classes
447

Concas, G., Marchesi, M., Murgia, A., Tonelli, R. and
Turnu, I. (2011) 'On the Distribution of Bugs in the
Eclipse System', IEEE Transactions on Software
Engineering, 37(6), 872-877.
Concas, G., Marchesi, M., Pinna, S. and Serra, N. (2007)
'Power-Laws in a Large Object-Oriented Software
System', Software Engineering, IEEE Transactions on,
33(10), 687-708.
Gousios, G., Pinzger, M. and Deursen, A. v. (2014) 'An
exploratory study of the pull-based software
development model', in Proceedings of the 36th
International Conference on Software Engineering,
Hyderabad, India, 2568260: ACM, 345-355.
Hassan, A. E. (2009) 'Predicting faults using the
complexity of code changes', in Proceedings of the
31st International Conference on Software Engineer-
ing, 1555024: IEEE Computer Society, 78-88.
Huang, Q., Xia, X. and Lo, D. (2017) Supervised vs
Unsupervised Models: A Holistic Look at Effort-
Aware Just-in-Time Defect Prediction, translated by
159-170.
Hyland-Wood, D., Carrington, D. and Kaplan, S. (2006)
Scale-free nature of java software package, class and
method collaboration graphs, translated by.
Kagdi, H., Gethers, M. and Poshyvanyk, D. (2013)
'Integrating conceptual and logical couplings for
change impact analysis in software', Empirical
Software Engineering, 18(5), 933-969.
Kalliamvakou, E., Gousios, G., Blincoe, K., Singer, L.,
German, D. M. and Damian, D. (2015) 'An in-depth
study of the promises and perils of mining GitHub',
Empirical Software Engineering, 1-37.
LaBelle, N. and Wallingford, E. (2004) 'Inter-package
dependency networks in open-source software', arXiv
preprint cs/0411096.
Louridas, P., Spinellis, D. and Vlachos, V. (2008) 'Power
laws in software', ACM Trans. Softw. Eng. Methodol.,
18(1), 1-26.
Ma, Y. T., He, K. Q., Li, B., Liu, J. and Zhou, X. Y.
(2010) 'A Hybrid Set of Complexity Metrics for
Large-Scale Object-Oriented Software Systems',
Journal of Computer Science and Technology, 25(6),
1184-1201.
Malliaros, F. D. and Vazirgiannis, M. (2013) 'Clustering
and community detection in directed networks: A
survey', Physics Reports-Review Section of Physics
Letters, 533(4), 95-142.
Muthukumaran, K., Choudhary, A. and Murthy, N. L. B.
(2015) Mining GitHub for Novel Change Metrics to
Predict Buggy Files in Software Systems, translated by
15-20.
Myers, C. R. (2003) 'Software systems as complex
networks: Structure, function, and evolvability of
software collaboration graphs', Physical Review E,
68(4), 046116.
Nagappan, N., Zeller, A., Zimmermann, T., Herzig, K. and
Murphy, B. (2010) Change bursts as defect predictors,
translated by IEEE, 309-318.
Orrú, M., Monni, C., Marchesi, M., Concas, G. and
Tonelli, R. (2015) Predicting Software Defectiveness
through Network Analysis, translated by.
Oyetoyan, T. D., Falleri, J. R., Dietrich, J. and Jezek, K.
(2015) Circular dependencies and change-proneness:
An empirical study, translated by 241-250.
Pang, T. Y. and Maslov, S. (2013) 'Universal distribution
of component frequencies in biological and
technological systems', Proceedings of the National
Academy of Sciences.
Potanin, A., Noble, J., Frean, M. and Biddle, R. (2005)
'Scale-free geometry in OO programs', Commun.
ACM, 48(5), 99-103.
Ravasz, E. and Barabasi, A. L. (2003) 'Hierarchical
organization in complex networks', Phys Rev E Stat
Nonlin Soft Matter Phys, 67(2 Pt 2), 026112.
Tang, Y., Li, M., Wang, J., Pan, Y. and Wu, F.-X. (2015)
'CytoNCA: A cytoscape plugin for centrality analysis
and evaluation of protein interaction networks',
Biosystems, 127(Supplement C), 67-72.
Turnu, I., Concas, G., Marchesi, M. and Tonelli, R. (2013)
'The fractal dimension of software networks as a
global quality metric', Information Sciences, 245(0),
290-303.
Turnu, I., Marchesi, M. and Tonelli, R. (2012) Entropy of
the degree distribution and object-oriented software
quality, translated by 77-82.
Valverde, S. and Solé, R. V. (2003) 'Hierarchical small
worlds in software architecture', arXiv preprint cond-
mat/0307278.
Watts, D. J. and Strogatz, S. H. (1998) 'Collective
dynamics of 'small-world' networks', Nature,
393(6684), 440-442.
Wiese, I. S., Kuroda, R. T., Re, R., Oliva, G. A. and
Gerosa, M. A. (2015) 'An Empirical Study of the
Relation Between Strong Change Coupling and
Defects Using History and Social Metrics in the
Apache Aries Project' in Damiani, E., Frati, F., Riehle,
D. and Wasserman, A. I., eds., Open Source Systems:
Adoption and Impact: 11th IFIP WG 2.13
International Conference, OSS 2015, Florence, Italy,
May 16-17, 2015, Proceedings, Cham: Springer
International Publishing, 3-12.
Xia, X., Lo, D., Pan, S. J., Nagappan, N. and Wang, X.
(2016) 'HYDRA: Massively Compositional Model for
Cross-Project Defect Prediction', IEEE Transactions
on Software Engineering, 42(10), 977-998.
Yang, X., Lo, D., Xia, X. and Sun, J. (2017) 'TLEL: A
two-layer ensemble learning approach for just-in-time
defect prediction', Information and Software
Technology, 87(Supplement C), 206-220.
Zimmermann, T. and Nagappan, N. (2008) Predicting
defects using network analysis on dependency graphs,
translated by ACM, 531-540.
Zimmermann, T., Weisgerber, P., Diehl, S. and Zeller, A.
(2004) 'Mining Version Histories to Guide Software
Changes', in Proceedings of the 26th International
Conference on Software Engineering, 999460: IEEE
Computer Society, 563-572.
ICSOFT 2018 - 13th International Conference on Software Technologies
448
